Levels StopTP
- 指标
- Anton Polkovnikov
- 版本: 1.11
- 更新: 25 九月 2023
- 激活: 5
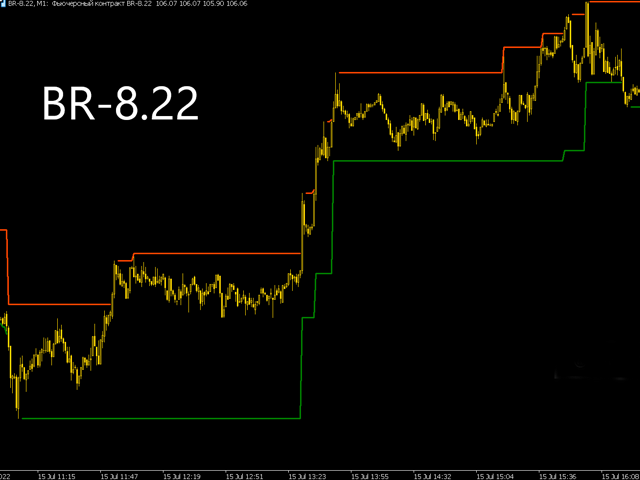
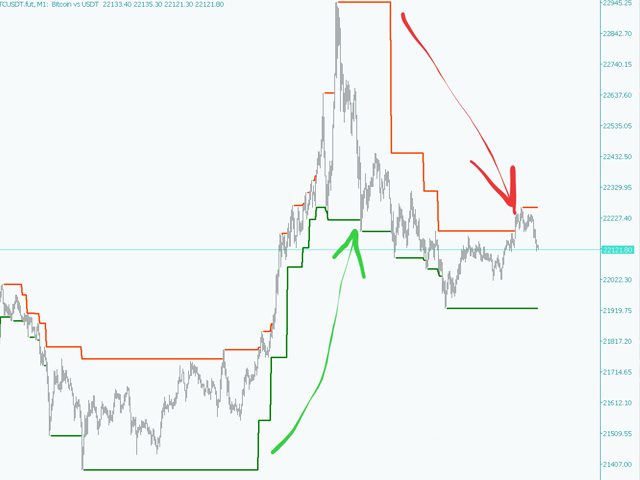
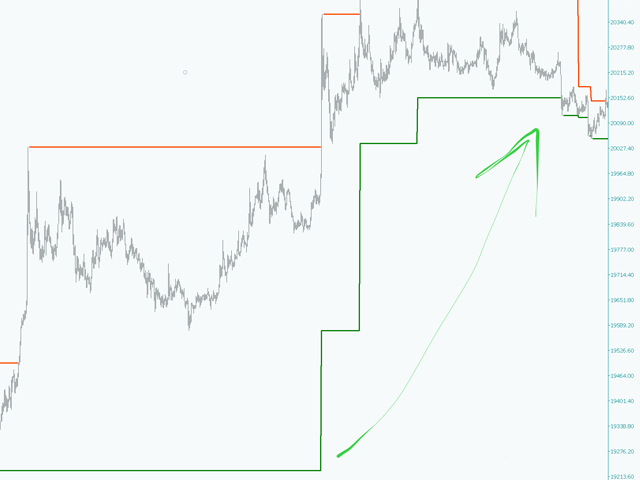
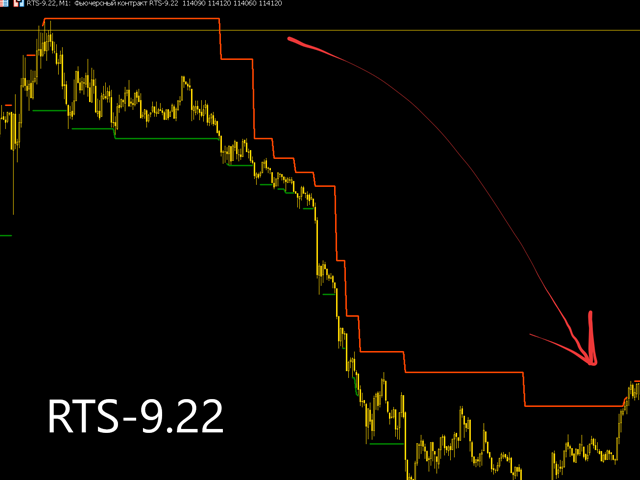
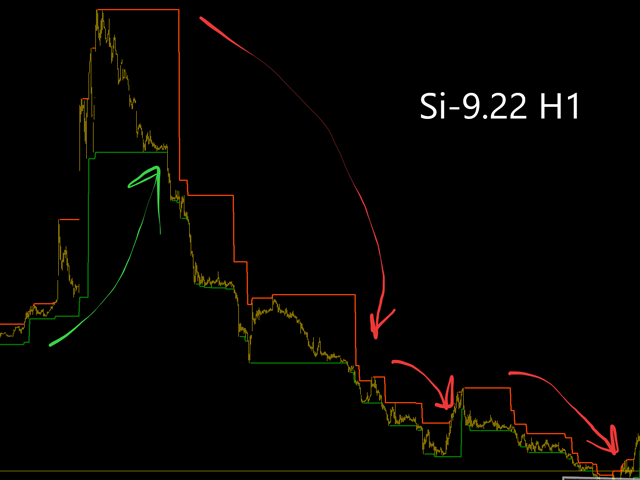
水平(極值、止損、獲利)
用於更改止損訂單的放置水平(由用戶手動完成,指標僅可視化水平)。它也可用於在與運動相反的水平上獲取部分利潤。 該指標將允許您採取大部分強勁的運動。您不必擔心過早退出該職位。如果您陷入強勢走勢,只需觀察支撐位並在價格突破該水平時止損退出。 該指標並非旨在搜索入場位置
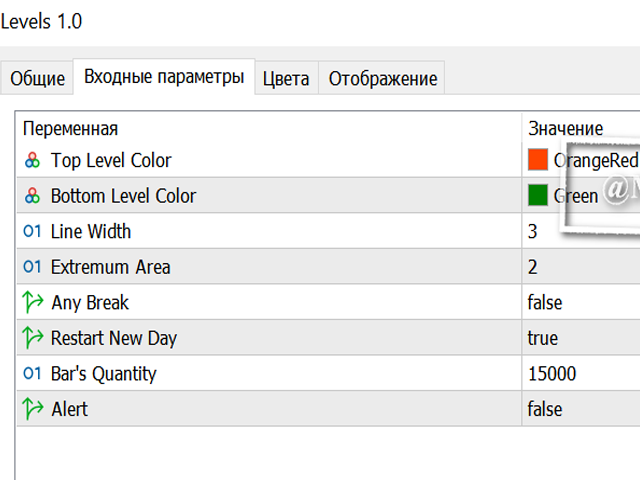
設置:
- 極值區域 - 最初搜索極值的區域。 在這種情況下,之前有 2 根蠟燭,之後有 2 根蠟燭。
- 类型级别-负责级别的值-蜡烛的极端或收盘价
- Any Break - 啟用此參數可在第一級更改時提供更高的靈敏度。
- 重新開始新的一天 - 用於具有潛在大範圍第一根蠟燭的工具的日內圖表。 否則,第一根帶有尾巴的蠟燭可能會立即決定全天的水平。
- Bar's Quantity - 顯示指標的左側蠟燭數
....
演示版在"讨论"。 出于某种原因,MQL默认制作的演示不起作用。