Noize Absorption Index - is the manual trading system that measures the difference of pressure between bears forces and bulls forces. Green line - is a noize free index that showing curent situation. Zero value of index shows totally choppy/flat market.Values above zero level shows how powerfull bullish wave is and values below zero measures bearish forces.Up arrow appears on bearish market when it's ready to reverse, dn arrow appears on weak bullish market, as a result of reverse expectation.
Indicator and Expert Adviser EA Available in the comments section of this product. Download with Indicator must have indicator installed for EA to work.
Mt5 indicator alerts for bollinger band and envelope extremes occurring at the same time. Buy signal alerts occur when A bullish candle has formed below both the lower bollinger band and the lower envelope Bar must open and close below both these indicators. Sell signal occur when A bear bar is formed above the upper bollinger band and upp
Improved version of the free HMA Trend indicator (for MetaTrader 4) with statistical analysis. HMA Trend is a trend indicator based on the Hull Moving Average (HMA) with two periods. HMA with a slow period identifies the trend, while HMA with a fast period determines the short-term movements and signals in the trend direction.
The main differences from the free version: Ability to predict the probability of a trend reversal using analysis of history data. Plotting statistical charts for analyz
Binary Options Assistant (BOA) Multi Currency Dashboard for Binary Options (MT5) .
You can use any of the BOA Signals Indicators with the dashboard. Just change the BOA Signals Indicator Name in the dashboard settings to the indicator you want to get signals from. For example: CHILL. BLAZE: BOA_BLAZE_Indicator_v1 Strategy : BLW Online Trading Binary Options Strategy (3 Moving Average)
LAVA: BOA_LAVA_Indicator_v1 Strategy: Lady Trader Binary Options Strategy (Bollinger Bands & Stoc
Was: $249 Now: $99 Market Profile defines a number of day types that can help the trader to determine market behaviour. A key feature is the Value Area, representing the range of price action where 70% of trading took place. Understanding the Value Area can give traders valuable insight into market direction and establish the higher odds trade. It is an excellent addition to any system you may be using. Inspired by Jim Dalton’s book “Mind Over Markets”, this indicator is designed to suit the
Laguerre SuperTrend Clouds adds an Adaptive Laguerre averaging algorithm and alerts to the widely popular SuperTrend indicator. As the name suggests, Laguerre SuperTrend Clouds (LSC) is a trending indicator which works best in trendy (not choppy) markets. The SuperTrend is an extremely popular indicator for intraday and daily trading, and can be used on any timeframe. Incorporating Laguerre's equation to this can facilitate more robust trend detection and smoother filters. The LSC uses the
The Penta-O is a 6-point retracement harmonacci pattern which usually precedes big market movements. Penta-O patterns can expand and repaint quite a bit. To make things easier this indicator implements a twist: it waits for a donchian breakout in the right direction before signaling the trade. The end result is an otherwise repainting indicator with a very reliable trading signal. The donchian breakout period is entered as an input. [ Installation Guide | Update Guide | Troubleshooting | FAQ | A
Crash 1000 Scalping Indicator for the Crash 1000 Deriv Synthetic Index. Introduction The Crash 1000 Scalping Indicator is a specialized tool designed for the Crash 1000 index on the Deriv Synthetic market. This indicator is particularly useful for scalping on the M1 timeframe, helping traders to identify precise entry and exit points for buy positions. It is designed to be non-repainting, providing clear signals with audible alerts and push notifications, and is compatible with mobile devices th
No Demand No Supply This indicator identifies No Demand –No Supply candles to your chart and plots volume bars colored according to the signal. It can be applied to all timeframes or to a specific one only. It can also be used as regular volume indicator with exceptional future of WEIGHTED VOLUME. Furthermore is has an alert notification, sound and email when a signals occurs. The indicator does not repaint but the alert will come on two candles back due to the definition of No Demand No Su
>>> BIG SALE PROMOTION: 50% OFF + GIFT EA! - Promo price: $64 / Regular price $129 <<< - The promotion will end soon!
The Forex Trend Tracker is an advanced tool designed to enhance the trading capabilities of forex traders. This sophisticated indicator uses complex mathematical formulas alongside the Average True Range (ATR) to detect the beginnings of new upward and downward trends in the forex market. It offers visual cues and real-time alerts to give traders a competitive advantage in th
The indicator displays a matrix of indicators across multiple timeframes with a sum total and optional alert. Custom indicators can also be added to the matrix, in a highly configurable way. The alert threshold can be set to say what percentage of indicators need to be in agreement for an alert to happen. The alerts can turned on/off via on chart tick boxes and can be set to notify to mobile or sent to email, in addition to pop-up. The product offers a great way to create an alert when multiple
Terra Infinity is a flat indicator.
This improved version of the CalcFlat indicator has three additional lines that significantly increase its effectiveness. Unlike its predecessor with two static levels, Terra Infinity adds three dynamic lines above the main histogram, which are interpreted as follows:
base signal line, minimum signal line, maximum signal line. These lines are formed using the additional parameter Avg, which is the average value of the histogram. Averaging produces a line
The indicator plots charts of profit taken at the Close of candles for closed (or partially closed) long and short positions individually. The indicator allows to filter deals by the current symbol, specified expert ID (magic number) and the presence (absence) of a substring in a deal comment, to set the start time and the periodicity of profit reset (daily, weekly or monthly) to calculate the profit chart. The indicator also displays the floating (not fixed) profit of the opened positions at th
To get access to MT4 version please click here . - This is the exact conversion from TradingView: "Stochastic Momentum Index" By "UCSgears". - This is a popular version of stochastic oscillator on tradingview. - This is a light-load processing and non-repaint indicator. - Buffers are available for the lines on chart. - You can message in private chat for further changes you need. Thanks for downloading
To get access to MT4 version please click here . This is the exact conversion from TradingView: "[SHK] Schaff Trend Cycle (STC)" by "shayankm". This is a light-load processing indicator. This is a non-repaint indicator. Buffers are available for processing in EAs. All input fields are available. You can message in private chat for further changes you need. Thanks for downloading
This MT5 indicator has been designed to be used on any currency pair and any time frame . It has the scalper and swing trader in mind. The indicator looks for short-term high-probability reversals in price and will indicate to you to go long (buy) or short (sell) if you see a green or red arrow next to the current candlestick respectively. The indicator provides the best trading opportunities to you during the active trading hours of London and New York, but it will continue to give signals al
This is Gekko's customizable version of the famous Heiken Ashi indicator. It extends the use of the famous Heiken Ashi and calculates strong entry and exit signals. Inputs Number of Bars to Plot Indicator: number of historical bars to plot the indicator, keep it low for better performance; Produce Arrow Signals: determine if the indicator will plot arrow signal for long/short; Produces Signal Only When a Bar Closes: wait for a bar to close to produce a signal (more accurate, by delayed entry
The Riko Trend indicator is a revolutionary trend trading and filtering solution with all the important features of a trend tool built into one tool! The Riko Trend indicator is good for any trader, suitable for any trader for both forex and binary options. You don’t need to configure anything, everything is perfected by time and experience, it works great during a flat and in a trend.
The Riko Trend indicator is a technical analysis tool for financial markets that reflects the current price
The indicator displays in a separate window a price chart as bars or Japanese candlesticks with a periodicity below a minute. Available periods (seconds): 30, 20, 15, 12, 10, 6, 5, 4, 3, 2, 1. The display mode (bars or candlesticks) is switched by clicking on the chart.
Parameters Period in seconds - the period of bars in seconds Price levels count - the number of price levels on a chart Buffer number: 0 - Open, 1 - High, 2 - Low, 3 - Close, 4 - Color.
Be notified of every color change of Heiken Ashi (HA) candles. The indicator will trigger past and new signals every time that HA candles change their colors. ( Note : this tool is based on the code of Heiken Ashi indicator developed by MetaQuotes Software Corp.)
Features The signals are triggered at closing of last bar/opening of a new bar; Any kind of alerts can be enabled: Dialog Box, Email message, SMS notifications for smartphones and tablets, and Sound alerts; By default, up arrows are p
Reversal First Impulse levels (RFI) INSTRUCTIONS RUS - ENG R ecommended to use with an indicator - TPSpro TREND PRO - Version MT4 A key element in trading is zones or levels from which decisions to buy or sell a trading instrument are made. Despite attempts by major players to conceal their presence in the market, they inevitably leave traces. Our task was to learn how to identify these traces and interpret them correctly.
Main functi
通过 mql5 和 Telegram 上 的晨间简报获取每日市场更新,包括详细信息和屏幕截图 ! FX Power MT5 NG 是我们长期以来非常受欢迎的货币强度计算器 FX Power 的下一代产品。 这款下一代强度计算器能提供什么?您所喜爱的原版 FX Power 的所有功能 附加功能 黄金/XAU 强度分析 更精确的计算结果 可单独配置的分析周期 可自定义计算限制,以获得更好的性能 为希望查看更多信息的用户提供特殊的多实例设置 无尽的图形设置,可在每个图表中设置您最喜欢的颜色 无数的通知选项,让您再也不会错过任何重要信息 采用 Windows 11 和 macOS 风格的全新圆角设计 神奇的移动指标面板
FX Power 主要功能 所有主要货币的完整强势历史 所有时间框架内的货币强弱历史 所有经纪商和图表的计算结果完全相同 100% 可靠的实时计算 -> 无重绘 可通过下拉列表选择分析时段
通过自定义模式单独配置分析时段 可在一个图表中使用多个实例 可移动 FX Power 显示屏(通过拖放) 适用于高分辨率 QHD、UHD 和 4K 显示器 自动终端配置 针对平板电脑
Easy By Sell is a market indicator for opening and closing positions. It becomes easy to track market entries with alerts.
It indicates trend reversal points when a price reaches extreme values and the most favorable time to enter the market. it is as effective as a Fibonacci to find a level but it uses different tools such as an algorithm based on ATR indicators and Stochastic Oscillator. You can modify these two parameters as you wish to adapt the settings to the desired period.
My othe
IX Power 终于将 FX Power 的无与伦比的精确性带到了非外汇交易符号中。
它能准确判断您喜爱的指数、股票、商品、ETF 甚至加密货币的短期、中期和长期趋势强度。
您可以 分析 终端提供的 一切 。试试吧,体验一下您在交易时如何把握 时机 。
IX Power 主要功能
100% 精确的非重绘计算结果 - 适用于您终端中的所有交易符号 下拉式选择预配置以及可单独配置的强度分析周期 通过电子邮件、消息和手机通知的无数种通知选项
可访问的 EA 请求缓冲区 可自定义计算限制,以获得更好的性能
为希望查看更多信息的用户提供特殊的多实例设置 无尽的图形设置,让您在每个图表中都能找到最喜欢的颜色
采用 Windows 11 和 macOS 风格的圆角新面板设计
神奇的移动指标面板,可在子窗口和主图表之间无缝移动 适用于高分辨率 QHD、UHD 和 4K 显示器,并针对平板电脑和触摸屏进行了优化
IX Power 参数 最重要的参数不言自明,但我们很快会在另一篇文章中为您提供所有 IX Power 参数的完整说明。
使用别名 "参数可为技术交易符号
note: this indicator is for METATRADER4, if you want the version for METATRADER5 this is the link: https://www.mql5.com/it/market/product/108106 TRENDMAESTRO ver 2.4 TRENDMAESTRO recognizes a new TREND in the bud, he never makes mistakes. The certainty of identifying a new TREND is priceless. DESCRIPTION TRENDMAESTRO identifies a new TREND in the bud, this indicator examines the volatility, volumes and momentum to identify the moment in which there is an explosion of one or more of these data a
Golden Spikes Detector Acknowledgement and Dedications: The name of this indicator was Inspired by an Original; Mr Grant Koopman; a Knowledgeable and experienced Synthetics trader. I dedicate this indicator to Mr Grant.
Overview: The Golden Spikes Premium is a groundbreaking trading indicator meticulously crafted for the Boom and Crash indices on the Deriv market. Tailored to meet the needs of discerning traders, this powerful tool operates exclusively on the one-minute timeframe, providin
Step into the realm of Forex trading with confidence and precision using XQ, a cutting-edge Forex indicator designed to elevate your trading game to unprecedented heights. Whether you're a seasoned trader or just stepping into the world of currency exchange, XQ Forex Indicator empowers you with the insights and signals needed to make informed trading decisions. The signal conditions are a combination of three indicators, and XQ Forex Indicator only display medium and long-term trends . The ind
The Smart Liquidity Profile is color-coded based on the importance of the traded activity at specific price levels, allowing traders to identify significant price levels such as support and resistance levels, supply and demand zones, liquidity gaps, consolidation zones, Buy-Side/Sell-Side Liquidity and so on. Smart Liquidity Profile allows users to choose from a number of different time periods including 'Auto,' 'Fixed Range,' 'Swing High,' 'Swing Low,' 'Session,' 'Day,' 'Week,' 'Month,' 'Quart
The Volumebyprice.com Indicator for MetaTrader 5 features Volume Profile and Market Profile TPO (Time Price Opportunity). Volume and TPO histogram bar and line charts. Volume Footprint charts. TPO letter and block marker collapsed and split structure charts. Static, dynamic and flexible range segmentation and compositing methods with relative and absolute visualizations. Session hours filtering and segment concatenation with Market Watch and custom user specifications. Graphical layering, posit
Volatility Trend System - a trading system that gives signals for entries. The volatility system gives linear and point signals in the direction of the trend, as well as signals to exit it, without redrawing and delays. The trend indicator monitors the direction of the medium-term trend, shows the direction and its change. The signal indicator is based on changes in volatility and shows market entries.
The indicator is equipped with several types of alerts. Can be applied to various trading in
Gartley Hunter Multi - An indicator for searching for harmonic patterns simultaneously on dozens of trading instruments and on all possible timeframes. Manual (Be sure to read before purchasing) | Version for MT4 Advantages 1. Patterns: Gartley, Butterfly, Shark, Crab. Bat, Alternate Bat, Deep Crab, Cypher
2. Simultaneous search for patterns on dozens of trading instruments and on all possible timeframes
3. Search for patterns of all possible sizes. From the smallest to the largest
4. A
Was: $299 Now: $99 Supply Demand uses previous price action to identify potential imbalances between buyers and sellers. The key is to identify the better odds zones, not just the untouched ones. Blahtech Supply Demand indicator delivers functionality previously unavailable on any trading platform. This 4-in-1 indicator not only highlights the higher probability zones using a multi-criteria strength engine, but also combines it with multi-timeframe trend analysis, previously confirmed swings
A new type of indicator for Professional and Experienced Traders. Specifically designed for trend identification. A great tool for investors to invest at the right and suitable time for decent trading. You can present it to your potential clients and customers for their satisfaction.
A very handy and trendy tool. Easy to read , comprehend and user friendly. By this tool you can easily identify the potential to enter in trading and low potential to exit. Best of Luck!
A Good , Easy , Readable and handy indicator for experienced and professional traders. It gives bounded signals between zero and one. Easy for investors to comprehend. It gives near and longer trading outlook to investors and helps them to find good opportunities. Indicator gives zero signal on price downturns and signal value equals to one on price upturns. Once again a new type of indicator and rangebound between zero and one .
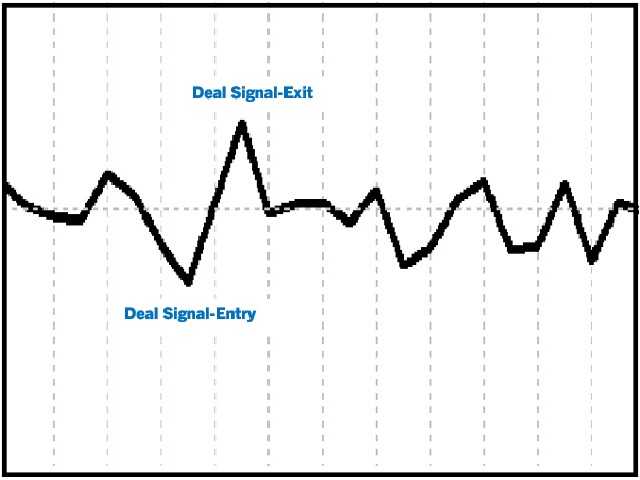
A very Simple Indicator for experienced and professional traders. It indicates direction of trade and provides signals of best deals. Signal is referred here a point on chart where indicator line turns its direction or converges. This indicator finds underlaying trading asset trade direction and indicates best scenarios of trade as described in screenshots. Where it has run for a period of time and converges to best deal scenarios.
Have a Look!
A value indicator. It is helping tool to indicate the direction of value gain. A best helping tool to trade value. This indicator is equipped with a colored line and a digital tool to indicate value numerically .
This indicator also helps to indicate value during trends. A study based on this indicator shows value of trade significantly changes during trends best tool to chase the trends.
A basic tool for experienced and professional traders to trade percentile of the value. It indicates both values in the form of digits appeared on the left corner of the screen.
Instructions Manual : First choose your desired symbol and then select this tool. Please be remined that this tool is just a helping tool. its upon trader what he chooses. The function of this tool is just to provide a help in trading.
A technical Indicator Providing Price Convergence Signals along with value for experienced and professional traders. Easy to comprehend, Easy to understand.
This is a helping tool provides best signals. This indicator is designed based on the fundamentals of trade. A very good indicator you can customized its color. A best tool to find trade direction.
An adaptive indicator. It constantly adapts to the trade.
A very good indicator for Experienced and Professional Traders. A practical approach to trading. Easy to understand. A helping tool for traders looking for price movements .
Signals: Signal Number 1: When yellow line which is a signal line crossing the zero line towards downward direction is a selling opportunity. Signal Number 2:
When yellow line which is a signal line crossing the zero line towards upward direction is a buying opportunity.
Un indicador bueno, fácil, legible y práctico. Da señales acotadas entre cero y uno. Fácil de comprender para los inversores. Brinda perspectivas comerciales cercanas y a más largo plazo a los inversores y los ayuda a encontrar buenas oportunidades. El indicador da una señal cero en las caídas de precios y el valor de la señal es igual a uno en las subidas de precios. Una vez más, un nuevo tipo de indicador y rango limitado entre cero y uno.
A technical Indicator Providing Price Convergence Signals along with value for experienced and professional traders. Easy to comprehend, Easy to understand.
This is a helping tool provides best signals. This indicator is designed based on the fundamentals of trade. A very good indicator you can customized its color. A best tool to find trade direction.
An adaptive indicator. It constantly adapts to the trade.
A value indicator for experienced and professional traders. It is helping tool to indicate the direction value gain. A best helping tool to trade value. This indicator is equipped with a colored line and a digital tool to indicate value numerically .
This indicator also helps to indicate value during trends. A study based on this indicator shows value of trade significantly changes during trends best tool to cash the trends.
Best helping tool for Professional and Experienced traders. A best Tool To find the trend. Instruction Manual: First Select your desired Symbol. Then attach this tool and wait till it identify the trend for you. Then it will be more feasible to trade.
Once again best tool to trade. Demo version is available you can fully test its functionality. More importantly there are always trend breaks Once Trend break is observed un-attach this tool and then re-attach to get the fresh trend. Precautions
A basic tool for traders to trade percentile of the value. It indicates both values in the for of digits appeared on the left corner of the screen.
Instructions Manual : First choose your desired symbol and then select this tool. Please be remined that this tool is just a helping tool. its upon trader what he chooses. The function of this tool is just to provide a help in trading.
A very good indicator for experienced and professional traders . A practical approach to trading. Easy to understand. A helping tool for traders looking for price movements .
Signals: Signal Number 1: When yellow line which is a signal line crossing the zero line towards downward direction is a selling opportunity. Signal Number 2:
When yellow line which is a signal line crossing the zero line towards upward direction is a buying opportunity.