
Synchronized Charts
- 实用工具
- Jinsong Zhang
- 版本: 1.47
- 更新: 20 十一月 2021
- 激活: 10
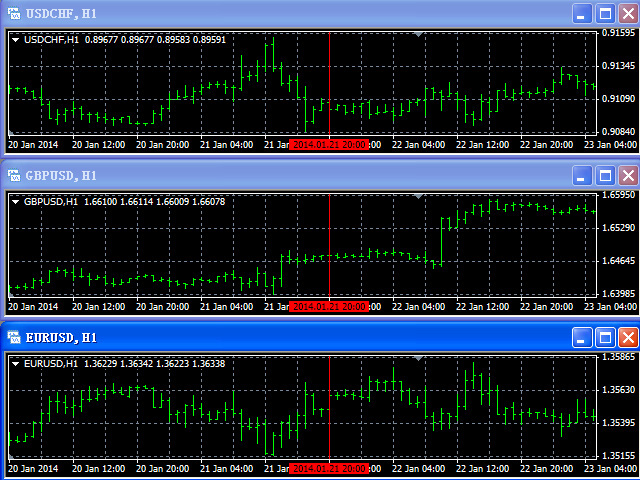
本产品可以方便用户比较不同图表的K线,还可以方便地查看同一商品在不同时间周期中的K线形态。
将脚本附加到一个图表上,移动K线,或者改变显示比例,所有打开的图表上的K线将与当前的图表上的K线按照时间对齐,并且同步移动。
如果不同图表上的K线的周期不同,将会根据K线的起始时间进行对齐。
使用前请确保相关的历史数据已经下载到本地。
欢迎提出宝贵建议或意见,请与我联系。
——————————————————————————————————————————————————————————————————————————————————————
。。。。。。。。。。。。。。。。。。。。。。。。。。。。。。。。。。。。。。。。。。。。。。。。。。。。。。。。。。。。。。


Incredibly useful tool for backtesting a single pair across multiple time frames as ‘the future’ charts are hidden when aligned to the right of the screen. F12 scrolls all time frames that are open simultaneously, allowing for multi time frame historic analysis - works very well.