Bollinger Bands Cross Alert MT5
- 指标
- Issam Kassas
- 版本: 1.10
- 更新: 23 六月 2022
- 激活: 5
Description:
For a comprehensive understanding of our indicators, we invite you to explore the entire Q&A section within this MQL5 blog post here.
The Bollinger Bands Cross Alert Indicator is a versatile tool in the world of technical analysis, designed to assist traders in identifying potential trend reversals and significant price movements. This powerful indicator is based on Bollinger Bands, a popular volatility indicator, and offers real-time alerts for accurate and timely trading decisions.
Key Features:
-
Bollinger Bands: At the core of this indicator are the Bollinger Bands, which consist of a centerline (simple moving average) and two outer bands representing standard deviations from the centerline. The bands dynamically adjust based on market volatility, expanding during periods of high volatility and contracting during low volatility.
-
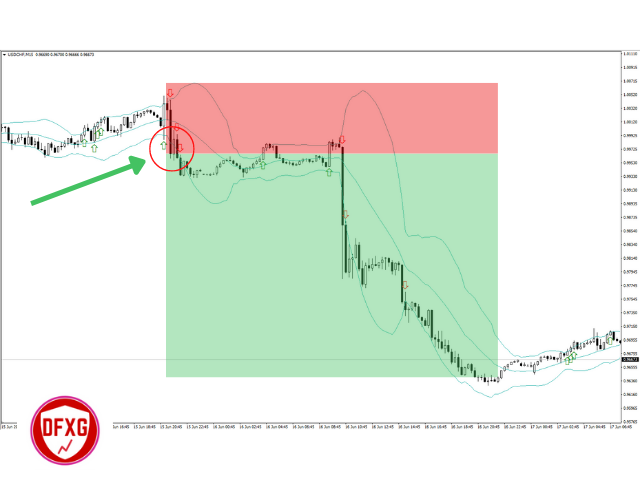
Cross Alert Signals: The indicator generates signals when the price crosses above or below the upper or lower Bollinger Bands. A bullish signal occurs when the price crosses above the upper band, suggesting potential upward momentum. Conversely, a bearish signal is triggered when the price crosses below the lower band, indicating a possible downtrend.
-
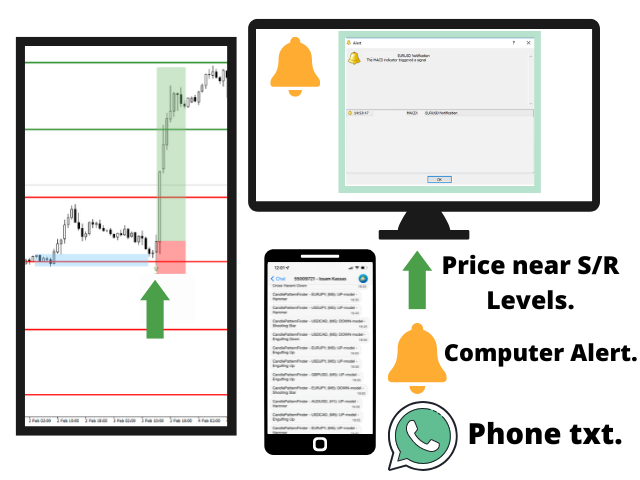
Customizable Alerts: Stay on top of the market with real-time alerts. The indicator allows you to set personalized alerts for bullish and bearish crosses, so you never miss an opportunity.
-
Volatility Assessment: Analyze market volatility by observing the width between the Bollinger Bands. Wider bands indicate higher volatility, while narrower bands suggest lower volatility. Understanding volatility can help you anticipate potential price breakouts or reversals.
-
Confirmation with Other Indicators: Enhance your trading strategies by combining Bollinger Bands signals with other technical indicators, such as RSI or MACD, for added confirmation.
How to Use:
-
Trend Identification: Watch for the price to touch or cross the upper or lower Bollinger Bands. An uptrend is likely when the price stays above the centerline or crosses above the upper band. Conversely, a downtrend is possible when the price remains below the centerline or crosses below the lower band.
-
Volatility Assessment: Monitor the width of the Bollinger Bands. Increasing width indicates rising volatility, while decreasing width signals reduced volatility. High volatility may precede major price movements.
-
Overbought and Oversold Levels: Pay attention to price action near the Bollinger Bands. Prices near the upper band may suggest an overbought condition, while prices near the lower band may indicate an oversold condition.
-
Divergence: Look for divergence between price and the Bollinger Bands. Divergence can indicate potential trend reversals.
-
Risk Management: Implement sound risk management techniques, such as setting sl and tp levels, to safeguard your capital during market fluctuations.
