Master Point Indicator
- 指标
- Tom Seljakin
- 版本: 1.41
- 更新: 27 九月 2022
- 激活: 5
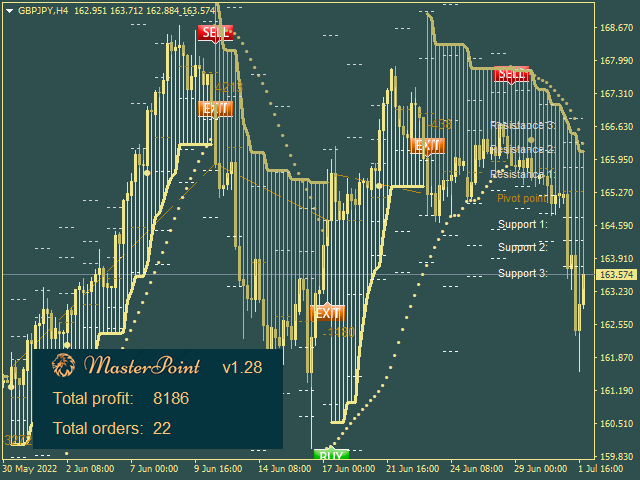
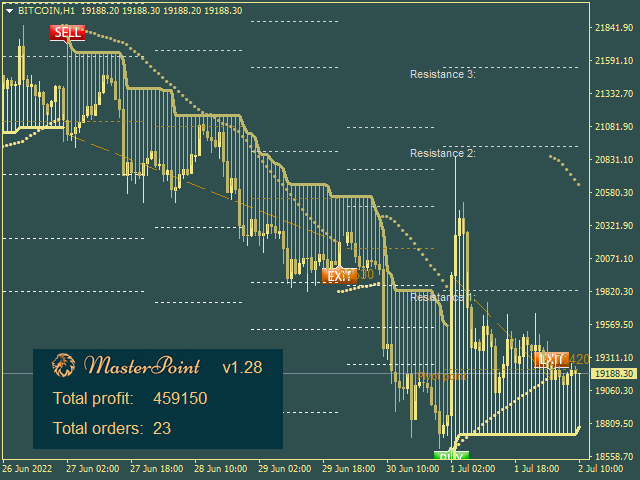
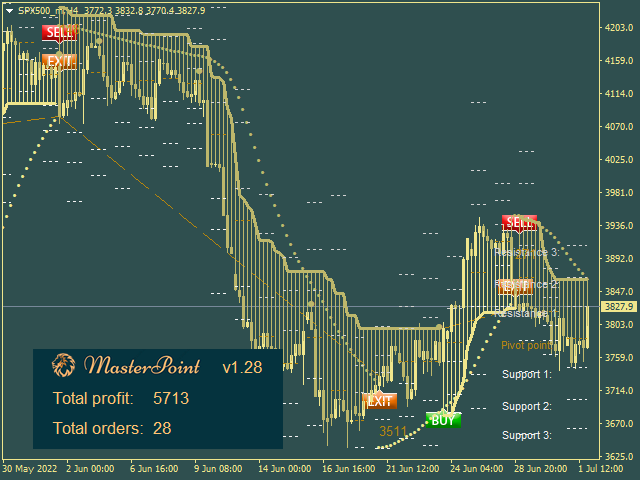
Master Point is an indicator set that includes the most powerful and necessary tools for a trader, giving that very edge in the markets to be successful. An indicator that has an elegant and complete system that works very well in all markets (Forex, Crypto, Stocks, Indices) helps to find the best reversal points. It has tools such as trend reversal detection, pivot points, divergences, currency strength and 'candle strength'. All this makes the indicator a complete tool that does not require any other indicators!
Check our telegram group for the best forex tools and information.
The main features of the indicator:
- Includes all the necessary tools for successful trading- most indicators, one way or another, require some kind of addition (additional filters, secondary strategies, etc.). However, the Master Point indicator is a full-fledged indicator! It uses a simple strategy to show when trend is ready to change, price action and divergence to find the best points to enter into a trade, pivot levels to find the best points to take your profits, and currency strength to make entries more accurate.
- Elegant strategy - All tools are very elegantly simple, but at the same time they are the most effective. That allows the indicator to be used in many markets.
- Easy to use - minimal settings, simple visual signals... Everything is designed to make trading with convenience and ease.
- Suitable for both long-term trading and scalping - thanks to several tools, the indicator can be adjusted for different trading styles.
- It's real deal - the indicator does not repaint, signals are received only on closed bars, all calculations are made in real time.
Full guide on how to use the indicator you can find here.
General rules on how to trade with the indicator:
The indicator has three main components:
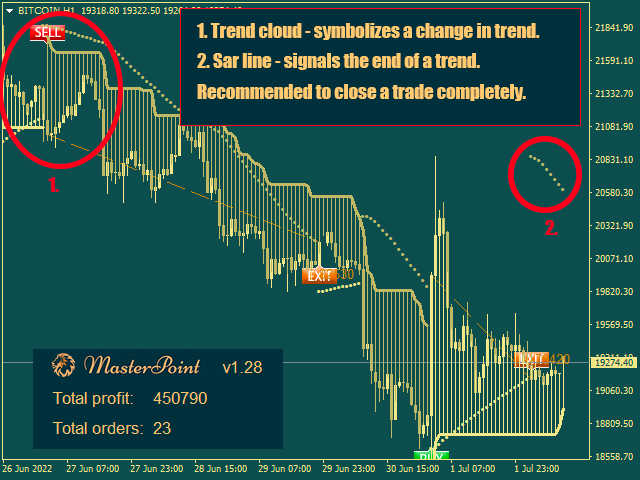
a) Trend cloud- when a new trend emerges, the cloud changes its color.
b) Signal bars - confirms the direction of a new trend.
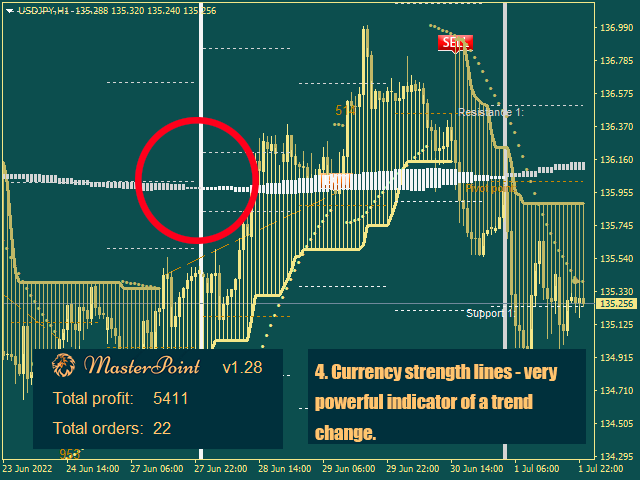
с) Currency stregth lines- when the lines cross, it confirms or even signals a new trend (if the currency strength indicator signal appeared before the Trend Cloud signal).
All three components can work together or separately (confirming the strength of the current trend).
1) Wait for the trend cloud to chage its color. The change of color indicates the formation of a new trend. On many currency pairs, indices, cripto, this signal is already more than enough to enter the market. Recomended timeframes are H1/H4/D1.
2) Also you can wait for a signal candle, confirming the intention of the market to move further in a new direction. Signal candles are determined by powerful divergence formulas, bursts of volatility, and also several price action formulas.
3) Currency strength lines - cross can be used as a separate signal. When the lines intersect, it symbolizes a trend change (same as Trend Cloud). Can used for scalping trading on the lower timeframes using currency strength lines from the higher timeframes.
Exit points:
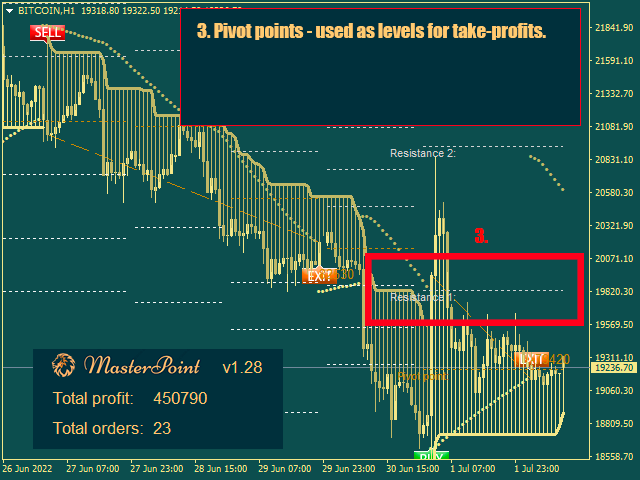
For exit points, it is recommended to use the pivots levels, or Parabolic Sar levels.
For example, if a buy is open, it is recommended to partially close the deal when the price touches the first resistance/support level. And then, either move the stop due to the trailing stop, or close the deal at the next resistance/support levels.
Parabolic Sar is recommended for complete closing of trades, as it signals a trend change.
Inputs:
- Minimum break (seconds) for alert - minimum pause between notifications.
- Notify type for a trend change- type of notification when the trend changes.
- Notify about a signal bar - type of notification when a signal bar appears.
- Notify about a currency strength cross - type of notification when currency strength lines cross.
- Sensitivity- sensitivity of the trend indicator.
- Show pivots levels- show pivot levels.
- Enable currency strength- enable the currency strength indicator.
- Currency strength prefix- prefix/suffix for currency pair names (if your broker uses them).
- Currency strength timeframe- timeframe for the currency strength indicator.
- Currency strength count bars- the maximum number of bars for the currency strength indicator lines.
- Visual theme- chart color scheme.


