• 概述
  • 评论
  • 评论

AIS Optimal TPSL

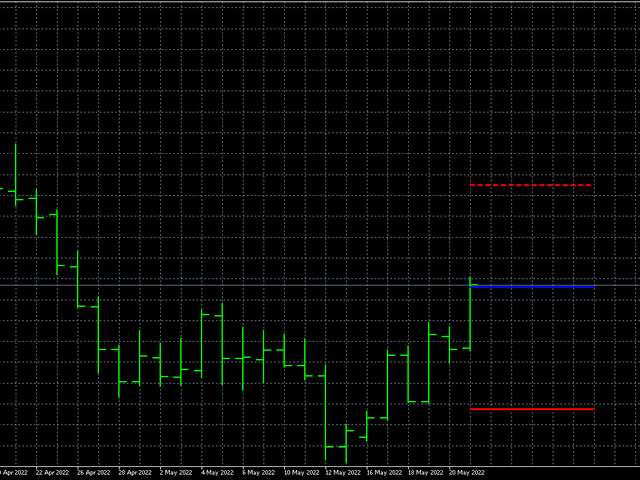
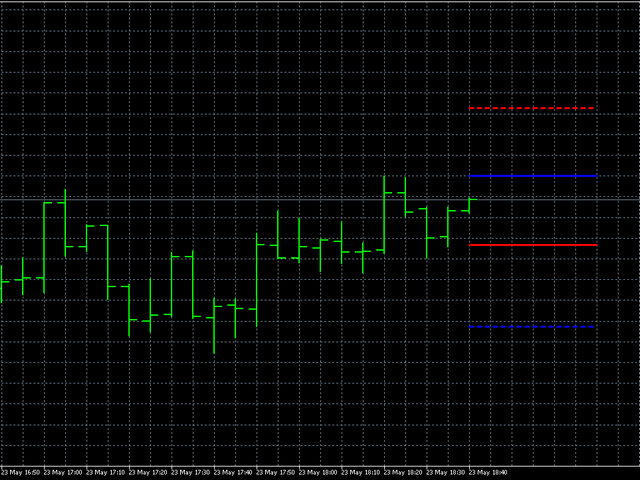
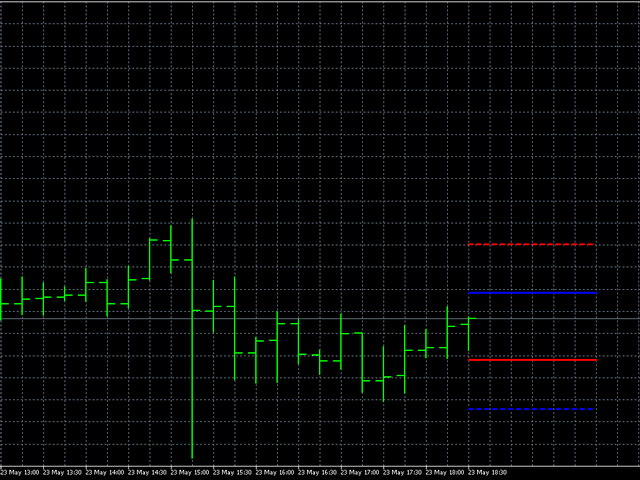
该指标显示最佳止盈和止损水平。这些水平是根据历史数据计算的。在第一次开始时,指标是根据历史训练的。之后,他评估价格在未来克服这个或那个水平的可能性,并选择最优化的选项来放置止损单。例如,选择止盈值以使利润最大并且价格达到其水平的概率尽可能高。止损水平应该是最小的,但达到它的可能性应该是最小的。这导致了具有最高可能获胜数学期望的级别。
此外,该指标可以以支撑位和阻力位的形式使用。为此,您可以组合不同的预测长度和偏移量。
指标参数:
  • 长度 - 预测长度。此参数表示未来柱线交易的预期持续时间。
  • Shift - 在小节中移动。由于此参数,您可以查看过去的指标读数。
  • 宽度 - 线宽。
  • ClrBuy - 买入头寸的线条颜色。
  • ClrSell - 卖出头寸的线条颜色。
  • StyleTP - 获利线样式。
  • StyleSL - 止损线样式。
  • 信息 - 启用此选项时,止损和止盈值将显示在终端的“专家”选项卡中。
推荐产品
Fractal with levels
Aleksandr Martynov
Indicator of fractals with adjustable indents. Designed according to an original simplified algorithm for use in EA. The main ones in the indicator are lines showing the levels of the current fractals, which allows you to read the values ​ ​ of the last fractal in one operation. It works on a closed bar, so it does not redraw and does not load the terminal with calculations. It should be understood that the indicator is late with the detection of the fractal by the number of bars on the righ
Galactic VSA
Jhon Martinez
Galactic Volume spread analysis (VSA), is an indicator designed for the visualization of the Volume, and the proportion in which it affects the volatility of the spread of the different pairs. The strategy consists of the following: Bull Trend: Always going in favor of the trend, open buying operations at the lows of the trend, provided that it coincides with a high volume shown by the Galactic VSA indicator. Downtrend: Always going in favor of the trend, open sales operations at the highs of
The Advanced Bands Squeeze indicator is a custom indicator based on the classic Bollinger Bands as created by John Bollinger. The Bollinger Band Squeeze occurs when volatility falls to low levels and the Bollinger Bands narrow. This low volatility level is called a “Squeeze”.  According to John Bollinger, periods of low volatility are often followed by periods of high volatility, where prices tend to move a lot in either direction. Therefore, a volatility contraction or narrowing of the bands
Mr Beast Paterns with alerts
Luis Mariano Vazquez Marcos
El indicador "MR BEAST PATTERNS WITH ALERTS" es una herramienta avanzada diseñada para identificar y notificar automáticamente patrones de oportunidad en el mercado financiero. Basándose en una combinación de análisis técnico y algoritmos inteligentes, este indicador escanea constantemente el gráfico en busca de patrones específicos que podrían indicar momentos propicios para la toma de decisiones. Características Principales: Detección de Patrones: El indicador identifica patrones de oportunida
SRP Pro
Farhad Kia
5 (1)
Strong Retracement Points Pro edition! SRP (Strong Retracement/Reversal Points) is a powerful and unique support and resistance indicator. It displays the closest important levels which we expect the price retracement/reversal! If all level are broken from one side, it recalculates and draws new support and resistance levels, so the levels might be valid for several days depending on the market! If you are still hesitating to start using this wonderful tool, you can check this link to see how ef
MyTraderEA
Khayelihle Tosh
AutoTraderEA Description As the name says, this is an autotrading robot.   It trades on H1 timeframe.  It looks for clear trades, and is very accurate, yet still will take a couple of trades per week. Otherwise losses are minimised through a 130 pip StopLoss which can be modified. AutoTrader gives the user the ability to choose whether to keep trading volumes the same or change in direct proportion to the change in the account equity.   The EA has been backtested only on the EURUSD pair over a
Market Structure Zig Zag
Lesedi Oliver Seilane
4.63 (27)
Free Market structure zig zag to assist in price action trading the screenshots describe how to use and how to spot patterns new version comes with alerts, email alert and  push notification alert can be used on all pairs  can be used on all timeframes  you can add additional confirmation indicators the indicator shows you your higher high and low highs as well as your lower lows and lower highs  the indication makes price action analysis easier to spot.
FREE
Visual Dragon State Indicator MT4
AL MOOSAWI ABDULLAH JAFFER BAQER
Dragon State Indicator   is a powerful trading tool designed to empower traders by giving them the foundation to optimize it further. This indicator is   not optimized , making it a perfect choice for traders who love to tweak and customize trading tools to suit their unique strategies.   The Logic Behind the Indicator The   Dragon State Indicator   identifies pivotal market movements using these components: Buy and Sell Signals :   Buy Signal : Clearly displayed with lime-green arrow
Chart Patterns Detect 15 patterns (Ascending Triangle, Descending Triangle, Rising Wedge, Falling Wedge, Bullish Flag, Bearish Flag, Bullish Rectangle, Bearish Rectangle Symmetrical triangle, Head and Shoulders, Inverted Head and Shoulders, Triple top, Triple Bottom, Double Top, Double Bottom) Use historical data to calculate the probability of each pattern to succeed (possibility to filter notification according to the chance of success) gives graphic indication about the invalidation level and
Signal Alien
Vitalii Zakharuk
Signal Alien is a handy tool if you are used to trading on a clean chart, but sometimes you need to take a look at this indicator. That is, everything is as simple as possible, positions are closed in the opposite way, that is, as soon as a signal is received to open an order in the direction opposite to your position. For example, you opened a long position (sell), close it when a red arrow appears pointing down. If you are not sure how to determine the inflection point of the trend and are c
Introduction to Chart Pattern MT Chart Pattern MT is a chart pattern scanner to detect the triangle pattern, falling wedge pattern, rising wedge pattern, channel pattern and so on. Chart Pattern MT uses highly sophisticated chart pattern detection algorithm. However, we have designed it in the easy to use with intuitive user interface. Chart Pattern MT will show all the patterns in your chart in the most efficient format for your trading. You do not have to do tedious manual pattern detection an
GMMA Trade X is an EA based on GMMA. GMMA parameters such as MovingAveragePeriod1-24, MovingAverageMAShift1-24, MovingAverageShift1-24 and CandlestickShift1-24 can be adjusted. GMMA Trade X applies BTN TECHNOLOGY's state-of-the-art intelligent technology to help you create optimal results for your trades. May your dreams come true through GMMA Trade X. Good luck. = == == Inquiries = == == E-Mail:support@btntechfx.com
Pipsurfer
Clinton Keenan Obinna Butler
Overview: With so much noise and distraction in the markets I wanted to create clarity for traders to have a simple, efficient, and fun trading experience. This is why I created Pipsurfer. Pipsurfer is an trend following indicator that visually shows you important Institutional Smart Money levels in the market and helps you to trace Market Structure in the markets. Most traders find it difficult to visually see trading elements such as trend, structure and momentum which are key for understandin
Nasdaq 1HPro
Premkumar Gunapati Munirathnam
Hi Friends the BOT for exactly for NASDAQ -1Hr ,30 Min & 15 Min and can try for other currencies by changing the multiplication factor 10. New  Position trading strategy Long term profit Minimal drawdown Reliable profit factor.  Orders Selection based on your equity Please run with optimization as  attached settings with your broker and choose the best parameter for live trading. However please find the recommended settings which you can run with demo account for testing for 30 Min & 1 hour char
The Extreme point indicator helps in determining the probable price reversal points on the chart. The indicator facilitates the search for points to enter the market with greater accuracy. The indicator displays certain impulses, after which there is a high probability of the price continuing its movement in the same direction. The indicator can be used in conjunction with other indicators for a more accurate detection of the position entry points. The indicator can also be used independently. F
Black series MT4
Dmitriy Kashevich
1 (1)
Black series MT4 - The indicator is designed for trading on binary options with Timeframe M1-M5-M15 Multicurrency (Works on cryptocurrency and currency pairs) The signal appears when the candle opens Up to 90% correct signals There is no signal redrawing at all Can be used with other indicators. Good for scalping! In Settings there is: -Indicator working methods -I Allert Arrow color Red signal down Blue signal up Also watch the video how the indicator works and signals appear or te
Dear traders, here is my other tool called the "Market Makers Trend Index".   The Market Makers Trend Index is created for the purpose of helping majority of traders to analyse the market direction in an easy way. This indicator is for serious traders who are eager to add edging tools to their trading arsenal. What are you waiting for just grab your copy today and amake a difference.  WHY THIS TOOL This indicator help traders analyse the trend direction and trading signals with precision and eff
PABT Pattern Indicator - it's classical system one of the signal patterns. Indicator logic - the Hi & Lo of the bar is fully within the range of the preceding bar, look to trade them as pullback in trend. In the way if indicator found PABT pattern it's drawing two lines and arrow what showing trend way.  - First line - it's entry point and drawing at: 1. On the high of signal bar or on middle of the signal bar (depending from indicator mode) for buy; 2. On the low of signal bar or on middle of t
This advisor enters the market at the opening of   London Market . It has a automatic function that give buy (arrow up green) and sell (arrow down red) signal when the indicator met high probabilities requirements.Once the signal is generated it is the trader discretions to start the order button and do trade manually. Stop loss are base on ATR. Recommended Take profit is 20pips.  The trading system is suitable for both experienced traders and beginners.  Timeframe is  M5 . Minimum account bal
Pip Titan
Maydilu Isidra Hart
PipTitan is a state-of-the-art Expert Advisor (EA) designed for MetaTrader 4, meticulously crafted to enhance your trading performance with precision and reliability. Harnessing the power of advanced technical analysis and automated trading strategies, PipTitan takes your trading to the next level with its robust features and unparalleled accuracy. Key Features: Automated Price Monitoring: Continuously monitors market prices to trigger subsequent trades at optimal levels. User-Friendly Customiz
Master XR
Mati Maello
This indicator Master XR indicator.Indicator displays trend movement. Indicator calculates automatically line. Features FiltPer - displays indicator period. deviation - displays indicator deviation. deviation2 - displays indicator deviation. How to understand the status: If (Timeframe M1-H1) FiltPer = 100; If ( Timeframe H4-MN) FiltPer = 5-20; ////////////////////////////////////////////////////////////////////////////////////////////////////////////////////////////////////////////////////// //
Owl smart levels
Sergey Ermolov
4.28 (36)
MT5版本  |  FAQ Owl Smart Levels Indicator   是一個完整的交易系統,包含   Bill Williams   的高級分形、構建正確的市場波浪結構的 Valable ZigZag 以及標記準確入場水平的斐波那契水平等流行的市場分析工具 進入市場和地方獲利。 策略的详细说明 指示灯使用说明 顾问-贸易猫头鹰助手助理 私人用户聊天 ->购买后写信给我,我会将您添加到私人聊天中,您可以在那里下载所有奖金 力量在於簡單! Owl Smart Levels   交易系統非常易於使用,因此適合專業人士和剛開始研究市場並為自己選擇交易策略的人。 策略和指標中沒有隱藏的秘密公式和計算方法,所有策略指標都是公開的。 Owl Smart Levels 允許您快速查看進入交易的信號,突出顯示下訂單的水平並向您發送有關已出現信號的通知。 優點很明顯: 清楚地顯示主要和更高時間框架的趨勢方向。 指示儀器信號的出現。 標記開單、止損設置和固定利潤的水平。 沒有多餘的,只有必要的結構! ZigZag   表示全球趨勢的方向,因此也表示貿易方向。 市場反轉點的短線清楚地表明在什
Forex Gump
Andrey Kozak
2.4 (5)
Forex Gump is a fully finished semi-automatic trading system. In the form of arrows, signals are displayed on the screen for opening and closing deals. All you need is to follow the instructions of the indicator. When the indicator shows a blue arrow, you need to open a buy order. When the indicator shows a red arrow, you need to open a sell order. Close orders when the indicator draws a yellow cross. In order to get the most effective result, we recommend using the timeframes H1, H4, D1. There
Indicator from the Real Non RePaint MultiTimeFrame   (Real NRP MTF)  series. The indicator is based on the standard one. Does not redraw in any mode: the last closed candle is a rock. Does not look into the future for history at the senior TF. The formula for sensitivity enhancement has been changed (disabled in settings). It works on the current TF or older ones with the display on the current one. The last closed Heiken Ashi candle of the current timeframe before the opening of the new senior
GANN Master
Ivan Stefanov
5 (1)
基于甘氏久经考验的方法,甘氏的精确目标呈现在您面前。该工具旨在使交易更加顺畅和直观。通过向上拖动白线或向下拖动绿线,您将立即明白为什么甘氏的技术在交易世界中仍然具有影响力。 甘氏策略围绕着高度准确地预测市场走势,而该工具将这种力量带到了您的指尖。无论您是经验丰富的交易员还是新手,操作这些线条将为您提供深入的见解,了解为什么他的方法经得起时间的考验。 基于甘氏久经考验的方法,甘氏的精确目标呈现在您面前。该工具旨在使交易更加顺畅和直观。通过向上拖动白线或向下拖动绿线,您将立即明白为什么甘氏的技术在交易世界中仍然具有影响力。 甘氏策略围绕着高度准确地预测市场走势,而该工具将这种力量带到了您的指尖。无论您是经验丰富的交易员还是新手,操作这些线条将为您提供深入的见解,了解为什么他的方法经得起时间的考验。
TradeLogic Pro – The Advanced MT4 EA for Long Term Investing TradeLogic Pro   is an advanced   MetaTrader 4 Expert Advisor (EA)   designed to harness the power of price imbalances in the forex trading markets. Whether you’re a beginner or a professional trader,   TradeLogic Pro   uses sophisticated market analysis to identify high-potential entry points, allowing you to trade smarter and more efficiently. How Does TradeLogic Pro Work? At the core of   TradeLogic Pro   is its ability to   detect
ATR Channel Multiframe
Dmitriy Susloparov
This is a fully multitimeframe version of the ATR Channel standard indicator, which works for any combination of timeframes. The indicator allows viewing price channels from different timeframes in one window, and they will always be displayed in a correct time scale. You can create and set of intervals and freely switch to a higher or lower one. Please note: in the " From Median Price " display mode, it is easy to identify reversal points at intersections of levels from higher timeframes by lev
Smart Moving Averages Indicator Smart Moving Averages is an exclusive indicator for Metatrader platform. Instead of calculating moving averages for the selected chart time frame, the Smart Moving Averages indicator gives you the opportunity to calculate moving averages independently from the chart time frame. For instance you can display a 200 days moving average in a H1 chart. Inputs of the indicator are: Timeframe : timeframe to be used for the calculation of the moving average Period : m
An Ultimate Tool  for quick and efficient market analysis. Unique combination of solid indicators defining market direction for trend tracking and filtration designed for you to stay on the  right  side of the market. Market Rider Tools   gives you access to one of the most used from professional trades indicators on worldwide, which were not build in for MT4 and MT5 terminals . These are unique non-repainting indicators designed to be used on all time frames for all instruments classes: Forex
Rebecca
Vitalii Zakharuk
The expert system Rebecca goes through the whole history and can work with a currency pair (USDCAD) with a single setting. The Expert Advisor can be launched on any hourly period, but it works with the H1 period. You can start using it with $ 100 and 0.01 lot. Recommended 1000 $. It is necessary to test the bot both on all ticks and in any other mode, the opening prices are also suitable. Rebecca bot, works using the Mockingbird indicator. Work only with the USDCAD currency pair, period H1. To
该产品的买家也购买
Dynamic Forex28 Navigator
Bernhard Schweigert
5 (4)
Dynamic Forex28 Navigator - 下一代外汇交易工具。 当前 49% 折扣。 Dynamic Forex28 Navigator 是我们长期流行的指标的演变,将三种功能合二为一: 高级货币强度 28 指标 (695 条评论)+ 高级货币 IMPULSE 带警报 (520 条评论)+ CS28 组合信号(奖励)。 有关指标的详细信息 https://www.mql5.com/en/blogs/post/758844 下一代强度指标提供什么? 您喜欢的原始指标的一切,现在通过新功能和更高的精度进行了增强。 主要特点: 专有货币强度公式。  所有时间范围内的平滑和准确的强度线。 非常适合识别趋势和精确进入。 动态市场斐波那契水平(市场斐波那契)。  此指标独有的独特功能。 斐波那契应用于货币强度,而不是价格图表。 适应实时市场活动以获得准确的反转区域。 实时市场动量。  第 9 行显示市场是活跃还是被动。 对于定时交易至关重要。 全面的警报和显示。  每种货币最强的买入和卖出动量。 ​​28 对的双重动量买入和卖出。 超买/超卖警告外部范围和止损。 反转
Scalper Inside PRO
Alexey Minkov
4.76 (63)
!SPECIAL SALE! An exclusive indicator that utilizes an innovative algorithm to swiftly and accurately determine the market trend. The indicator automatically calculates opening, closing, and profit levels, providing detailed trading statistics. With these features, you can choose the most appropriate trading instrument for the current market conditions. Additionally, you can easily integrate your own arrow indicators into Scalper Inside Pro to quickly evaluate their statistics and profitability
Smart Set up Levels
Mohit Dhariwal
5 (1)
Smart Set up leve l is a very powerful indicator based on the concept of order blocks and set up entries with proper fvg and breakouts to make a very nice level to enter like a pro trader. Very easy to use interface and friendly to enter on buy and sell signals. Works Best on M15 Time frame on Gold, Bitcoin and Fx pairs. Daily 4-5 trades on each pair  Works great on gold like a pro on M15 It is non repainting nor lagging It is very powerful indicator giving precise entries and prop acts can be c
MTF Supply Demand Zones
Georgios Kalomoiropoulos
4.83 (23)
下一代自动化供需区。适用于任何图表的创新算法。所有区域都是根据市场的价格行为动态创建的。 两种类型的警报 --> 1) 当价格触及区域时 2) 当新区域形成时 你不会再得到一个无用的指标。您将获得一个完整的交易策略和经过验证的结果。     新的功能:     价格触及供需区时发出警报     创建新的供应/需求区时发出警报     推送通知警报     以点为单位的区域宽度标签     关于 MTF 的又一个时间表。因此,现在您将能够看到高于当前 3 个时间帧,而不是高于当前 2 个时间帧     启用/禁用警报/区域/MTF 功能的按钮 您获得的优势:     消除交易中的情绪。     客观化您的交易条目。     通过高概率设置提高您的利润。     节省绘图区域的时间。     像专业人士一样交易金融市场。     任何市场的即时多时间框架分析。 你在图表上看到了什么?     蓝色和红色矩形是当前时间范围的供需区。     虚线样式线是当前上方第一个时间范围内的供需区域。     实线样式线是当前上方第二个时间范围内的
Beast Super Signal
Dustin Vlok
4.73 (89)
正在寻找可以帮助您轻松识别有利可图的交易机会的强大外汇交易指标? Beast Super Signal 就是您的不二之选。 这个易于使用的基于趋势的指标持续监控市场状况,寻找新的发展趋势或跳入现有趋势。当所有内部策略一致且彼此 100% 融合时,Beast Super Signal 会发出买入或卖出信号,无需额外确认。当您收到信号箭头警报时,只需买入或卖出。 购买后给我留言,让我加入我的私人 VIP 群组! (仅限购买完整产品)。 购买后给我发消息以获取最新的优化设置文件。 此处提供 MT5 版本。 在此处 获取 Beast Super Signal EA。 查看评论部分以查看最新结果! Beast Super Signal 根据您偏好的 1:1、1:2 或 1:3 风险回报率建议入场价、止损和获利水平,让您放心交易。这个 Beast Super Signal 是 100% 不可重新绘制的,这意味着它永远不会重新计算或重新绘制,每次都能为您提供可靠的信号。 Beast Super Signal 指标适用于所有时间范围,包括货币对、指数、商品和加密货币对。 Beast Su
介绍 ON Trade Waves Patterns Harmonic Elliot Wolfe,这是一款高级指标,旨在使用手动和自动方法检测各种市场模式。以下是它的工作原理: 谐波模式: 该指标可以识别出现在您图表上的谐波模式。这些模式对于练习谐波交易理论的交易者非常重要,正如Scott Carney的书《谐波交易第1卷和第2卷》所描述的那样。无论您是手动绘制它们还是依赖自动检测,ON Trade Waves Patterns都可以胜任。 控制面板: 我们配备了一个用户友好的控制面板,它会保存您的图表和时间帧设置,使您可以轻松切换不同配置。您甚至可以最小化它以最大化图表空间。如果您更喜欢使用其他分析工具,只需单击关闭按钮即可隐藏所有指标数据。 模板保存: 当您自定义设置或添加其他指标,如移动平均线或布林带时,该指标会自动保存您的模板。这意味着您可以随时轻松加载您喜欢的设置。 优化显示: 对于Windows 10用户,我们建议调整您的DPI设置以获得高清设备上的最佳屏幕体验。右键单击MetaTrader图标,选择“兼容性”,然后选择“更改高DPI设置”,将其设置为“系统(增强)”。
System Trend Pro
Aleksandr Makarov
5 (2)
System Trend Pro - This is the best trend trading indicator!!! You can get this indicator for free -  Quantum Entry PRO The indicator no repaint!!!  The indicator has   MTF   mode, which adds confidence to trading on the trend (   no repaint   ). How to trade? Everything is very simple, we wait for the first signal (big arrow), then wait for the second signal (small arrow) and enter the market in the direction of the arrow. (See screens 1 and 2.) Exit on the opposite signal or take 20-30 pips
MetaBands M4
Vahidreza Heidar Gholami
5 (3)
MetaBands使用强大且独特的算法绘制通道并检测趋势,以便为交易者提供进出交易的潜在点。它是一个通道指标和强大的趋势指标。它包括不同类型的通道,可以通过使用输入参数简单地合并以创建新通道。MetaBands使用所有类型的警报通知用户市场事件。 功能 支持大多数通道算法 强大的趋势检测算法 能够合并不同类型的通道 多时间帧和多货币(信号矩阵) 所有类型的警报功能(声音、屏幕闪烁、推送通知、电子邮件、弹出窗口、箭头) 它永远不会重绘 趋势检测 MetaBands使用在通道内振荡的蓝色线来检测趋势。当该线遇到通道的上界时,表明开始下跌趋势,当它遇到下界时,表明开始上涨趋势。如果蓝线接近中线,则市场处于整理期。 该指标使用独特的方法来检测趋势。一开始可能看起来有些复杂,但如果您观看视频教程,您就会意识到它是多么强大且易于使用。 入场和出场信号 当趋势变化或价格穿过上下通道时,MetaBands会立即通过不同的方法提醒交易者,这些方法可以在指标设置中启用。 信号矩阵 要监视来自不同时间框架的多个符号并在一个地方查看信号,请单击右上角按钮或按键盘上的M键以打开信号矩阵。该矩阵可以快速概览
Enigmera
Ivan Stefanov
5 (7)
ENIGMERA: 市场的核心 重要提示:MQL5.com 演示版本在策略测试器中运行,可能无法完全反映 Enigmera 的功能。请查看描述、截图和视频了解详细信息。如有任何问题,请随时联系我! 该指标的代码已完全重写。版本 3.0 增加了新功能并修复了自指标发布以来积累的错误。 简介 这个指标和交易系统是金融市场的一种独特方法。ENIGMERA 使用分形周期来精确计算支撑和阻力水平。它展示了真实的积累阶段,并提供了方向和目标。无论是在趋势中还是在修正中,这个系统都能工作。 它是如何工作的 指标的大部分功能通过图表左侧的按钮控制,使得能够快速响应不同的市场情况。 按钮 ON/OFF – 显示或隐藏整个指标。 Channel – 激活支撑通道,显示可接受的偏差范围。 Dev1 (第一偏差) – 指示价格在支撑偏差内的波动,信号表示市场正在整合或积累力量。 Dev2 (第二偏差) – 显示价格在偏差之间的波动,表示趋势形成和方向。 Dev3 (第三偏差) – 表示趋势的显著加速和高波动性。 45deg (45度) – 显示市场的节奏和相对于 45 度线的运动稳定性。 Tgt1/2
TPSproTREND PrO
Roman Podpora
4.68 (25)
TPSpro TREND PRO 是一个趋势指标,可以自动分析市场并提供有关趋势及其每次变化的信息,并给出进入交易的信号而无需重新绘制! 该指标使用每根蜡烛,分别对其进行分析。指不同的脉冲——向上或向下脉冲。货币、加密货币、金属、股票、指数交易的准确切入点! MT5版本                 指标的完整描述   我们建议将其与 指示器 -   RFI LEVELS 一起使用 主要功能: 准确的输入信号,无需渲染! 如果出现信号,它仍然相关!这是与重提指标的一个重要区别,重提指标可以提供信号然后改变信号,这可能导致存款资金的损失。现在您可以以更高的概率和准确度进入市场。还有一个功能是在箭头出现后为蜡烛着色,直到达到目标(止盈)或出现反转信号。 显示止损/获利区域 为了提高搜索切入点时的视觉清晰度,创建了一个模块,该模块最初显示买入/卖出区域,在该区域中搜索进入市场的最佳点。用于处理止损水平的附加智能逻辑有助于随着时间的推移减小其大小,从而降低进入交易(移动 sl)时的初始风险。 显示较高时间范围内的最小值/最大值(MTF 模式) 添加了一项功能,可以显示较高时间间隔的最小/最
IQ FX Gann Levels
INTRAQUOTES
5 (1)
CONTACT US  after purchase to get the Indicator Manual. Try Now—Limited 50% Discount for First 10 Buyers! Download the  Metatrader 5 Version Read the product description carefully before purchasing the product.  Due to regulatory restrictions, our service is unavailable in certain countries such as India, Pakistan, and Bangladesh. William Delbert Gann (W.D. Gann) was an exceptional market analyst, whose trading technique was based on a complex blend of mathematics, geometry, astrology, and anc
目前八折优惠! 对任何新手或专家交易者来说都是最好的解决方案! 这个仪表板软件适用于28种货币对。它基于我们的两个主要指标(高级货币强度28和高级货币冲动)。它对整个外汇市场提供了一个伟大的概述。它显示高级货币强度值,货币运动速度和28个外汇对在所有(9)时间段的信号。想象一下,当你可以使用图表上的单一指标观察整个市场,以确定趋势和或剥头皮的机会时,你的交易将得到改善 我们已经在这个指标中建立了一些功能,使你更容易识别强势和弱势货币,同时识别和确认潜在的交易。该指标以图形方式显示货币的强势或弱势是增加还是减少,以及它在所有时间段的表现。 增加的新功能是动态市场斐波那契水平,它适应当前的市场条件变化,这是一个已经在我们的高级货币强度28和高级货币冲动指标中使用的成熟的加分项。 在交易时,总是将弱势货币和强势货币配对,这个新指标将帮助你做到这一点。 用户手册:点击这里  https://www.mql5.com/en/blogs/post/708783 特点  显示每个时间段的ACS28和GAP-speed(冲动)的货币强度值。 列:颜色代码以7种颜色显示货币强度:强势
Blahtech Supply Demand
Blahtech Limited
4.64 (36)
Was: $299  Now: $149   Supply Demand uses previous price action to identify potential imbalances between buyers and sellers. The key is to identify the better odds zones, not just the untouched ones. Blahtech Supply Demand indicator delivers functionality previously unavailable on any trading platform. This 4-in-1 indicator not only highlights the higher probability zones using a multi-criteria strength engine, but also combines it with multi-timeframe trend analysis, previously confirmed swings
TPSpro RFI Levels
Roman Podpora
4.85 (26)
指示       俄罗斯 -        英语   建议 与指示器一起使用     -       TPSpro 趋势专业版 -   MT4版本       交易中的一个关键要素是做出买卖交易工具决定的区域或水平。尽管主要参与者试图隐藏他们在市场中的存在,但他们不可避免地会留下痕迹。我们的任务是学习如何识别这些痕迹并正确解释它们。 主要功能: 向卖家和买家显示活跃区域! 该指标显示所有正确的初始买入和卖出脉冲水平/区域。激活这些水平/区域后,开始寻找切入点,水平会改变颜色并填充特定阴影。此外,还会显示箭头,以便更直观地了解情况。 显示更高时间范围内的级别/区域(MTF 模式) 添加了使用更高时间间隔显示级别/区域的功能。此外,该指标还具有自动趋势检测功能(   TPSproTREND PRO   )。 用于交易的单独专业的逐步算法。 该算法专为日内交易而设计,既可顺势交易,也可逆势交易。每个活动模板均提供详细说明。 适用于多种时间范围 。 TPSpro RFI 水平指标可用于图表上的任何时间范围,从一分钟(M1)开始一直到每月(MN)。 图形和声音警报。 该指标提供图形和声音指示,
Cycle Sniper
Elmira Memish
4.39 (36)
NEW YEAR SALE PRICE FOR LIMITED TIME!!! Please contact us after your purchase and we will send you the complimentary indicators to complete the system Cycle Sniper is not a holy grail but when you use it in a system which is explained in the videos, you will feel the difference. If you are not willing to focus on the charts designed with Cycle Sniper and other free tools we provide, we recommend not buying this indicator. We recommend watching the videos about the indiactor and system before pu
Quantum Entry PRO
Aleksandr Makarov
Bonus: when you buy or rent the indicator, you get Gold Pro Scalper   and  System Trend Pro absolutely free.(Write in a private message or in telegram in the profile to receive a bonus) Quantum Entry is a powerful price action trading system built on one of the most popular and widely known strategies among traders: the Breakout Strategy! This indicator produces crystal clear buy and sell signals based on breakouts of key support and resistance zones. Unlike typical breakout indicators, it use
Currency Strength Exotics
Bernhard Schweigert
4.87 (31)
目前8折优惠! 对任何新手或专家交易者来说都是最好的解决方案! 这个指标是专门用来显示任何符号的货币强度,如异国货币对、商品、指数或期货。它是同类产品中的第一个,任何符号都可以添加到第9行,以显示黄金、白银、石油、DAX、US30、MXN、TRY、CNH等的真实货币强度。这是一个独特的、高质量的、负担得起的交易工具,因为我们已经纳入了一些专有的功能和一个新的公式。想象一下,你的交易将如何改善,因为你能够准确地确定新趋势或剥头皮机会的触发点? 用户手册:点击这里   https://www.mql5.com/en/blogs/post/708876 它适用于所有时间框架。你将很快能够看到TREND! 根据新的基础算法设计,它使识别和确认潜在交易变得更加容易。这是因为它以图形方式显示了8种主要货币和一种符号的强弱。 该指标显示了8种主要货币(澳元加元瑞士法郎欧元英镑日元新西兰美元)的强弱线,再加上一个符号! 该指标显示了符号的真实价值。例如:对于XAUUSD(黄金):价格以美元报价。如果黄金在上涨,你怎么能知道是黄金的强势还是美元的弱势?只有当黄金走强时,我们才会进行交易。该指
Supply and Demand Dashboard PRO
Bernhard Schweigert
4.8 (20)
目前八折优惠! 这个仪表板是一个非常强大的软件,可用于多个符号和多达9个时间段。 它是基于我们的主要指标(最佳评论:高级供应需求)。 Advanced Supply Demand 该仪表板提供了一个伟大的概述。它显示。   筛选后的供需值,包括区域强度评级。 区间内和区间外的点位距离。 它突出了嵌套的区域。 在所有(9个)时间段内,它对所选符号发出4种警报。 它是高度可配置的,以满足您的个人需求! 您的利益! 对每个交易者来说,最重要的问题是。 什么是入市的最佳水平? 在强大的供应/需求区域内或附近进入你的交易,以获得最佳的成功机会和风险/回报。 我的止损的最佳位置是哪里? 把你的止损放在强势供应/需求区的下方/上方是最安全的。 我的最佳盈利目标是什么? 你的退出策略和你的进入策略一样重要,了解更高的时间框架图可以帮助你。对于买入,使用下一个供应区作为目标,对于卖出,使用下一个需求区作为目标。在回撤到供应区或需求区时进场,以确保有足够的利润空间,达到更高的时间框架的供应和需求,将增加你的利润。 为什么我们要过滤强区和弱区? 不平衡性越大,价格的变动就
No Repaint Bext 是一个完整的交易系统。它指示何时开仓、何时平仓以及交易方向。每当出现绿色箭头时,您需要开设买入交易。当出现红色箭头时,关闭所有买入交易。相反,每当出现红色箭头时,开设卖出交易,并在出现绿色箭头时关闭所有卖出交易。交易时使用 M5 时间框架,可以在任何货币对上进行交易。 该指标不会重绘,几乎没有延迟,唯一的自然条件是等待 K 线收盘。它使用 RSI 过滤器和两个经典的反转形态(吞没、Pin Bar),这使得几乎可以在反转发生的瞬间识别出来。 如何使用该指标进行高效交易? 可用于任何货币对(我们测试了 GBPUSD 和 EURUSD) 时间框架:M5 初始资金:500 美元起 交易手数:0.01 每当出现绿色箭头时,开设买入交易。当出现红色箭头时,关闭所有买入交易。 每当出现红色箭头时,开设卖出交易。当出现绿色箭头时,关闭所有卖出交易。 指标参数设置: RSI_Period - 默认值:14 说明:RSI(相对强弱指数)用于过滤信号。例如,当 RSI_Period 设为 14 时,RSI 计算过去 14 根 K 线的平均值。周期越长,RSI 趋势越平滑(减少
GOLD Impulse with Alert
Bernhard Schweigert
4.6 (10)
这个指标是我们2个产品 Advanced Currency IMPULSE with ALERT  +   Currency Strength Exotics 的一个超级组合。 它适用于所有时间框架,并以图形方式显示8种主要货币和一种符号的强势或弱势冲动! 该指标专门用于显示任何符号的货币强度加速,如黄金、异国货币对、商品、指数或期货。这是它的第一个指标,任何符号都可以被添加到第9行,以显示黄金、白银、石油、DAX、US30、MXN、TRY、CNH等的真实货币强度加速(冲动或速度)。 建立在新的基础算法上,它使识别和确认潜在的交易更加容易。这是因为它以图形方式显示了一种货币的强势或弱势是否正在加速,并测量了这种加速的速度--把它想象成你汽车中的速度表。当你加速时,事情显然会发生得更快,这在外汇市场上也是一样的,即如果你配对的货币正在向相反的方向加速,你就会发现一个潜在的有利可图的交易。 动态市场斐波那契28水平被用作警报触发器,将适应市场活动。如果冲动击中黄色触发线,你将收到警报。然后你就知道作为一个交易员应该做什么。货币对和方向已经给出。只需点击警报按钮,就可以切换到该货
Gold Channel XAUUSD
Paulo Rocha
5 (4)
Gold Channel is a volatility-based indicator, developed with a specific timing algorithm for the XAUUSD pair, which consists of finding possible corrections in the market. This indicator shows two outer lines, an inner line (retracement line) and an arrow sign, where the theory of the channel is to help identify overbought and oversold conditions in the market. The market price will generally fall between the boundaries of the channel. If prices touch or move outside the channel it is a tradi
Bomb Bank Signal
Igor Pereira Calil
5 (1)
炸彈銀行訊號:您對 MetaTrader 4 的信心指標 Bomb Bank Signal 是 MetaTrader 4 的一個強大指標,旨在識別金融市場中最相關的趨勢。如果您正在尋找一種能夠準確預測運動的工具,那麼炸彈庫就是您需要的盟友。 運作原理: 該指標結合了三種不同的方法——成交量分析、蠟燭收盤價和對稱趨勢——來偵測和發出買賣機會訊號。當炸彈銀行識別出買入機會時,它就像一顆「炸彈」;當它偵測到賣出訊號時,它就像一個「頭骨」。 為什麼炸彈銀行不一樣? 完全可靠性:炸彈庫訊號不會刪除訊號。訊號一旦發出,就會一直存在,確保您不會錯過任何機會。 極為準確:炸彈庫不會發出錯誤訊號。它會即時更新您的訊息,隨著市場的變化進行調整,但保持先前訊號的透明度。 即時更新:訊號被即時識別並在必要時更新,使您能夠快速響應市場變化。 最大化您的結果: 炸彈銀行訊號是識別趨勢持續走勢的理想選擇。例如,如果您已經做空並且指標在 M15 發出買入訊號,那麼現在就是平倉或部分下單的最佳時機,反之亦然。 此外,經過仔細分析,我們建議您遵循M30、H1和H4上的訊號,停損僅50點。這使得價格朝著有利
PRO Fibonacci Tool MT4
Samil Bozuyuk
5 (1)
The indicator is the advanced form of the MetaTrader 4 standard Fibonacci tool. It is unique and very reasonable for serious Fibonacci traders. Key Features Drawing of Fibonacci retracement and expansion levels in a few seconds by using hotkeys. Auto adjusting of retracement levels once the market makes new highs/lows. Ability to edit/remove any retracement & expansion levels on chart. Auto snap to exact high and low of bars while plotting on chart. Getting very clear charts even though many ret
TrendMaestro
Stefano Frisetti
5 (3)
note: this indicator is for METATRADER4, if you want the version for METATRADER5 this is the link:  https://www.mql5.com/it/market/product/108106 TRENDMAESTRO ver 2.4 TRENDMAESTRO recognizes a new TREND in the bud, he never makes mistakes. The certainty of identifying a new TREND is priceless. DESCRIPTION TRENDMAESTRO identifies a new TREND in the bud, this indicator examines the volatility, volumes and momentum to identify the moment in which there is an explosion of one or more of these data a
PTS Divergence Sell Finder V2
PrecisionTradingSystems
PTS Divergence Finder Sell Indicator(Roger Medcalf出品) - Precision Trading Systems。 该指标只提供看跌 - 卖出信号。 首先,我多次被问及为什么多年来一直提供买入信号的差异指标,而没有提供卖出差异指标。 我回答说,卖出差异信号不如买入差异信号可靠,这仍然是事实。 我们找到了一些解决办法,不是屈服于同行的压力,也不是修改我在十五年前制作的这个指标,而是通过更改默认设置来使其更加严格。 PTS差异查找器卖出指标是如何工作的? PTS差异查找器卖出指标准确测量了发生在需求指数中的差异数量,这是一个基于成交量的指标。由于MT4提供的是交易量而不是成交量,因此基础需求指数指标中发生的波动大约要小10倍,因此必须减小下面所述的差异输入。 这是一个子图二的柱状图样式指标,它绘制出看起来像是从底部升起的石笋一样的尖峰。 该指标检查了您指定的长度的基于成交量的需求指数指标的多个回溯期。它找到了价格中的高点,其中DI没有形成新的“局部”高点,并且与您输入的“差异”设置相差较远。 在众多人投票市场方向的流动市场中,效果最好。 每
PTS Divergence Buy Finder
PrecisionTradingSystems
PTS - Divergence Buy Finder 由Precision Trading Systems制作 Precision Divergence Finder旨在精确找到市场底部,并经常成功。在技术分析中,挑选底部通常比挑选顶部容易得多,这个工具正是为了完成这个任务而设计的。在识别出牛市背离后,等待趋势上升再购买是明智的。您可以使用10或20个周期的最高点进场,或者使用15-30周期的移动平均线上升来识别趋势变化。 这个复杂的算法会实时逐根柱状图寻找并计算活跃的需求指数背离的数量。 该模型观察市场价格何时创出新低,而需求指数未创新低,从而产生背离。 该指标使用两个设置。     • 需求指数(DI)长度,它将为指标提供寻找的对象,并将为您选择的长度上的任何DI背离进行查找。     • 差异,这是[DI值现在]与[DI值长达200个周期以前]之间的背离量,对于它从各种回望期间找到的每个背离,它将在指标窗口中生成[1]输出。 最多检查20个周期,最大输出值将显示为20。 建议的设置 需求指数长度从15到100都可以使用,但最佳范围在20到60之间。 背离的差异为0.1至20
Clever Order Blocks
Carlos Forero
5 (2)
Description Very precise patterns to detect: entry signals as well as breakout, support and resistance reversal patterns. It points out zones in which, with a high probability, institutional orders with the potential to change the price’s direction and keep moving towards it, have been placed.  KEY LINKS:   Indicator Manual  –  How to Install   –  Frequent Questions  -  All Products  How is this indicator useful? It will allow you to trade on the order’s direction, once its direction has been id
Best Currency Strength Indicator
Tumelo Patrick Rakotsoane
4.5 (46)
Advanced Currency Strength Indicator The Advanced Divergence Currency Strength Indicator. Not only it breaks down all 28 forex currency pairs and calculates the strength of individual currencies across all timeframes , but, You'll be analyzing the WHOLE forex market in 1 window (In just 1 minute) . This indicator is very powerful because it reveals the true movements of the market.  It is highly recommended to  analyze charts knowing the performance of individual currencies or the countries eco
Quantum Trend Sniper Indicator MT4
Bogdan Ion Puscasu
4.68 (40)
介绍   量子趋势狙击指标 ,突破性的 MQL5 指标,正在改变您识别和交易趋势反转的方式!由拥有超过13年交易经验的资深交易员团队开发,     量子趋势狙击指标   旨在通过其创新的方式以极高的准确度识别趋势反转,将您的交易之旅推向新的高度。 ***购买量子趋势狙击指标,即可免费获得量子突破指标!*** 当量子突破指标识别出趋势反转时,它会向您发出警报和信号箭头,并建议您三个止盈水平。 它既适合新手交易者,也适合专业交易者。 量子 EA 通道:       点击这里 MT5版本:       点击这里 建议: 时间范围:  所有时间范围。为了获得最佳结果,我们建议在 M15、M30 和 H1 时间范围内使用它。 货币对:欧元兑美元、英镑兑美元、澳元兑美元、欧元兑英镑, EURAUD, XAUUSD 账户类型:ECN、Raw 或 Razor,点差极低 经纪时间:任意 经纪商:IC Markets、Pepperstone with Raw 和 Razor 的点差最低 建议止损:50 点 建议止盈水平:20 点、50 点和 100 点 规格: 不重漆! 最多
Cyclic Impulse
Vitalyi Belyh
构建图表并识别周期性价格变动的技术指标。 可以在任何图表上工作。 几种类型的通知。 图表本身还有额外的箭头。 无需重新绘制历史记录,只需关闭蜡烛即可。 建议使用 M5 及以上的 TF。 易于使用和配置参数。 当使用 2 个具有不同参数的指标时,您可以单独使用它们,而无需其他指标。 有 2 个输入参数 周期性和信号持续时间 这两个参数处理图表结构的处理。 Cyclicity 调节反转周期的变化频率,平滑周期。 Signal duration 为最小数字,检测价格变动中的脉冲,最大长期趋势变动。    ---------------------------------------------------------------------------------------
作者的更多信息
该脚本基于使用随机数生成器模拟贸易交易。即使使用相同的输入参数,这也可以使您获得完全不同的结果。运行脚本时,将打开一个对话框,您可以在其中设置外部变量的所需值。 在块中,TradingOptions定义了模拟交易所需的基本参数。 StartBalance  - 设置交易余额的初始大小。 NumberTrade  - 设置脚本运行时将建模的交易事务数。为了获得或多或少的显着结果,该参数必须大于30。 ProbabilityWinning  - 获胜交易的概率。表示为百分比,有效值为1到99。 Min.StopLoss  - 表示以点为单位的最小StopLoss值,将在建模交易操作时使用。 Max.StopLoss  - 以磅为单位设置StopLoss的最大值。 PositiveWin。 - 该变量建立修正,借助于该修正在模拟交易中获得积极的期望。 脚本的工作是执行以下操作。首先,计算获胜交易的预期概率 -  PW。之后,随机设置StopLoss的值,该值将在此事务中使用。考虑到预期收益应为正数,计算TakeProfit规模。考虑到点值,TakeProfit和StopLoss水平将转换为
FREE
选择StopLoss和TakeProfit的水平会对交易的整体表现产生非常强烈的影响。除了交易交易的明显参数 - 可能获胜或可能亏损的大小 - 止损和止盈的水平也会影响交易的预期持续时间以及一般交易的盈利能力。 如果您已使用“ AIS-ODT ”脚本确定了最佳事务持续时间,则可以开始确定与StopLoss和TakeProfit级别关联的参数。 为此,我们按以下步骤操作。首先,我们将确定在一个方向或另一个方向上的所有可能的价格偏差,并计算在一定时间内实现它们的概率。之后,您可以根据其大小,概率和预期利润值计算StopLoss和TakeProfit的最佳水平。 为此,请在感兴趣的货币对的图表和所需的时间范围内运行脚本。使用属性窗口中的ILB参数,设置交易仓位的期望持续时间,以柱数表示。在实用程序的工作期间,分析整个历史记录的数据,并选择最佳值。在脚本结束时,形成了两个文件 - “Buy.csv”和“Sell.csv”,其中包含获得结果的表 - 图1。 在表格的第一列中,指示了可能的TakeProfit大小,在第二列中,指示了最佳的StopLoss大小。第三列显示以百分比表示获胜这些参数的概
FREE
MinDeposit MT5
Aleksej Poljakov
3 (1)
The script analyzes the history of quotes and gives recommendations on the minimum deposit. The calculations take into account the variability of prices and the standard deviation. Margin requirements for the instrument are also taken into account. The result of the script is the minimum recommended deposit for trading the given currency pair.
FREE
The script allows selecting the required 'Filter level' value of the AIS-MTF indicator. Run the script on the required chart and selected timeframe. Once its operation is complete, the HPS.csv file will be created in the Files folder. Open the file. You will see three columns. The 'Filter lvl' column represents the value of the 'Filter level' for the AIS-MTF indicator. Am. dev. - degree and direction of the indicator's deviation from the price level (sorted in ascending order). Negative values i
FREE
该脚本的设计使交易者可以确定交易交易的平均持续时间,在此期间可能的利润和损失的比率将是最佳的。 首先,让我们看一下确定贸易交易最佳持续时间的一般方法。我们介绍以下变量: R  - 交易的结果; T  - 交易开放的时间; W  - 上一笔交易结束与下一交易开盘之间的时间。 每个交易者都努力在最短的时间内获得最大的利润。这种愿望可以通过以下简单表达来描述: R/(T+W)→max 。 很明显,变量  T  和  W  取决于交易的总持续时间和交易数量。设  ATD  是交易的平均持续时间, N  是交易总数。然后,交易的平均持续时间应与其总数的平方根成比例增长,即: ATD~√N 。 但是,有一些有根据的问题出现 - 任何交易持续时间等同于其他交易持续时间,交易持续时间如何影响交易操作的结果?为了得到所提问题的答案,我们将对历史数据的价格行为进行一项小型研究。 我们继续如下。我们将历史数据划分为由一定数量的柱组成的系列,对应于交易的平均持续时间。在每个这样的系列中,我们计算最大价格变动,我们将引用更大的偏差  StopLoss ,并且更小 - 到 TakeProfit 。 之后,我们将计
FREE
该脚本的设计使交易者可以确定交易交易的平均持续时间,在此期间可能的利润和损失的比率将是最佳的。 首先,让我们看一下确定贸易交易最佳持续时间的一般方法。我们介绍以下变量: R - 交易的结果; T - 交易开放的时间; W - 上一笔交易结束与下一交易开盘之间的时间。 每个交易者都努力在最短的时间内获得最大的利润。这种愿望可以通过以下简单表达来描述: R/(T+W)→max 。 很明显,变量 T 和 W 取决于交易的总持续时间和交易数量。设 ATD 是交易的平均持续时间, N 是交易总数。然后,交易的平均持续时间应与其总数的平方根成比例增长,即: ATD~√N 。 但是,有一些有根据的问题出现 - 任何交易持续时间等同于其他交易持续时间,交易持续时间如何影响交易操作的结果?为了得到所提问题的答案,我们将对历史数据的价格行为进行一项小型研究。 我们继续如下。我们将历史数据划分为由一定数量的柱组成的系列,对应于交易的平均持续时间。在每个这样的系列中,我们计算最大价格变动,我们将引用更大的偏差 StopLoss ,并且更小 - 到 TakeProfit 。 之后,我们将计算整个历史中价格范围的
FREE
This script allows selecting the TakeProfit and StopLoss levels. It analyzes the history data, and then calculates the probability of reaching a given price level. How the script works Suppose you have a trading strategy and you want to select the TakeProfit and StopLoss levels. Run the script and set the parameter: Number of Bars - the average position holding time in bars. Once the script operation is complete, the AIS-PPL.csv file will be created in the Files folder in the terminal data cata
FREE
MinDeposit
Aleksej Poljakov
5 (1)
The script analyzes the history of quotes and gives recommendations on the minimum deposit. The calculations take into account the variability of prices and the standard deviation. Margin requirements for the instrument are also taken into account. The result of the script is the minimum recommended deposit for trading the given currency pair.
FREE
AIS 正确平均线指标允许您设置市场趋势运动的开始。该指标的另一个重要品质是趋势结束的明确信号。指标不会重新绘制或重新计算。 显示值 h_AE - AE 通道的上限 l_AE - AE通道的下限 h_EC - 当前柱的高预测值 l_EC - 当前柱的低预测值 使用指标时的信号 主要信号是通道AE和EC的交点。 当 l_EC 线高于 h_AE 线时,可能会开始上升趋势。 在 h_EC 线低于 l_AE 线之后,可以预期下降趋势的开始。 在这种情况下,应注意 h_AE 和 l_AE 线之间的通道宽度。它们之间的差异越大,趋势就越强。您还应该注意 AE 通道实现的局部高点/低点。这时,价格变化的趋势变得最强。 可定制的指标参数 设置指标包括根据时间范围选择 LRH 参数。此参数的有效值范围为 1 到 350。 此参数越小,指标越敏感,错误信号的增加可能。另一方面,此参数不应设置得太高,因为指标会变得不那么敏感并会跳过信号。
AIS Weighted_Moving_Average 指标计算加权移动平均线,并允许您确定趋势市场运动的开始。 权重系数的计算考虑了每个柱的具体特征。这使您可以过滤掉随机的市场走势。 确认趋势开始的主要信号是指标线方向的变化和穿过指标线的价格。 WH(蓝线)是高价的加权平均值。 WL(红线)是最低价的加权平均值。 WS(绿线)是所有价格点的加权平均值。 选项 LH - 计算值的柱数。 要快速选择 LH,您首先需要检查是较高时间范围的倍数的值。 例如,指标设置为 M15。 然后我们检查以下LH的值 周期 M30/M15 = 2 期间 H1/M15 = 4 期间 H4/M15 = 16 周期 D1/M15 = 96 周期 W1/M15 = 480 它们之间的值也可能是有趣的。
AIS Advanced Grade Feasibility 指标旨在预测未来价格可能达到的水平。他的工作是分析最后三个柱形图并在此基础上进行预测。该指标可用于任何时间范围和任何货币对。在设置的帮助下,您可以达到预期的预测质量。 预测深度 - 以条形图设置所需的预测深度。建议在 18-31 内选择此参数。 你可以超越这些限制。但在这种情况下,预测水平的“固定”是可能的(对于小于 18 的值),或者水平宽度过大(对于大于 31 的值)。 置信水平 1、置信水平 2 和置信水平 3 - 预测置信水平。可在 1-99 范围内设置。置信度 1 应该大于置信度 2,置信度 3 应该是最小的。 这些水平中的每一个都显示价格将达到此值的概率百分比,该值由预测深度参数确定的柱线数量决定。 Color lvl high 和 Color lvl low - 允许您选择线条的颜色 Style lvl - 允许您选择与级别对应的线条样式 宽度 lvl - 设置与级别对应的线的宽度
The indicator is designed to measure the price volatility. This allows determining the moments for opening or closing trade positions more accurately. High intensity of the market indicates the instability of its movement, but allows for better results. And, conversely, low intensity of the market indicates the stability of its movement. Parameters Bars to process - the number of bars to measure the price movements. A low value of this parameter allows determining the moments of rapid price mov
This indicator uses the Fibonacci p-numbers to smooth a price series. This allows combining the advantages of the simple and exponential moving averages. The smoothing coefficients depend on the level of the p-number, which is set in the indicator parameters. The higher the level, the greater the influence of the simple moving average and the less significant the exponential moving average. Parameters Fibonacci Numbers Order - order of the Fibonacci p-number, specified by trader. Valid values a
The indicator is based on the analysis of interaction of two filters. The first filter is the popular Moving Average. It helps to identify linear price movements and to smooth minor price fluctuations. The second filter is the Sliding Median. It is a non-linear filter. It allows to filter out noise and single spikes in the price movement. A predictive filter implemented in this indicator is based on the difference between these filters. The indicator is trained during operation and is therefore
This indicator studies the price action as a combination of micro-trends. All micro-trends are analyzed and averaged. Price movement is filtered based on this averaging. IP_High and IP_Low (blue and red dashed lines) show the instantaneous price movement. They display the forecast only for the current price values, taking into account only the number of bars defined by the 'Filter level' parameter. SP_High and SP_Low (blue and red solid lines) smooth the price movements with respect to history.
This indicator implements the process of simple linear smoothing. One of the disadvantages of exponential smoothing is the rapid attenuation of the signal. This does not allow for a full-fledged monitoring of long-term tendency of a price series. Linear smoothing allows fine-tuning the signal filtering. The indicator is configured by selecting the parameters: LP - period of smoothing. The higher the value, the more long-term tendencies are displayed by the indicator. Valid values are from 0 to 2
This script allows selecting the TakeProfit and StopLoss levels. It analyzes the history data, and then calculates the probability of reaching a given price level. How the script works Suppose you have a trading strategy and you want to select the TakeProfit and StopLoss levels. Run the script and set the parameter: Number of Bars - the average position holding time in bars. Once the script operation is complete, the AIS-PPL.csv file will be created in the Files folder in the terminal data cata
FREE
该指标是基于中值和移动平均特性的组合的顺序混合滤波器。 使用中值允许滤除价格序列值中的异常异常值和随机脉冲。同时,中值滤波器不会对价格变动的趋势起作用,而是保持不变。 由于中值滤波器是非线性的,因此使用简单移动平均值进行平均来平滑其值。这种方法使我们不仅可以更准确地识别趋势,还可以更准确地识别价格变动中的周期性成分。此外,它还增加了指标对价格变化的敏感度,并减少了价格序列与指标读数之间的延迟。因此,指标可以相当准确地警告新趋势的开始,以及旧趋势的结束。 您可以使用 FL 参数调整滤波器的深度及其灵敏度。其允许值为0到63.同时, 2 * FL + 1 条用于计算指标值。因此,FL值越大,指标显示价格图表的趋势越强。
该指标是两个改进的Lanczos滤波器的组合。 第一个过滤器用于推断价格。根据过去的价值,他预测当前柱内可能的价格变动。也就是说,它表明如果过去的趋势保持不变,价格会是多少。 第二个过滤器,用于平滑和平均窗口内的价格,由过滤器的级别决定。由于选择了权重,此过滤器最积极地响应价格变动中存在的周期性组件。 可以使用EF和IF参数调整指标。通过选择 EF 和 IF 的值,您可以获得有关趋势价格变动开始的信号。 EF   - 指数滤波器的窗口大小。有效值为 EF = 0 ... 255 。并且在计算期间处理的条数是 2 * EF + 1 。该参数越大,价格序列的过去价值的影响越大。结果以实线绘制。 IF   - 调整平均窗口的大小。 IF = 0 ... 255 的值。要计算的条数是 2 * IF + 1 。 IF 值越大,使用此过滤器检测到价格变动的较长时段。结果以虚线显示在图表上。
让我们看一下外汇市场价格变化的本质,而不是关注这些变化发生的原因。这种方法将使我们能够确定影响价格变动的主要因素。 例如,让我们看一下欧元兑美元货币对和H1时间框架的开盘价。对于这些价格,我们构建了Lameray图(图1)。 在该图中,可以看出价格变动基本上根据线性方程发生。要确定此等式的参数,可以使用最小二乘法。在这个特定的例子中,改变开盘价的等式采用以下形式: Open [i] = 0.99989 * Open [i + 1] +0.00013。 让我们来看看这个等式如何充分描述价格变动。为此,我们删除线性分量并分析残差(图2)。 从图中可以清楚地看出,这些残留物相当混乱,如果我们将它们视为噪声,我们可以得到一个相当简单的系统来预测下一个柱的开盘价,这是以该指标的形式实现的。
该指标更具信息量。他的工作基于这样的假设,即市场中的价格变动可以表示为特定颜色的噪声,这取决于价格值分布的参数。由此,可以从不同角度分析价格变化,并将价格变动视为特定颜色的噪声,可以获得有关市场当前状态的信息并对价格行为进行预测。 在分析指标读数时,会考虑指标线的位置 - 它们位于当前柱的开盘价的上方或下方以及距离它的距离。 白噪声(白噪声) - 这种方法的特点是价格(当前和史前)被认为功率相等,这与简单的移动平均值相结合。白噪声信号更有可能证实这一特征 - 它越偏离当前价格,市场中的趋势运动就越强烈。相反,如果白噪声线接近开盘价,那么这就是趋势结束或横向价格变动的证据。 闪烁噪声(闪烁噪声)概述了趋势的上边界或下边界(取决于线是否高于或低于价格)。此外,这种噪音线与货币对价格的交叉点可以作为新趋势开始的证据,甚至是短期趋势的开始。 布朗噪声在很多方面的行为类似于指数平滑。因此,噪声线跟随价格,只有市场突然和突然的变化才有可能出现大的偏差。 蓝噪声显示趋势对当前趋势的强烈程度。由于蓝色噪声线与当前价格存在较大偏差,我们可以说趋势已经耗尽其力量并接近完成。 紫色噪音表明周期性或周期性价
尽管“ AIS Color Noise Filter ”指示器存在一些缺点,但使用它来平滑价格序列和预测价格的想法看起来非常有吸引力。 这是由于以下几个原因: 首先,考虑到几个噪声成分,可以建立相互独立的因素预测,从而提高预测质量; 其次,价格序列的噪声特征在整个历史中表现得相当稳定,从而可以获得稳定的结果; 最后,噪声变化使我们希望预测系统非常敏感,并且它对价格变化的反应将非常快。 因此,我们得到一个指标,尽管有所有简化,但能够准确预测价格将会移动的渠道。该指标的主要优点是速度快,易于学习。主要缺点是指标无法选择最重要的预测因素。 LH 是一个参数,用于设置进行预测的历史数据的长度。其允许值为0  -  255,而指标处理的柱数超过此参数指定的单位数。
很多时候,在金融系列的研究中应用他们的平滑。使用平滑,您可以删除高频成分 - 据信它们是由随机因素引起的,因此无关紧要。平滑总是包括一些平均数据的方法,其中时间序列中的随机变化相互吸收。大多数情况下,为此目的,使用简单或加权移动平均方法,以及指数平滑。 这些方法中的每一种都有其优点和缺点。因此,简单的移动平均值简单直观,但其应用需要时间序列的周期和趋势分量的相对稳定性。另外,信号延迟是移动平均值的特征。指数平滑方法没有滞后效应。但即使在这里也存在缺陷 - 只有在将系列与随机异常值对齐时,指数平滑才有效。 简单和指数平均值之间的合理折衷是使用加权移动平均线。但是,存在选择特定重量值的问题。让我们一起尝试解决这个问题。 因此,首先要定义我们希望从平滑过程中实现的目标: •首先,我们需要从价格序列中删除随机变化和噪音; •其次,我们希望识别异常排放和异常价格行为,这些行为也可用于贸易; •最后,平均程序应确定市场中存在的可持续趋势。 当然,我们希望平滑程序适应当前的市场情况。 为了获得理想的结果,我们将根据此价格水平与研究期间的最高和最低价格之间的差异来计算权重。通过这种方法,我们得到一个
为了隔离长期和非随机组件,不仅要知道价格变化了多少,还要知道这些变化是如何发生的。换句话说 - 我们不仅对价格水平的价值感兴趣,而且对这些水平相互替代的顺序感兴趣。通过这种方法,人们可以找到影响(或可能影响)特定时间点价格变化的长期和稳定因素。了解这些因素可以让您做出或多或少准确的预测。 让我们确定我们希望从财务系列的分析中得到什么具体结果: •首先,我们需要强调这一趋势,如果它存在于市场中; •其次,我们需要确定周期性成分; •第三,结果应足够稳定,可用于预测; •最后,我们的分析方法应该适应当前的市场形势。 为了满足指定的条件,我们使用相对价格变化的回归分析,并基于该模型做出指标。该指标的算法基于对历史数据的学习,其工作在交易者的完全控制之下。 LH 是一个参数,用于确定用于平滑金融系列的柱数。其允许值介于0到255之间。 UTS 是影响学习速度和深度的参数。它的值也在0到255之间。如果UTS的值为零,则在整个历史记录中进行学习。在所有其他情况下,训练集会不时更新。更新越频繁,UTS值越小。 该指标的主要缺点是,当平滑金融系列被认为是静止时,这可能会导致一些延迟。
其中一种强大的分析方法是使用Levy流程对财务系列进行建模。这些过程的主要优点是它们可用于模拟大量现象 - 从最简单到最复杂。我只想说市场中分形价格变动的想法只是Levy过程的一个特例。另一方面,通过适当选择参数,任何Levy过程都可以表示为简单的移动平均值。图1显示了一个Levy过程的示例,其中片段放大了几次。 让我们考虑使用Levy流程来平滑价格图表的可能性。首先,您需要选择Levy过程的参数,以便它可以用于模拟线性过程。然后我们得到一个权重系统,其中包括不同符号的系数。有了这个,我们不仅可以平滑金融范围,还可以跟踪其中存在的反趋势和周期性成分。 通过选择参数 LF 来配置指示器的操作。它决定了故事的深度,并将对其进行分析。此参数的允许值位于0  -  255之间。用于计算的条形数将比此数字多两个。 蓝线表示高价平滑的结果,绿线表示收盘价,红线表示低价。 该指标的主要缺点是根据严格定义的算法执行抗锯齿,该算法没有考虑市场中的急剧和强烈变化。此外,与所有平滑指标一样,存在可以达到简单移动平均值的滞后。
AIS Channel Price
Aleksej Poljakov
通常,交易者面临着确定价格在不久的将来可能发生变化的程度的任务。为此,您可以使用Johnson分发类型SB。这种分布的主要优点是即使只有少量的累积数据也可以使用它。用于确定此分布参数的经验方法允许您准确地确定价格通道的最大和最小水平。 这些值可用于不同的情况。例如,它们可用于设置市场订单的止损和止盈水平,或挂单的入场点。此外,使用追踪止损时可以定向这些水平。此外,在历史足够大的情况下,指标可能预示着上升趋势或下降趋势的开始。嗯,或者说它的结束,如果这样的趋势是。 该指标的主要缺点是对价格排放的敏感度极高,以及对市场形势变化的反应较迟。 蓝色和红色线分别显示价格通道的最大值和最小值。绿线表示在给定市场情况下价格的均衡值。 使用 LB 参数配置指标。此参数确定将在计算中使用的柱数,其允许值在2-64之间。
此指标可让您确定价格达到一个或另一个级别的可能性。它的算法非常简单,并且基于对特定货币对的价格水平的统计数据的使用。由于收集的历史数据,可以确定价格在当前柱形期间的变化程度。 尽管简单,但该指标可以为交易提供宝贵的帮助。因此,在其帮助下,可以确定交易头寸的TakeProfit和StopLoss水平。它可以帮助确定挂单的价格和确定TrailingStop的价格水平。 此外,该指标可以纳入现有战略。例如,您使用某种日内策略。然后,通过在D1时间框架上设置此指标,您可以在克服已经不希望开启新交易头寸之后获得水平。 该指标的主要缺点是它完全依赖于历史数据,并且不会以任何方式对某些当前的市场变化作出反应。 通过选择输入参数-L1 ... L4来执行该指标的设置 - 每个输入参数确定从每个柱的开盘价达到价格价格的概率。每个参数的值必须在99 ... 0之内,并且以下每个参数必须严格小于前一个参数。 尼古拉·尼古拉耶维奇(Nikolai Nikolaevich)是创造这个指标的意识形态灵感,如果你喜欢这个指标,那就写下几句话,我会告诉他。
可持续的分配可用于平滑财务系列。由于可以使用相当深的历史来计算分布参数,因此在某些情况下,与其他方法相比,这种平滑甚至更有效。 该图显示了H1时间框架内EUR-USD货币对的开盘价分布十年的示例(图1)。看起来很迷人,不是吗? 该指标的主要思想是通过价格分散来确定可持续分配的参数,然后使用这些数据来平滑财务序列。由于这种方法,在给定的市场情况下,平滑后的值将趋于最可能的价格值。 使用参数LB组态指示器的操作。它的值确定平滑序列的长度,以巴表示。允许值在1-255的范围内。 蓝线表示平滑的高价,红线表示低价,绿线表示收盘价。 该指标的主要缺点是无法设置平滑窗口的宽度,因此指标在历史记录的所有部分中均保持稳定。因此,交易者必须根据其特定要求选择参数。
筛选:
无评论
回复评论