Auto Midas VWAP
- 指标
- Paulo Henrique Faquineli Garcia
- 版本: 1.9
- 激活: 5
AUTO MIDAS VWAP
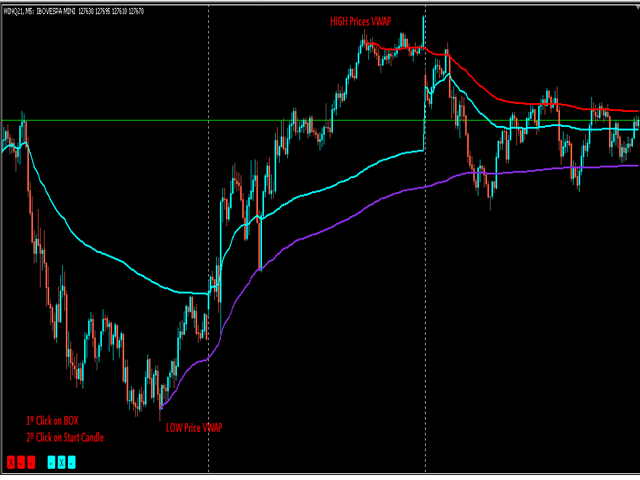
Volume Weighted Average Price (VWAP) is a trading benchmark commonly used by Big Players that gives the average price a Symbol has traded throughout the day. It is based on both Volume and price.
Commonly, MIDAS VWAP damand you to determine the initial point of analysis. This indicator plots automatically based on ZigZag Approach.
You will be able to use up to 3 HIGH MIDAS VWAP's and 3 LOW MIDAS VWAP's.
Wish the best trade results!!