• 概述
  • 评论
  • 评论

AIS Lehmer Moving Average

Lehmer均值可以看作是一个窗函数,其权重系数取决于计算中使用的变量的值。该平均值是非线性的,因为在其计算中使用了取幂。
指标的特征取决于两个参数:
  • iPeriod - 指标周期,有效值大于等于2;
  • iPower - 指数,在计算指标值时使用。有效范围是 -32768 到 32767

在 iPower = 0 时,我们得到调和平均值,
iPower = 1 - 算术平均值,
对于 iPower = 2,反谐波平均值。
Lehmer 均值具有较大的指数,突出了时间序列的最大边界。对于负指数,强调最小值。由于此属性,Lehmer 均值可用于平滑时间序列和构建通道。

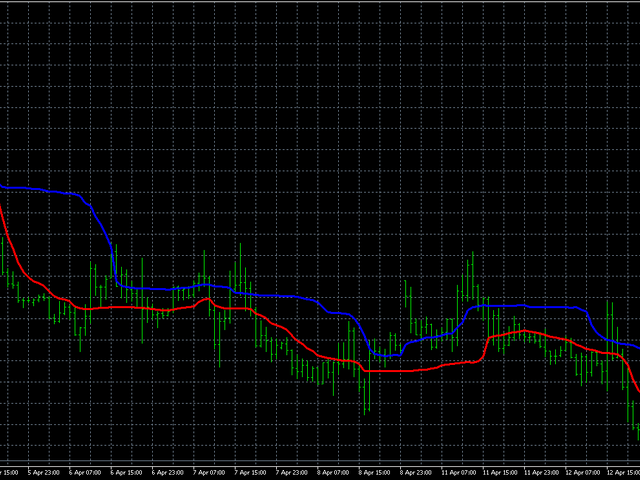
第一张图片显示了使用收盘价计算的通道,指数为 +500 和 -500。
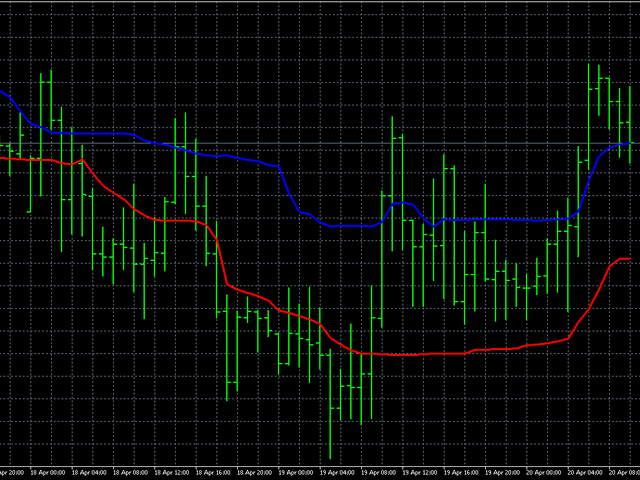
第二张图片显示了同一通道,iPower = +1000 和 -1000。
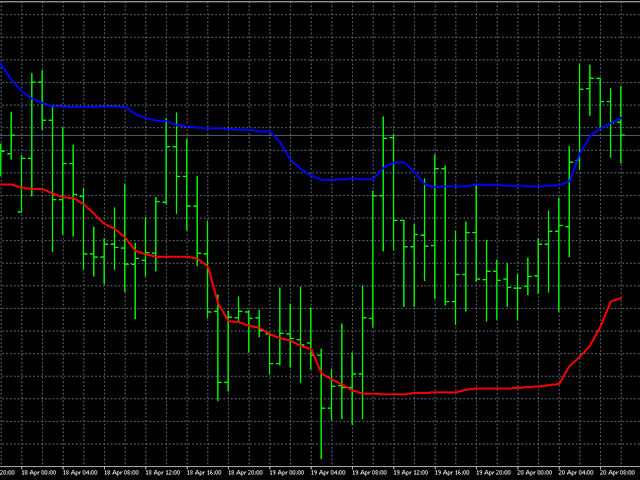
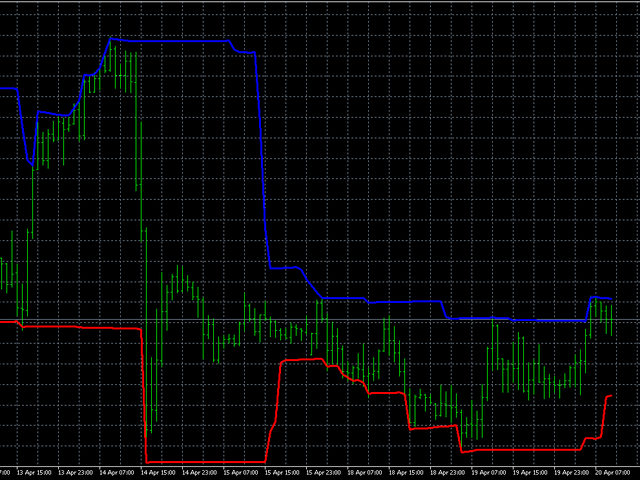
在第三和第四个数字中,Lehmer 的平均值适用于 +/- 1000 和 +/- 5000 的最高价和最低价。
推荐产品
PABT Pattern Indicator - it's classical system one of the signal patterns. Indicator logic - the Hi & Lo of the bar is fully within the range of the preceding bar, look to trade them as pullback in trend. In the way if indicator found PABT pattern it's drawing two lines and arrow what showing trend way.  - First line - it's entry point and drawing at: 1. On the high of signal bar or on middle of the signal bar (depending from indicator mode) for buy; 2. On the low of signal bar or on middle of t
Infinity Trend Pro
Yaroslav Varankin
1 (1)
This is a trend indicator without redrawing Developed instead of the binary options strategy (by the color of the Martingale candlestick) Also works well in forex trading When to open trades (binary options) A signal will appear in the place with a candle signaling the current candle It is recommended to open a deal for one candle of the current timeframe M1 and M5 When a blue dot appears, open a deal up When a red dot appears, open a trade down. How to open trades on Forex. When a signal is rec
Trendiness Index
Libertas LLC
5 (3)
"The trend is your friend" is one of the best known sayings in investing, because capturing large trendy price movements can be extremely profitable. However, trading with the trend is often easier said than done, because many indicators are based on price reversals not trends. These aren't very effective at identifying trendy periods, or predicting whether trends will continue. We developed the Trendiness Index to help address this problem by indicating the strength and direction of price trend
Owl smart levels
Sergey Ermolov
4.63 (54)
MT5版本  |  FAQ Owl Smart Levels Indicator   是一個完整的交易系統,包含   Bill Williams   的高級分形、構建正確的市場波浪結構的 Valable ZigZag 以及標記準確入場水平的斐波那契水平等流行的市場分析工具 進入市場和地方獲利。 策略的详细说明 指示灯使用说明 顾问-贸易猫头鹰助手助理 私人用户聊天 ->购买后写信给我,我会将您添加到私人聊天中,您可以在那里下载所有奖金 力量在於簡單! Owl Smart Levels   交易系統非常易於使用,因此適合專業人士和剛開始研究市場並為自己選擇交易策略的人。 策略和指標中沒有隱藏的秘密公式和計算方法,所有策略指標都是公開的。 Owl Smart Levels 允許您快速查看進入交易的信號,突出顯示下訂單的水平並向您發送有關已出現信號的通知。 優點很明顯: 清楚地顯示主要和更高時間框架的趨勢方向。 指示儀器信號的出現。 標記開單、止損設置和固定利潤的水平。 沒有多餘的,只有必要的結構! ZigZag   表示全球趨勢的方向,因此也表示貿易方向。 市場反轉點的短線清楚地表明在
Insider Scalper Binary This tool is designed to trade binary options. for short temporary spends. to make a deal is worth the moment of receiving the signal and only 1 candle if it is m1 then only for a minute and so in accordance with the timeframe. for better results, you need to select well-volatile charts.... recommended currency pairs eur | usd, usd | jpy .... the indicator is already configured, you just have to add it to the chart and trade .... The indicator signals the next can
不重繪箭頭的外匯剝頭皮指標。它在 M5、M15、M30、H1 時間框架上效果最佳。默認設置適用於 M5 時間範圍。下圖顯示了使用“period=0.35”參數值處理 H1 圖表的示例。您可以下載演示版並自行測試。現在,我們幾乎在所有剝頭皮策略中都使用該指標的信號。根據我們的計算,其信號的準確性約為 95%,具體取決於時間範圍。該指標適用於所有貨幣對。我們已經在所有主要貨幣對和金屬上進行了測試。在任何地方都獲得了幾乎相同的 +-95% 的準確度。 指標的好處: 不重繪箭頭 適用於所有貨幣對 高信號精度 適合剝頭皮 指標設置: period - 計算信號精度的周期。 Price - 告訴指標使用哪個價格:CLOSE、OPEN、HIGH、LOW。默認情況下,該指標適用於收盤價。
COG LR Osc AM
Andriy Matviyevs'kyy
The presented indicator allows you to determine potential entry points into the market and set protective orders at reasonable levels. This product can be useful for both beginners and experienced traders. The indicator is based on calculation methods proven by time and practicing traders. The indicator is calculated in two stages: At the first stage, linear regression (LR) of the selected price type is determined for a given number of chart periods. At the second stage, the obtained data is p
Trade with Gann on your side!! MASTER CIRCLE 360 CIRCLE CHART, originally created by Gann admitted that this is “The Mother of all charts”. It is one of the last studies that this great trader left for us. The numeric tab le is apparently quite simple like all the tables and is based on square numbers, the SQUARE OF 12 and is by evolution, one of the most important square numbers. Here we can find CYCLE, PRICE AND TIME thanks to angles and grades, to show past and future support and resistance.
Signal From Level
Yaroslav Varankin
Binary Options Support Resistance Indicator This indicator is designed for binary options trading and effectively shows retracements from support and resistance levels. Signals appear on the current candle. A red arrow pointing downwards indicates a potential selling opportunity, while a blue arrow pointing upwards suggests buying opportunities. All that needs adjustment is the color of the signal arrows. It is recommended to use it on the M1-M5 timeframes as signals are frequent on these timef
Atomic Analyst
Issam Kassas
5 (3)
首先值得强调的是,该交易指标是非重绘、非延迟的指标,这使其成为手动和机器人交易的理想选择。 用户手册:设置、输入和策略。 Atomic Analyst是一种PA价格行动指标,利用价格的力量和动量来寻找市场上更好的机会。配备了高级过滤器,可帮助去除噪音和假信号,并提高交易潜力。使用多层复杂的指标,Atomic Analyst扫描图表,并将复杂的数学计算转化为任何初学者都能理解并用来做出一致交易决策的简单信号和颜色。 “Atomic Analyst”是专为新手和经验丰富的交易者量身定制的综合交易解决方案。它将高级指标和一流功能融合为一体的交易策略,使其成为所有类型交易者的多功能选择。 日内交易和剥头皮策略:专为快速准确的日内交易和短期交易而设计。 日内和摆动交易策略:可用作追求价格大幅波动的日内和摆动交易者的可靠工具。 多货币和市场:凭借其可靠的精度,在不同的工具和市场上运作。 多个时间框架:可在多个时间框架上使用,性能良好。 稳定性:所有指标均不重绘、不重绘和不滞后,确保可靠的信号。 信号清晰度:提供箭头信号,用于清晰的入场和出场点。 实时警报:通过交易入场、SL和TP警报通知交
The indicator detects and displays 3 Drives harmonic pattern (see the screenshot). The pattern is plotted by the extreme values of the ZigZag indicator (included in the resources, no need to install). After detecting the pattern, the indicator notifies of that by a pop-up window, a mobile notification and an email. The indicator highlights the process of the pattern formation and not just the complete pattern. In the former case, it is displayed in the contour triangles. After the pattern is com
ATeam Divergence
Hoang Ngoc Thach
The CCI Divergence is a reasonably useful indicator in itself, but it is even more effective when used with divergence pattern trading. The CCI Divergence indicator signal is one of the most potent signals among the indicators that exist in the market. Here is new version for Divergence Indicator using CCI method, with more improvements. Divergences indicate a potential investment point because the directional moment does not confirm the price. A bullish divergence occurs when the underlying
Fractal Zig Zag
Mikhail Nazarenko
5 (1)
A   professional version of the ZigZag indicator for visualizing the structure of price movements by fractals. Fractal ZigZag fixes the flaws of the standard version of the ZigZag indicator MT4. It uses Price action and a unique filtering algorithm to determine fractals. Suitable for all types of trading. Ideal for trading according to the WM pattern "Sniper" strategy !!! Features Marks the place of price reversal during the formation of a new fractal with specified parameters. Suitable for
Heiken Ashi Smoothed Strategy is a very simple but powerful system to get forex market trend direction. This indicator is actually 2 indicators in 1 pack, Heiken Ashi and Heiken Ashi Smoothed Moving Average both included. Because HA (Heiken Ashi) and HAS (Heiken Ashi Smoothed) are calculated in the same one system event with necessary buffers and loop only, so it is the FAST, OPTIMIZED and EFFICIENT HA having the combined indicator of MetaTrader 4. You can choose to display HA and HAS in the sam
Renko, Heiken Ashi, Ticks Bar, Range Bar.    Easy switching, easy setup, all in one window.        Place the Custom Chart indicator and view Renko, Heiken Ashi, Tick bar, Range bar charts in real time at real chart.    Position the offline chart window so that the indicator control panel is visible.    Switch the chart mode by click of a button.    Connect to the output chart any indicator, expert advisor without any restrictions.    No, it doesn't work in the tester.    Yes, you can use an
Automated Trendlines
Georgios Kalomoiropoulos
5 (17)
趋势线是外汇交易中最重要的技术分析工具。不幸的是,大多数交易者没有正确绘制它们。自动趋势线指标是专业交易者的专业工具,可帮助您可视化市场的趋势运动。 有两种类型的趋势线看涨趋势线和看跌趋势线。 在上升趋势中,外汇趋势线是通过价格变动的最低摆动点绘制的。 连接至少两个“最低点”将创建一条趋势线。 在下跌趋势中,趋势线是通过价格走势的最高摆动点绘制的。 连接至少两个“最高点”将创建一条趋势线。 趋势线何时突破? 当看跌蜡烛收于看涨​​趋势线下方并且蜡烛的高点在趋势线上方时,看涨趋势线会被打破。 当看涨蜡烛收于看跌趋势线上方并且蜡烛的低点低于趋势线时,看跌趋势线会被打破。 趋势线何时删除? 当一根完整的蜡烛在看涨趋势线下方形成时,看涨趋势线将被删除。 当完整的蜡烛在看跌趋势线上方形成时,看跌趋势线将被删除。 您可以从输入参数更改看涨和看跌趋势线的颜色和宽度。
Power Renko MT4
Pierce Vallieres
Power Renko is an indicator which plots Renko bricks underneath the chart using a histogram. You can select the brick size and the timeframe of the Renko bricks as well as whether or not to use the close price or the high/low price of the candles. Renko bricks are based on price alone, not time, therefor the Renko bricks will not be aligned with the chart's time. They are extremely useful for trend trading and many different strategies can be formed from them. Buffers are provided allowing you t
Chart Patterns Detect 15 patterns (Ascending Triangle, Descending Triangle, Rising Wedge, Falling Wedge, Bullish Flag, Bearish Flag, Bullish Rectangle, Bearish Rectangle Symmetrical triangle, Head and Shoulders, Inverted Head and Shoulders, Triple top, Triple Bottom, Double Top, Double Bottom) Use historical data to calculate the probability of each pattern to succeed (possibility to filter notification according to the chance of success) gives graphic indication about the invalidation level and
The Th3Eng PipFinite indicator is based on a very excellent analysis of the right trend direction with perfect custom algorithms. It show the true direction and the best point to start trading. With StopLoss point and Three Take Profit points. Also it show the right pivot of the price and small points to order to replace the dynamic support and resistance channel, Which surrounds the price. And Finally it draws a very helpful Box on the left side on the chart includes (take profits and Stop loss
DivirgentMAX
Mikhail Bilan
Indicator without redrawing Divergent MAX The DivirgentMAX indicator is a modification based on the MACD. The tool detects divergence based on OsMA and sends signals to buy or sell (buy|sell), taking into account the type of discrepancies detected. Important!!!! In the DivirgentMAX indicator, the optimal entry points are drawn using arrows in the indicator's basement. Divergence is also displayed graphically. In this modification of the MACD, the lag problem characteristic of its predecessor
Introduction It is common practice for professional trades to hide their stop loss / take profit from their brokers. Either from keeping their strategy to the themselves or from the fear that their broker works against them. Using this indicator, the stop loss / take profit points will be drawn on the product chart using the bid price. So, you can see exactly when the price is hit and close it manually.  Usage Once attached to the chart, the indicator scans the open orders to attach lines fo
Crosskalp1
Mikhail Bilan
Добрый День уважаемые трейдеры!  Вашему вниманию индикатор созданный и работающий на базе трендовика ADX,  для торговли на смене направления движения который учитывает коррекцию и даёт возможность на ней заработать.  Применяю этот индикатор для скальпинга. Рекомендую таймфреймы от 15 ти минутного(М15) до часового (Н1) периодов.  Красный кружок сигнал на продажу- Sell) Зелёный кружок  сигнал на покупку Buy) Чем меньше ваш таймфрейм тем меньше пунктов вы зарабатываете.   Важно выставлять стопы! !В
Distinctive
Tatiana Savkevych
Distinctive is a forex trending arrow indicator for identifying potential entry points. I like it, first of all, because it has a simple mechanism of work, adaptation to all time periods and trading tactics. Created on the basis of a regression channel with filters. Plotting the Lawrence indicator signals on a price function chart using a mathematical approach. How it works - when the price breaks out in the overbought / oversold zone (channel levels), a buy or sell signal is generated. Every
Wave Wolf MT4
Andrei Salanevich
Wave Wold MT4外汇指标旨在搜索狼波并将其显示在交易终端的当前窗口中。 对于在交易中使用狼波的交易者来说,这是一个很好的指标。 它在交易策略中的应用将显着提高其效率和盈利能力。 有关指标的信息 与其他Wolf wave指标不同,Wave Wold MT4外汇指标具有许多显着提高其有效性的功能: 第一个是打开的Windows5point参数(真值)提供信息支持,即扩展了狼波出现在其上的图表的窗口。 例如,如果EURUSD、AUDUSD和GBPUSD图表是开放的,并且每个图表都安装了Wave WOLD MT4指标,那么如果检测到欧元模型,相应的图表将自动被带到其他图表的顶部,这在交易大量工具时变得非常方便。  第二个功能是MACD上的内置发散分析,用户可以自己选择参数(默认设置(12,26,9))。 顺便说一下,通常振荡器的值不显示在工作窗口上,只反映在形成点(5)时的价格标签的颜色上,特别是,如果标签的颜色是蓝色,则没有发散,如果颜色是红 如何使用指标 Wave WOLD MT4指标显示第4个形成点的假设Wolf模型和第5个点的形成区域(所谓的甜区,以黄色显示)。
Alpha Trend
Evgeny Belyaev
3.33 (3)
Alpha Trend is a trend indicator for the MetaTrader 4 platform; it has been developed by a group of professional traders. The Alpha Trend indicator finds the most probable tendency reversal points, which allows making trades at the very beginning of a trend. This indicator features notifications, which are generated whenever a new signal appears (alert, email, push-notification). This allows you to open a position in a timely manner. Alpha Trend does not redraw, which makes it possible to evalua
SUPER SALE! --> BUY Trend Reader Indicator with -$180 OFF and GET a BONUS EA: News Scope EA PRO with AMAZING results! NOTE: Trend Reader Indicator PROMO price: $117 (The next price $297) - The offer ends soon! Click here to check News Scope EA PRO results and learn more about the promotion! Trend Reader Indicator is a revolutionary trading indicator designed to empower forex traders with the tools they need to make informed trading decisions. This cutting-edge indicator utilizes complex mathema
The indicator displays the data of the Stochastic oscillator from a higher timeframe on the chart. The main and signal lines are displayed in a separate window. The stepped response is not smoothed. The indicator is useful for practicing "manual" forex trading strategies, which use the data from several screens with different timeframes of a single symbol. The indicator uses the settings that are identical to the standard ones, and a drop-down list for selecting the timeframe. Indicator Parame
Trend PA
Mikhail Nazarenko
5 (3)
The Trend PA indicator uses   Price Action   and its own filtering algorithm to determine the trend. This approach helps to accurately determine entry points and the current trend on any timeframe. The indicator uses its own algorithm for analyzing price changes and Price Action. Which gives you the advantage of recognizing, without delay, a new nascent trend with fewer false positives. Trend filtering conditions can be selected in the settings individually for your trading style. The indicator
TrendInChannel
Andriy Sydoruk
This indicator is the undisputed leader among the indicators. And for this statement there is a good reason. The indicator builds a very high quality channel in which it generates signals to enter! What is the ideal strategy for the trader, since the trader always hesitates when choosing a strategy for the job. That is, this indicator will allow you to solve the dilemma of choosing a job by trend or to the channel, since it combines these two basic concepts. Working with the indicator is very
该产品的买家也购买
TPSpro RFI Levels
Roman Podpora
4.85 (20)
Reversal First Impulse levels (RFI)    INSTRUCTIONS        RUS       -       ENG              R ecommended to use with an indicator   -   TREND PRO -  Version MT5 A key element in trading is zones or levels from which decisions to buy or sell a trading instrument are made. Despite attempts by major players to conceal their presence in the market, they inevitably leave traces. Our task was to learn how to identify these traces and interpret them correctly. Main functions: Displaying active zones
TPSproTREND PrO
Roman Podpora
4.78 (18)
TPSpro TRENDPRO  - is a trend indicator that automatically analyzes the market and provides information about the trend and each of its changes, as well as giving signals for entering trades without redrawing! The indicator uses each candle, analyzing them separately. referring to different impulses - up or down impulse. Exact entry points into transactions for currencies, crypto, metals, stocks, indices!  -  Version MT5               DETAILED DESCRIPTION                R ecommended to use with
Enigmera
Ivan Stefanov
5 (3)
ENIGMERA:市场核心 https://www.enigmera.com 简介 该指标和交易系统是金融市场的一种非凡方法。ENIGMERA 利用分形周期精确计算支撑位和阻力位。它能显示真实的累积阶段,并给出方向和目标。 该系统无论在趋势中还是在修正中都能发挥作用。 它是如何运行的? ENIGMERA 由三条线组成:支撑/阻力线、目标线和偏离线。与一般市场指标将过去的数据推断为现在和未来的情况不同,该系统能提供当前的完整情况。如果你处于支撑位,这意味着真正的支撑;如果你处于阻力位,这意味着真正的阻力。如果突破某一水平,则表示趋势发生变化。没有重绘。 由于市场在不断变化,ENIGMERA 不断调整其评估工具,定期修改策略。  这保证了每种情况都能得到全面评估。这一市场指标的独特性显而易见,其能力不言而喻。  ENIGMERA 为金融分析师和咨询师提供服务,他们需要可靠的见解与客户分享,也为投资者提供服务,他们需要最精确和最可靠的保证。 该系统能够达到最佳精度,使交易者能够自信、清晰地评估他们的选择。 ENIGMERA 将 20 年的交易专长和知识整合到一个综合软件
Advanced Currency Strength28 Indicator
Bernhard Schweigert
4.91 (665)
目前26%的折扣 任何新手或专家交易者的最佳解决方案! 这个指标是一个独特的、高质量的、可负担得起的交易工具,因为我们纳入了一些专有的功能和一个新的公式。只需一个图表,你就可以读出28个外汇对的货币强度!想象一下,你的交易将如何得到改善,因为你的交易是在你的手中进行的。想象一下,你的交易将如何改善,因为你能够准确地确定新趋势或剥头皮机会的触发点? 用户手册:点击这里  https://www.mql5.com/en/blogs/post/697384 这是第一本,原版的! 不要买一个毫无价值的崇拜者的克隆品。 特别的 子窗口中的箭头显示强劲的货币势头GAP将指导你的交易! 当基础货币或报价货币处于超卖/超买区域(外盘斐波那契水平)时,在个人图表的主窗口中出现警告信号。 当货币力量从外围区间回落时,回撤/反转警报。 十字星模式的特别警报 可选择多个时间框架,以快速查看趋势! 货币强度线在所有的时间框架中都非常平稳,当使用较高的时间框架来识别总体趋势,然后使用较短的时间框架来确定精确的入口时,效果非常好。你可以根据自己的意愿选择任何时间框架。每个时间框架都由其自身进
Scalper Inside PRO
Alexey Minkov
4.74 (58)
An exclusive indicator that utilizes an innovative algorithm to swiftly and accurately determine the market trend. The indicator automatically calculates opening, closing, and profit levels, providing detailed trading statistics. With these features, you can choose the most appropriate trading instrument for the current market conditions. Additionally, you can easily integrate your own arrow indicators into Scalper Inside Pro to quickly evaluate their statistics and profitability. Scalper Inside
Advanced Supply Demand
Bernhard Schweigert
4.92 (313)
现在优惠 33%! 任何新手或专业交易者的最佳解决方案! 该指标是一款独特、高质量、且价格合理的交易工具,因为我们已经整合了许多专有功能和新公式。 依据此更新,您将能够显示双重时间帧区域。 您不仅可以显示一个较高的时间帧,还可以同时显示图表时间帧,加上更高的时间帧:显示嵌套时区。 供需双方所有交易者都会喜欢它。 :) 重要信息披露 高级供需的最大潜力,请访问 https://www.mql5.com/zh/blogs/post/720245   想象您的交易如何得以改善,是因为您能够精准定位入场或目标位吗? 构建于新的底层算法,它可以更轻松地识别出买卖双方之间的潜在失衡。 这是因为它以图形方式展示供需最强劲区域,及其过去的表现(显示旧区域)。 这些功能旨在帮助您更轻松地发现最佳入场区域和价位。 现在您可以针对您的交易品种和时间帧来优化和编辑区域强度! 高级供需指标适用于所有产品和时间帧。 它是一个新的公式,非常新的功能是两个区域强度函数可由用户输入进行调整! 这在交易中是一大优势。 当您学习如何使用专有功能,例如带有价格游离最小 X 因子的区域强度时,您能够判断该区域强劲与否。 供
目前八折优惠! 对任何新手或专家交易者来说都是最好的解决方案! 这个仪表板软件适用于28种货币对。它基于我们的两个主要指标(高级货币强度28和高级货币冲动)。它对整个外汇市场提供了一个伟大的概述。它显示高级货币强度值,货币运动速度和28个外汇对在所有(9)时间段的信号。想象一下,当你可以使用图表上的单一指标观察整个市场,以确定趋势和或剥头皮的机会时,你的交易将得到改善 我们已经在这个指标中建立了一些功能,使你更容易识别强势和弱势货币,同时识别和确认潜在的交易。该指标以图形方式显示货币的强势或弱势是增加还是减少,以及它在所有时间段的表现。 增加的新功能是动态市场斐波那契水平,它适应当前的市场条件变化,这是一个已经在我们的高级货币强度28和高级货币冲动指标中使用的成熟的加分项。 在交易时,总是将弱势货币和强势货币配对,这个新指标将帮助你做到这一点。 用户手册:点击这里  https://www.mql5.com/en/blogs/post/708783 特点  显示每个时间段的ACS28和GAP-speed(冲动)的货币强度值。 列:颜色代码以7种颜色
FX Volume
Daniel Stein
4.6 (35)
通过 mql5 和 Telegram 上 的 " 晨间简报 "获取每日市场更新,包括详细信息和屏幕截图 ! 外汇交易量(FX Volume)是第一个也是唯一一个从经纪商角度真正洞察市场情绪的交易量指标。 直接在您的图表上看到这些信息是真正改变游戏规则和突破性的交易解决方案。 受益于独特的市场数据洞察,如 比率(Ratios )显示货币多头和空头头寸的比率(百分比 比率变化 显示所选时间段内的多头比率及其百分比变化 总交易量 显示货币的总交易量(多头和空头),以手为单位 多头 交易量显示货币所有多头头寸的交易量 空头 交易量显示所有货币空头头寸的交易量 净多头 显示净多头交易量,即所有多头头寸减去所有空头头寸(以手为单位)。 净多头百分比 显示货币净多头交易量的变化 请阅读我们的基本教程 -> "如何使用外汇交易量进行交易 " 获取更多信息,如常见问题、交易技巧和教程视频,请访问我们的 外汇交易量公共信息频道 请 安装并运行 SI Connect 以建立与我们数据中心的持续连接 背景信息 我们都知道,外汇是一个分散的市场。这就是为什么我们必须打破常规思维,开发一个独
FX Power MT4 NG
Daniel Stein
5 (11)
通过 mql5 和 Telegram 上 的晨间简报获取每日市场更新,包括详细信息和屏幕截图 ! FX Power MT4 NG 是我们长期以来非常受欢迎的货币强度计算器 FX Power 的下一代产品。 这款下一代强度计算器能提供什么?您所喜爱的原版 FX Power 的所有功能 附加功能 黄金/XAU 强度分析 更精确的计算结果 可单独配置的分析周期 可自定义计算限制,以获得更好的性能 为希望查看更多信息的用户提供特殊的多实例设置 无尽的图形设置,可在每个图表中设置您最喜欢的颜色 无数的通知选项,让您再也不会错过任何重要信息 采用 Windows 11 和 macOS 风格的全新圆角设计 神奇的移动指标面板 FX Power 主要功能 所有主要货币的完整强势历史 所有时间框架内的货币强弱历史 所有经纪商和图表的计算结果完全相同 100% 可靠的实时计算 -> 无重绘 可通过下拉列表选择分析时段 通过自定义模式单独配置分析时段 可在一个图表中使用多个实例 可移动 FX Power 显示屏(通过拖放) 适用于高分辨率 QHD、UHD 和 4K 显示器 自动终端配置 针对平板电脑
TrendMaestro
Stefano Frisetti
5 (3)
note: this indicator is for METATRADER4, if you want the version for METATRADER5 this is the link:  https://www.mql5.com/it/market/product/108106 TRENDMAESTRO ver 2.4 TRENDMAESTRO recognizes a new TREND in the bud, he never makes mistakes. The certainty of identifying a new TREND is priceless. DESCRIPTION TRENDMAESTRO identifies a new TREND in the bud, this indicator examines the volatility, volumes and momentum to identify the moment in which there is an explosion of one or more of these data a
GOLD Impulse with Alert
Bernhard Schweigert
4.56 (9)
这个指标是我们2个产品 Advanced Currency IMPULSE with ALERT  +   Currency Strength Exotics 的一个超级组合。 它适用于所有时间框架,并以图形方式显示8种主要货币和一种符号的强势或弱势冲动! 该指标专门用于显示任何符号的货币强度加速,如黄金、异国货币对、商品、指数或期货。这是它的第一个指标,任何符号都可以被添加到第9行,以显示黄金、白银、石油、DAX、US30、MXN、TRY、CNH等的真实货币强度加速(冲动或速度)。 建立在新的基础算法上,它使识别和确认潜在的交易更加容易。这是因为它以图形方式显示了一种货币的强势或弱势是否正在加速,并测量了这种加速的速度--把它想象成你汽车中的速度表。当你加速时,事情显然会发生得更快,这在外汇市场上也是一样的,即如果你配对的货币正在向相反的方向加速,你就会发现一个潜在的有利可图的交易。 动态市场斐波那契28水平被用作警报触发器,将适应市场活动。如果冲动击中黄色触发线,你将收到警报。然后你就知道作为一个交易员应该做什么。货币对和方向已经给出。只需点击警报按钮,就可以
TakePropips Donchian Trend Pro
Eric John Pajarillaga Aldana
4.82 (17)
TakePropips Donchian Trend Pro   (MT4) 是一款功能强大且有效的工具,可使用 Donchian 通道自动检测趋势方向,并为您提供进场和退场交易信号! 这个多功能指标包括趋势扫描器、交易信号、统计面板、筛选器、交易时段和警报历史仪表板。它旨在为您提供交易信号并节省您分析图表的时间! 您可以在我们的博文中下载用户手册和安装指南:   https   :// www.mql5.com/en/blogs/post/751368 今天立减 50%!价格从 98 美元降到 49 美元! 您可以在 Strategy Tester 上测试该指标(启用可视模式) 视频教程也可在说明下方获得更多详细信息。 如果您有任何问题或需要任何帮助,请与我联系。 TakePropips Donchian Trend Pro 指标适用于所有外汇对、金属、商品、指数和加密货币。 主要特点 交易信号 - 检测多个时间范围内所有货币对的买卖机会。它将为您提供警报并在图表上绘制交易信号,最多 3 个止盈价和一个止损价。 Trend Scanner   - 用于快速扫描和识别跨多个时间
Quantum Trend Sniper Indicator MT4
Bogdan Ion Puscasu
4.6 (40)
介绍   量子趋势狙击指标 ,突破性的 MQL5 指标,正在改变您识别和交易趋势反转的方式!由拥有超过13年交易经验的资深交易员团队开发,     量子趋势狙击指标   旨在通过其创新的方式以极高的准确度识别趋势反转,将您的交易之旅推向新的高度。 ***购买量子趋势狙击指标,即可免费获得量子突破指标!*** 当量子突破指标识别出趋势反转时,它会向您发出警报和信号箭头,并建议您三个止盈水平。 它既适合新手交易者,也适合专业交易者。 量子 EA 通道:       点击这里 MT5版本:       点击这里 建议: 时间范围:  所有时间范围。为了获得最佳结果,我们建议在 M15、M30 和 H1 时间范围内使用它。 货币对:欧元兑美元、英镑兑美元、澳元兑美元、欧元兑英镑, EURAUD, XAUUSD 账户类型:ECN、Raw 或 Razor,点差极低 经纪时间:任意 经纪商:IC Markets、Pepperstone with Raw 和 Razor 的点差最低 建议止损:50 点 建议止盈水平:20 点、50 点和 1
ON Trade Optuma Astro
Abdullah Alrai
5 (4)
当然可以!以下是您提供的文本的中文翻译: 引入 MT4 天文指标:您的终极天体交易伙伴 您准备好将交易体验提升到天文高度了吗?不用再寻找,就在我们的革命性 MT4 天文指标中。这个创新工具超越了传统的交易指标,利用复杂的算法提供无与伦比的天文洞察力和精确计算。 指尖上的宇宙信息: 瞻仰一个详尽的面板,展示了一宝藏般的天文数据。了解行星的地理/太阳心坐标,太阳/地球距离,亮度,伸长度,星座,黄道和赤道坐标,甚至是水平坐标——每个细节都经过精心计算并呈现得美轮美奂。指标生成的垂直线对应于时间值,为您的交易旅程提供了宇宙的视角。 行星线条与关系: 在您的图表上欣赏行星线条的魔力,具有可自定义的比例和角度。通过直观的控制面板轻松切换每个行星线条的可见性。通过连结、六分、四分、三分、对冲和逆行等指标,发现行星关系的艺术。在您选择的时间范围内探索这些宇宙构造,使您能够识别重要的交易机会。 揭示甘恩的智慧: 通过受甘恩启发的平方垂直线揭示潜在的反转时机。这种创新修改将甘恩历经考验的原则带入现实,帮助您提前了解市场的转向和趋势。 月亮引导: 在您的图表上优雅地导航月相,因为新月和满月点缀其间。月亮周期
Currency Strength Exotics
Bernhard Schweigert
4.88 (33)
目前8折优惠! 对任何新手或专家交易者来说都是最好的解决方案! 这个指标是专门用来显示任何符号的货币强度,如异国货币对、商品、指数或期货。它是同类产品中的第一个,任何符号都可以添加到第9行,以显示黄金、白银、石油、DAX、US30、MXN、TRY、CNH等的真实货币强度。这是一个独特的、高质量的、负担得起的交易工具,因为我们已经纳入了一些专有的功能和一个新的公式。想象一下,你的交易将如何改善,因为你能够准确地确定新趋势或剥头皮机会的触发点? 用户手册:点击这里   https://www.mql5.com/en/blogs/post/708876 它适用于所有时间框架。你将很快能够看到TREND! 根据新的基础算法设计,它使识别和确认潜在交易变得更加容易。这是因为它以图形方式显示了8种主要货币和一种符号的强弱。 该指标显示了8种主要货币(澳元加元瑞士法郎欧元英镑日元新西兰美元)的强弱线,再加上一个符号! 该指标显示了符号的真实价值。例如:对于XAUUSD(黄金):价格以美元报价。如果黄金在上涨,你怎么能知道是黄金的强势还是美元的弱势?只有当黄金走强时,我们才会进行
ECM Channel MT4
Paulo Rocha
5 (1)
ECM Elite Channel is a volatility-based indicator, developed with a specific time algorithm, which consists of finding possible corrections in the market. This indicator shows two outer lines, an inner line (retracement line) and an arrow sign, where the channel theory is to help identify overbought and oversold conditions in the market. The market price will generally fall between the boundaries of the channel. If prices touch or move outside the channel, it's a trading opportunity. The
Indicator : RealValueIndicator Description : RealValueIndicator is a powerful tool designed specifically for trading on the EURUSD pair. This indicator analyzes all EUR and USD pairs, calculates their real currency strength values, and displays them as a single realistic value to give you a head start on price. This indicator will tell you moves before they happen if you use it right. RealValueIndicator allows you to get a quick and accurate overview of the EURUSD currency pair tops and bottoms,
Up down v6T
Guner Koca
5 (1)
Thise indicator is up down v6  comes with tradingwiev pinescript. purchased people, after installed on terminal ,contact me on mql5  to get BONUS  TradingView pinescript. up-down indicator is no repaint and works all pairs and lower than weekly time frames charts. it is suitable also 1 m charts for all pairs. and hold long way to signal. dont gives too many signals. when red histogram cross trigger line that is up signal.and price probably will down when blue histogram cross trigger line that
Introduction to X3 Chart Pattern Scanner X3 Cherart Pattern Scanner is the non-repainting and non-lagging indicator detecting X3 chart patterns including Harmonic pattern, Elliott Wave pattern, X3 patterns, and Japanese Candlestick patterns. Historical patterns match with signal patterns. Hence, you can readily develop the solid trading strategy in your chart. More importantly, this superb pattern scanner can detect the optimal pattern of its kind. In addition, you can switch on and off individu
XQ Indicator MetaTrader 4
Marzena Maria Szmit
3.67 (3)
Step into the realm of Forex trading with confidence and precision using XQ, a cutting-edge Forex indicator designed to elevate your trading game to unprecedented heights. Whether you're a seasoned trader or just stepping into the world of currency exchange,   XQ Forex Indicator   empowers you with the insights and signals needed to make informed trading decisions. The signal conditions are a combination of three indicators, and XQ Forex Indicator only display  medium and long-term trends . The
Max Paynex
Abdulkarim Karazon
Max Payne 是一个反转/趋势信号指标,以箭头的形式给出信号,该指标在同一柱收盘时给出信号,该指标可以在图表上以不同周期多次下降,以获得信号的双重/三重确认 该指标具有高度可调性,可以适应任何交易风格,同时它不会重新绘制或背面绘制,购买后您将获得屏幕截图中显示的完整系统以及使用的模板。 ----------------- 如何交易: 等到您在同一柱上获得三次确认,同时趋势过滤器(购买后您将获得的佩恩趋势)与方向一致 开仓并将止损设置为买入交易的黄金箭头(模板)下方和卖出交易的黄金箭头(模板)上方,您的退出信号是第一个相反的白点信号(模板)。 ----------------- 参数 : 信号周期:箭头周期 滤波器:信号滤波器 距离:箭头距蜡烛的距离 计数柱:显示多少历史信号 警报 --------------------------------------
Gold Channel XAUUSD
Paulo Rocha
5 (2)
Gold Channel is a volatility-based indicator, developed with a specific timing algorithm for the XAUUSD pair, which consists of finding possible corrections in the market. This indicator shows two outer lines, an inner line (retracement line) and an arrow sign, where the theory of the channel is to help identify overbought and oversold conditions in the market. The market price will generally fall between the boundaries of the channel. If prices touch or move outside the channel it is a tra
Please send me Direct message on MQL5 CHAT after purchasing the Indicator for Training and Installation Support There are some additional files that is important to use with the Indicator . So be sure to contact me after purchasing the Indicator So that I can add you for training and support . If you find any difficulty with installation then send me Direct message here So that I can connect with you via Anydesk or Teamview for the product installation. " Smart Order Block Indicator " to find
SNR LEVEL INDICATOR Accurate Snr level indicator will only display Fresh Levels that are close to the Current Market Price. This indicator is very accurate in mapping Support & resistance levels. there is an alert feature when the price TOUCHES the SNR LEVEL, WHEN CLOSE CANDLE BREAK/REJECT SNR LEVEL. INDICATOR MARKING :: - SUPPORT LEVEL == V SHAPE - RESISTANCE LEVEL == APEX LEVEL - GAP RESISTANCE & GAP SUPPORT == OPEN CLOSE CANDLE - SUPPORT BECAME RESISTANCE & RESISTANCE BECAME SUPPORT INDIC
All in One Trade
Alexey Minkov
4.48 (27)
The All-in-One Trade Indicator (AOTI) determines daily targets for EURUSD, EURJPY, GBPUSD, USDCHF, EURGBP, EURCAD, EURAUD, AUDJPY, GBPAUD, GBPCAD, GBPCHF, GBPJPY, AUDUSD, and USDJPY. All other modules work with any trading instruments. The indicator includes various features, such as Double Channel trend direction, Price channel, MA Bands, Fibo levels, Climax Bar detection, and others. The AOTI indicator is based on several trading strategies, and created to simplify market analysis. All-in-One
Blahtech Market Profile
Blahtech Limited
4.61 (18)
Was: $249  Now: $99   Market Profile defines a number of day types that can help the trader to determine market behaviour. A key feature is the Value Area, representing the range of price action where 70% of trading took place. Understanding the Value Area can give traders valuable insight into market direction and establish the higher odds trade. It is an excellent addition to any system you may be using. Blahtech Limited presents their Market Profile indicator for the MetaTrader community. Ins
Volatility Trend System - a trading system that gives signals for entries. The volatility system gives linear and point signals in the direction of the trend, as well as signals to exit it, without redrawing and delays. The trend indicator monitors the direction of the medium-term trend, shows the direction and its change. The signal indicator is based on changes in volatility and shows market entries. The indicator is equipped with several types of alerts. Can be applied to various trading
NAM Order Blocks
NAM TECH GROUP, CORP.
5 (1)
MT4多時限訂單塊檢測指示器。 特徵 -在圖表控制面板上完全可自定義,提供完整的交互。 -隨時隨地隱藏和顯示控制面板。 -在多個時間範圍內檢測OB。 -選擇要顯示的OB數量。 -不同的OB用戶界面。 -OB上的不同過濾器。 -OB接近警報。 -ADR高低線。 -通知服務(屏幕警報|推送通知)。 概括 訂單塊是一種市場行為,它指示從金融機構和銀行收取訂單。著名的金融機構和中央銀行帶動了外匯市場。因此,交易者必須知道他們在市場上正在做什麼。當市場建立訂單塊時,它會像發生大多數投資決策的範圍一樣移動。 訂單建立完成後,市場將朝著上升和縮小的方向發展。訂單大宗交易策略的關鍵術語是它包括機構交易者正在做的事情。由於它們是主要的價格驅動因素,因此包括機構交易在內的任何策略都可以。 您將在任何時間範圍內實時看到訂單塊,使用我們的控制面板,您將能夠在所選的歷史記錄週期內檢測常規,拒收和未大寫的訂單塊。 現在您可以接收到訂單塊接近警報,我們在MT4上顯示屏幕通知,並將通知推送到您的手機!
"The Squeeze indicator attempts to identify periods of consolidation in a market. In general the market is either in a period of quiet consolidation or vertical price discovery. By identifying these calm periods, we have a better opportunity of getting into trades with the potential for larger moves. Once a market enters into a "squeeze," we watch the overall market momentum to help forecast the market direction and await a release of market energy." Modified TTM Squeeze Indicator is a modifica
Entry Points Pro
Yury Orlov
4.7 (225)
这是一款 MT4 的趋势指标,可提供准确的入场交易信号,且无重绘或延迟。 它可应用在任何金融资产:外汇、加密货币、贵金属、股票、指数。 最好的结果出现在 M15+ 的时间帧内。 指标的 MT5 版本 重要! 购买后请联系我,以便获取详细指南和奖励。 视频 (6:22) - 一个信号赢取的利润等于指标价格的三倍。 视频 (4:44) - 它如何在测试器中工作,我的提示和技巧。 视频 (1:44) - 有关它如何处理加密货币和指数的几句话。 大多数交易者在 Entry Points Pro 指标的帮助下,在第一个交易周内就改善了他们的交易结果。 Entry Points Pro 指标的益处 入场信号无重绘或延迟 如果信号出现,并得到确认(如果信号所在烛条已收盘),则它不会再消失;不像是重绘指标,它会导致重大的财产损失,因为它们可以在显示信号后再将其删除。 无差错开仓 指标算法可令您找到入场交易(买入或卖出资产)的理想时机,从而提高每位交易者的成功率。 Entry Points Pro 可操作任何资产 它允许您在 MT4 平台上交易任何经纪商提供的加密货币、股票、
作者的更多信息
该脚本基于使用随机数生成器模拟贸易交易。即使使用相同的输入参数,这也可以使您获得完全不同的结果。运行脚本时,将打开一个对话框,您可以在其中设置外部变量的所需值。 在块中,TradingOptions定义了模拟交易所需的基本参数。 StartBalance  - 设置交易余额的初始大小。 NumberTrade  - 设置脚本运行时将建模的交易事务数。为了获得或多或少的显着结果,该参数必须大于30。 ProbabilityWinning  - 获胜交易的概率。表示为百分比,有效值为1到99。 Min.StopLoss  - 表示以点为单位的最小StopLoss值,将在建模交易操作时使用。 Max.StopLoss  - 以磅为单位设置StopLoss的最大值。 PositiveWin。 - 该变量建立修正,借助于该修正在模拟交易中获得积极的期望。 脚本的工作是执行以下操作。首先,计算获胜交易的预期概率 -  PW。之后,随机设置StopLoss的值,该值将在此事务中使用。考虑到预期收益应为正数,计算TakeProfit规模。考虑到点值,TakeProfit和StopLoss水平将转换为
FREE
MinDeposit MT5
Aleksej Poljakov
3 (1)
The script analyzes the history of quotes and gives recommendations on the minimum deposit. The calculations take into account the variability of prices and the standard deviation. Margin requirements for the instrument are also taken into account. The result of the script is the minimum recommended deposit for trading the given currency pair.
FREE
该脚本的设计使交易者可以确定交易交易的平均持续时间,在此期间可能的利润和损失的比率将是最佳的。 首先,让我们看一下确定贸易交易最佳持续时间的一般方法。我们介绍以下变量: R - 交易的结果; T - 交易开放的时间; W - 上一笔交易结束与下一交易开盘之间的时间。 每个交易者都努力在最短的时间内获得最大的利润。这种愿望可以通过以下简单表达来描述: R/(T+W)→max 。 很明显,变量 T 和 W 取决于交易的总持续时间和交易数量。设 ATD 是交易的平均持续时间, N 是交易总数。然后,交易的平均持续时间应与其总数的平方根成比例增长,即: ATD~√N 。 但是,有一些有根据的问题出现 - 任何交易持续时间等同于其他交易持续时间,交易持续时间如何影响交易操作的结果?为了得到所提问题的答案,我们将对历史数据的价格行为进行一项小型研究。 我们继续如下。我们将历史数据划分为由一定数量的柱组成的系列,对应于交易的平均持续时间。在每个这样的系列中,我们计算最大价格变动,我们将引用更大的偏差 StopLoss ,并且更小 - 到 TakeProfit 。 之后,我们将计算整个历史中价格范围的
FREE
This script allows selecting the TakeProfit and StopLoss levels. It analyzes the history data, and then calculates the probability of reaching a given price level. How the script works Suppose you have a trading strategy and you want to select the TakeProfit and StopLoss levels. Run the script and set the parameter: Number of Bars - the average position holding time in bars. Once the script operation is complete, the AIS-PPL.csv file will be created in the Files folder in the terminal data cat
FREE
选择StopLoss和TakeProfit的水平会对交易的整体表现产生非常强烈的影响。除了交易交易的明显参数 - 可能获胜或可能亏损的大小 - 止损和止盈的水平也会影响交易的预期持续时间以及一般交易的盈利能力。 如果您已使用“ AIS-ODT ”脚本确定了最佳事务持续时间,则可以开始确定与StopLoss和TakeProfit级别关联的参数。 为此,我们按以下步骤操作。首先,我们将确定在一个方向或另一个方向上的所有可能的价格偏差,并计算在一定时间内实现它们的概率。之后,您可以根据其大小,概率和预期利润值计算StopLoss和TakeProfit的最佳水平。 为此,请在感兴趣的货币对的图表和所需的时间范围内运行脚本。使用属性窗口中的ILB参数,设置交易仓位的期望持续时间,以柱数表示。在实用程序的工作期间,分析整个历史记录的数据,并选择最佳值。在脚本结束时,形成了两个文件 - “Buy.csv”和“Sell.csv”,其中包含获得结果的表 - 图1。 在表格的第一列中,指示了可能的TakeProfit大小,在第二列中,指示了最佳的StopLoss大小。第三列显示以百分比表示获胜这些参数的概
FREE
该脚本基于使用随机数生成器模拟贸易交易。即使使用相同的输入参数,这也可以使您获得完全不同的结果。运行脚本时,将打开一个对话框,您可以在其中设置外部变量的所需值。 在块中,TradingOptions定义了模拟交易所需的基本参数。 StartBalance  - 设置交易余额的初始大小。 NumberTrade  - 设置脚本运行时将建模的交易事务数。为了获得或多或少的显着结果,该参数必须大于30。 ProbabilityWinning  - 获胜交易的概率。表示为百分比,有效值为1到99。 Min.StopLoss  - 表示以点为单位的最小StopLoss值,将在建模交易操作时使用。 Max.StopLoss  - 以磅为单位设置StopLoss的最大值。 PositiveWin。 - 该变量建立修正,借助于该修正在模拟交易中获得积极的期望。 脚本的工作是执行以下操作。首先,计算获胜交易的预期概率 -  PW。之后,随机设置StopLoss的值,该值将在此事务中使用。考虑到预期收益应为正数,计算TakeProfit规模。考虑到点值,TakeProfit和StopLoss水平将转换为
FREE
该脚本的设计使交易者可以确定交易交易的平均持续时间,在此期间可能的利润和损失的比率将是最佳的。 首先,让我们看一下确定贸易交易最佳持续时间的一般方法。我们介绍以下变量: R  - 交易的结果; T  - 交易开放的时间; W  - 上一笔交易结束与下一交易开盘之间的时间。 每个交易者都努力在最短的时间内获得最大的利润。这种愿望可以通过以下简单表达来描述: R/(T+W)→max 。 很明显,变量  T  和  W  取决于交易的总持续时间和交易数量。设  ATD  是交易的平均持续时间, N  是交易总数。然后,交易的平均持续时间应与其总数的平方根成比例增长,即: ATD~√N 。 但是,有一些有根据的问题出现 - 任何交易持续时间等同于其他交易持续时间,交易持续时间如何影响交易操作的结果?为了得到所提问题的答案,我们将对历史数据的价格行为进行一项小型研究。 我们继续如下。我们将历史数据划分为由一定数量的柱组成的系列,对应于交易的平均持续时间。在每个这样的系列中,我们计算最大价格变动,我们将引用更大的偏差  StopLoss ,并且更小 - 到 TakeProfit 。 之后,我们将计
FREE
MinDeposit
Aleksej Poljakov
5 (1)
The script analyzes the history of quotes and gives recommendations on the minimum deposit. The calculations take into account the variability of prices and the standard deviation. Margin requirements for the instrument are also taken into account. The result of the script is the minimum recommended deposit for trading the given currency pair.
FREE
The script allows selecting the required 'Filter level' value of the AIS-MTF MT5 indicator. Run the script on the required chart and selected timeframe. Once its operation is complete, the HPS.csv file will be created in the Files folder. Open the file. You will see three columns. The 'Filter lvl' column represents the value of the 'Filter level' for the AIS-MTF indicator. Am. dev. - degree and direction of the indicator's deviation from the price level (sorted in ascending order). Negative valu
FREE
选择StopLoss和TakeProfit的水平会对交易的整体表现产生非常强烈的影响。除了交易交易的明显参数 - 可能获胜或可能亏损的大小 - 止损和止盈的水平也会影响交易的预期持续时间以及一般交易的盈利能力。 如果您已使用“ AIS-ODT ”脚本确定了最佳事务持续时间,则可以开始确定与StopLoss和TakeProfit级别关联的参数。 为此,我们按以下步骤操作。首先,我们将确定在一个方向或另一个方向上的所有可能的价格偏差,并计算在一定时间内实现它们的概率。之后,您可以根据其大小,概率和预期利润值计算StopLoss和TakeProfit的最佳水平。 为此,请在感兴趣的货币对的图表和所需的时间范围内运行脚本。使用属性窗口中的ILB参数,设置交易仓位的期望持续时间,以柱数表示。在实用程序的工作期间,分析整个历史记录的数据,并选择最佳值。在脚本结束时,形成了两个文件 - “Buy.csv”和“Sell.csv”,其中包含获得结果的表 - 图1。 在表格的第一列中,指示了可能的TakeProfit大小,在第二列中,指示了最佳的StopLoss大小。第三列显示以百分比表示获胜这些参数的概
FREE
This script allows selecting the TakeProfit and StopLoss levels. It analyzes the history data, and then calculates the probability of reaching a given price level. How the script works Suppose you have a trading strategy and you want to select the TakeProfit and StopLoss levels. Run the script and set the parameter: Number of Bars - the average position holding time in bars. Once the script operation is complete, the AIS-PPL.csv file will be created in the Files folder in the terminal data cat
FREE
AIS 正确平均线指标允许您设置市场趋势运动的开始。该指标的另一个重要品质是趋势结束的明确信号。指标不会重新绘制或重新计算。 显示值 h_AE - AE 通道的上限 l_AE - AE通道的下限 h_EC - 当前柱的高预测值 l_EC - 当前柱的低预测值 使用指标时的信号 主要信号是通道AE和EC的交点。 当 l_EC 线高于 h_AE 线时,可能会开始上升趋势。 在 h_EC 线低于 l_AE 线之后,可以预期下降趋势的开始。 在这种情况下,应注意 h_AE 和 l_AE 线之间的通道宽度。它们之间的差异越大,趋势就越强。您还应该注意 AE 通道实现的局部高点/低点。这时,价格变化的趋势变得最强。 可定制的指标参数 设置指标包括根据时间范围选择 LRH 参数。此参数的有效值范围为 1 到 350。 此参数越小,指标越敏感,错误信号的增加可能。另一方面,此参数不应设置得太高,因为指标会变得不那么敏感并会跳过信号。
AIS Weighted_Moving_Average 指标计算加权移动平均线,并允许您确定趋势市场运动的开始。 权重系数的计算考虑了每个柱的具体特征。这使您可以过滤掉随机的市场走势。 确认趋势开始的主要信号是指标线方向的变化和穿过指标线的价格。 WH(蓝线)是高价的加权平均值。 WL(红线)是最低价的加权平均值。 WS(绿线)是所有价格点的加权平均值。 选项 LH - 计算值的柱数。 要快速选择 LH,您首先需要检查是较高时间范围的倍数的值。 例如,指标设置为 M15。 然后我们检查以下LH的值 周期 M30/M15 = 2 期间 H1/M15 = 4 期间 H4/M15 = 16 周期 D1/M15 = 96 周期 W1/M15 = 480 它们之间的值也可能是有趣的。
AIS Advanced Grade Feasibility 指标旨在预测未来价格可能达到的水平。他的工作是分析最后三个柱形图并在此基础上进行预测。该指标可用于任何时间范围和任何货币对。在设置的帮助下,您可以达到预期的预测质量。 预测深度 - 以条形图设置所需的预测深度。建议在 18-31 内选择此参数。 你可以超越这些限制。但在这种情况下,预测水平的“固定”是可能的(对于小于 18 的值),或者水平宽度过大(对于大于 31 的值)。 置信水平 1、置信水平 2 和置信水平 3 - 预测置信水平。可在 1-99 范围内设置。置信度 1 应该大于置信度 2,置信度 3 应该是最小的。 这些水平中的每一个都显示价格将达到此值的概率百分比,该值由预测深度参数确定的柱线数量决定。 Color lvl high 和 Color lvl low - 允许您选择线条的颜色 Style lvl - 允许您选择与级别对应的线条样式 宽度 lvl - 设置与级别对应的线的宽度
The indicator is designed to measure the price volatility. This allows determining the moments for opening or closing trade positions more accurately. High intensity of the market indicates the instability of its movement, but allows for better results. And, conversely, low intensity of the market indicates the stability of its movement. Parameters Bars to process - the number of bars to measure the price movements. A low value of this parameter allows determining the moments of rapid price mo
This indicator uses the Fibonacci p-numbers to smooth a price series. This allows combining the advantages of the simple and exponential moving averages. The smoothing coefficients depend on the level of the p-number, which is set in the indicator parameters. The higher the level, the greater the influence of the simple moving average and the less significant the exponential moving average. Parameters Fibonacci Numbers Order - order of the Fibonacci p-number, specified by trader. Valid values
The indicator is based on the analysis of interaction of two filters. The first filter is the popular Moving Average. It helps to identify linear price movements and to smooth minor price fluctuations. The second filter is the Sliding Median. It is a non-linear filter. It allows to filter out noise and single spikes in the price movement. A predictive filter implemented in this indicator is based on the difference between these filters. The indicator is trained during operation and is therefore
This indicator studies the price action as a combination of micro-trends. All micro-trends are analyzed and averaged. Price movement is filtered based on this averaging. IP_High and IP_Low (blue and red dashed lines) show the instantaneous price movement. They display the forecast only for the current price values, taking into account only the number of bars defined by the 'Filter level' parameter. SP_High and SP_Low (blue and red solid lines) smooth the price movements with respect to history.
The script allows selecting the required 'Filter level' value of the AIS-MTF indicator. Run the script on the required chart and selected timeframe. Once its operation is complete, the HPS.csv file will be created in the Files folder. Open the file. You will see three columns. The 'Filter lvl' column represents the value of the 'Filter level' for the AIS-MTF indicator. Am. dev. - degree and direction of the indicator's deviation from the price level (sorted in ascending order). Negative values i
FREE
This indicator implements the process of simple linear smoothing. One of the disadvantages of exponential smoothing is the rapid attenuation of the signal. This does not allow for a full-fledged monitoring of long-term tendency of a price series. Linear smoothing allows fine-tuning the signal filtering. The indicator is configured by selecting the parameters: LP - period of smoothing. The higher the value, the more long-term tendencies are displayed by the indicator. Valid values are from 0 to 2
该指标是基于中值和移动平均特性的组合的顺序混合滤波器。 使用中值允许滤除价格序列值中的异常异常值和随机脉冲。同时,中值滤波器不会对价格变动的趋势起作用,而是保持不变。 由于中值滤波器是非线性的,因此使用简单移动平均值进行平均来平滑其值。这种方法使我们不仅可以更准确地识别趋势,还可以更准确地识别价格变动中的周期性成分。此外,它还增加了指标对价格变化的敏感度,并减少了价格序列与指标读数之间的延迟。因此,指标可以相当准确地警告新趋势的开始,以及旧趋势的结束。 您可以使用 FL 参数调整滤波器的深度及其灵敏度。其允许值为0到63.同时, 2 * FL + 1 条用于计算指标值。因此,FL值越大,指标显示价格图表的趋势越强。
该指标是两个改进的Lanczos滤波器的组合。 第一个过滤器用于推断价格。根据过去的价值,他预测当前柱内可能的价格变动。也就是说,它表明如果过去的趋势保持不变,价格会是多少。 第二个过滤器,用于平滑和平均窗口内的价格,由过滤器的级别决定。由于选择了权重,此过滤器最积极地响应价格变动中存在的周期性组件。 可以使用EF和IF参数调整指标。通过选择 EF 和 IF 的值,您可以获得有关趋势价格变动开始的信号。 EF   - 指数滤波器的窗口大小。有效值为 EF = 0 ... 255 。并且在计算期间处理的条数是 2 * EF + 1 。该参数越大,价格序列的过去价值的影响越大。结果以实线绘制。 IF   - 调整平均窗口的大小。 IF = 0 ... 255 的值。要计算的条数是 2 * IF + 1 。 IF 值越大,使用此过滤器检测到价格变动的较长时段。结果以虚线显示在图表上。
让我们看一下外汇市场价格变化的本质,而不是关注这些变化发生的原因。这种方法将使我们能够确定影响价格变动的主要因素。 例如,让我们看一下欧元兑美元货币对和H1时间框架的开盘价。对于这些价格,我们构建了Lameray图(图1)。 在该图中,可以看出价格变动基本上根据线性方程发生。要确定此等式的参数,可以使用最小二乘法。在这个特定的例子中,改变开盘价的等式采用以下形式: Open [i] = 0.99989 * Open [i + 1] +0.00013。 让我们来看看这个等式如何充分描述价格变动。为此,我们删除线性分量并分析残差(图2)。 从图中可以清楚地看出,这些残留物相当混乱,如果我们将它们视为噪声,我们可以得到一个相当简单的系统来预测下一个柱的开盘价,这是以该指标的形式实现的。
该指标更具信息量。他的工作基于这样的假设,即市场中的价格变动可以表示为特定颜色的噪声,这取决于价格值分布的参数。由此,可以从不同角度分析价格变化,并将价格变动视为特定颜色的噪声,可以获得有关市场当前状态的信息并对价格行为进行预测。 在分析指标读数时,会考虑指标线的位置 - 它们位于当前柱的开盘价的上方或下方以及距离它的距离。 白噪声(白噪声) - 这种方法的特点是价格(当前和史前)被认为功率相等,这与简单的移动平均值相结合。白噪声信号更有可能证实这一特征 - 它越偏离当前价格,市场中的趋势运动就越强烈。相反,如果白噪声线接近开盘价,那么这就是趋势结束或横向价格变动的证据。 闪烁噪声(闪烁噪声)概述了趋势的上边界或下边界(取决于线是否高于或低于价格)。此外,这种噪音线与货币对价格的交叉点可以作为新趋势开始的证据,甚至是短期趋势的开始。 布朗噪声在很多方面的行为类似于指数平滑。因此,噪声线跟随价格,只有市场突然和突然的变化才有可能出现大的偏差。 蓝噪声显示趋势对当前趋势的强烈程度。由于蓝色噪声线与当前价格存在较大偏差,我们可以说趋势已经耗尽其力量并接近完成。 紫色噪音表明周期性或周期性价
尽管“ AIS Color Noise Filter ”指示器存在一些缺点,但使用它来平滑价格序列和预测价格的想法看起来非常有吸引力。 这是由于以下几个原因: 首先,考虑到几个噪声成分,可以建立相互独立的因素预测,从而提高预测质量; 其次,价格序列的噪声特征在整个历史中表现得相当稳定,从而可以获得稳定的结果; 最后,噪声变化使我们希望预测系统非常敏感,并且它对价格变化的反应将非常快。 因此,我们得到一个指标,尽管有所有简化,但能够准确预测价格将会移动的渠道。该指标的主要优点是速度快,易于学习。主要缺点是指标无法选择最重要的预测因素。 LH 是一个参数,用于设置进行预测的历史数据的长度。其允许值为0  -  255,而指标处理的柱数超过此参数指定的单位数。
很多时候,在金融系列的研究中应用他们的平滑。使用平滑,您可以删除高频成分 - 据信它们是由随机因素引起的,因此无关紧要。平滑总是包括一些平均数据的方法,其中时间序列中的随机变化相互吸收。大多数情况下,为此目的,使用简单或加权移动平均方法,以及指数平滑。 这些方法中的每一种都有其优点和缺点。因此,简单的移动平均值简单直观,但其应用需要时间序列的周期和趋势分量的相对稳定性。另外,信号延迟是移动平均值的特征。指数平滑方法没有滞后效应。但即使在这里也存在缺陷 - 只有在将系列与随机异常值对齐时,指数平滑才有效。 简单和指数平均值之间的合理折衷是使用加权移动平均线。但是,存在选择特定重量值的问题。让我们一起尝试解决这个问题。 因此,首先要定义我们希望从平滑过程中实现的目标: •首先,我们需要从价格序列中删除随机变化和噪音; •其次,我们希望识别异常排放和异常价格行为,这些行为也可用于贸易; •最后,平均程序应确定市场中存在的可持续趋势。 当然,我们希望平滑程序适应当前的市场情况。 为了获得理想的结果,我们将根据此价格水平与研究期间的最高和最低价格之间的差异来计算权重。通过这种方法,我们得到一个
为了隔离长期和非随机组件,不仅要知道价格变化了多少,还要知道这些变化是如何发生的。换句话说 - 我们不仅对价格水平的价值感兴趣,而且对这些水平相互替代的顺序感兴趣。通过这种方法,人们可以找到影响(或可能影响)特定时间点价格变化的长期和稳定因素。了解这些因素可以让您做出或多或少准确的预测。 让我们确定我们希望从财务系列的分析中得到什么具体结果: •首先,我们需要强调这一趋势,如果它存在于市场中; •其次,我们需要确定周期性成分; •第三,结果应足够稳定,可用于预测; •最后,我们的分析方法应该适应当前的市场形势。 为了满足指定的条件,我们使用相对价格变化的回归分析,并基于该模型做出指标。该指标的算法基于对历史数据的学习,其工作在交易者的完全控制之下。 LH 是一个参数,用于确定用于平滑金融系列的柱数。其允许值介于0到255之间。 UTS 是影响学习速度和深度的参数。它的值也在0到255之间。如果UTS的值为零,则在整个历史记录中进行学习。在所有其他情况下,训练集会不时更新。更新越频繁,UTS值越小。 该指标的主要缺点是,当平滑金融系列被认为是静止时,这可能会导致一些延迟。
其中一种强大的分析方法是使用Levy流程对财务系列进行建模。这些过程的主要优点是它们可用于模拟大量现象 - 从最简单到最复杂。我只想说市场中分形价格变动的想法只是Levy过程的一个特例。另一方面,通过适当选择参数,任何Levy过程都可以表示为简单的移动平均值。图1显示了一个Levy过程的示例,其中片段放大了几次。 让我们考虑使用Levy流程来平滑价格图表的可能性。首先,您需要选择Levy过程的参数,以便它可以用于模拟线性过程。然后我们得到一个权重系统,其中包括不同符号的系数。有了这个,我们不仅可以平滑金融范围,还可以跟踪其中存在的反趋势和周期性成分。 通过选择参数 LF 来配置指示器的操作。它决定了故事的深度,并将对其进行分析。此参数的允许值位于0  -  255之间。用于计算的条形数将比此数字多两个。 蓝线表示高价平滑的结果,绿线表示收盘价,红线表示低价。 该指标的主要缺点是根据严格定义的算法执行抗锯齿,该算法没有考虑市场中的急剧和强烈变化。此外,与所有平滑指标一样,存在可以达到简单移动平均值的滞后。
AIS Channel Price
Aleksej Poljakov
通常,交易者面临着确定价格在不久的将来可能发生变化的程度的任务。为此,您可以使用Johnson分发类型SB。这种分布的主要优点是即使只有少量的累积数据也可以使用它。用于确定此分布参数的经验方法允许您准确地确定价格通道的最大和最小水平。 这些值可用于不同的情况。例如,它们可用于设置市场订单的止损和止盈水平,或挂单的入场点。此外,使用追踪止损时可以定向这些水平。此外,在历史足够大的情况下,指标可能预示着上升趋势或下降趋势的开始。嗯,或者说它的结束,如果这样的趋势是。 该指标的主要缺点是对价格排放的敏感度极高,以及对市场形势变化的反应较迟。 蓝色和红色线分别显示价格通道的最大值和最小值。绿线表示在给定市场情况下价格的均衡值。 使用 LB 参数配置指标。此参数确定将在计算中使用的柱数,其允许值在2-64之间。
此指标可让您确定价格达到一个或另一个级别的可能性。它的算法非常简单,并且基于对特定货币对的价格水平的统计数据的使用。由于收集的历史数据,可以确定价格在当前柱形期间的变化程度。 尽管简单,但该指标可以为交易提供宝贵的帮助。因此,在其帮助下,可以确定交易头寸的TakeProfit和StopLoss水平。它可以帮助确定挂单的价格和确定TrailingStop的价格水平。 此外,该指标可以纳入现有战略。例如,您使用某种日内策略。然后,通过在D1时间框架上设置此指标,您可以在克服已经不希望开启新交易头寸之后获得水平。 该指标的主要缺点是它完全依赖于历史数据,并且不会以任何方式对某些当前的市场变化作出反应。 通过选择输入参数-L1 ... L4来执行该指标的设置 - 每个输入参数确定从每个柱的开盘价达到价格价格的概率。每个参数的值必须在99 ... 0之内,并且以下每个参数必须严格小于前一个参数。 尼古拉·尼古拉耶维奇(Nikolai Nikolaevich)是创造这个指标的意识形态灵感,如果你喜欢这个指标,那就写下几句话,我会告诉他。
筛选:
无评论
回复评论