Mt5 Camarilla Pivots
- 指标
- Francis Dube
- 版本: 1.3
- 更新: 17 七月 2020
- 激活: 20
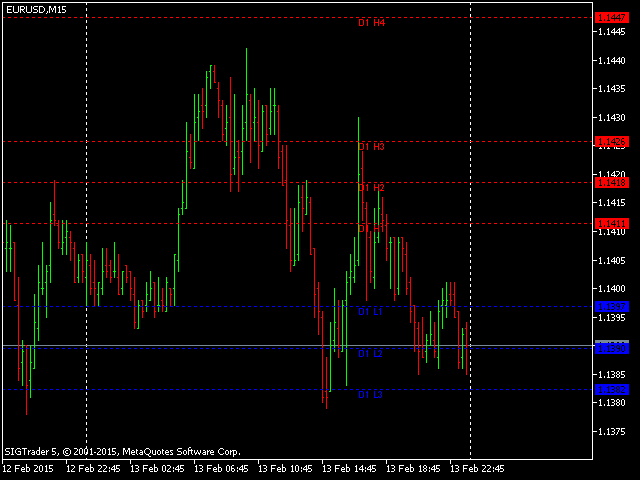
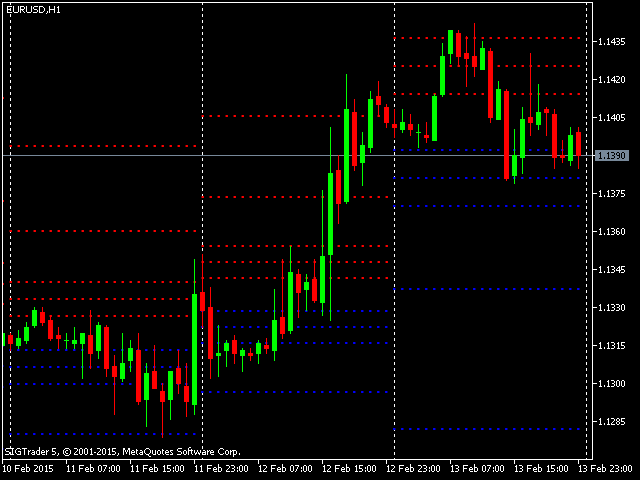
The Camarilla Pivots indicator is fully configurable and can be adjusted to work in different ways. If you are a manual trader and prefer a clean chart, you can configure the indicator so that it only draws camarilla pivot points for the current session. Otherwise if you are developing an expert advisor that uses pivot points, you can configure the indicator to show historical camarilla pivots as well.
Another unique feature of this indicator is that, when calculating daily camarilla pivots, it is possible to set a custom start time for the day. Instead of calculating pivots using the usual 00:00 to 23:59 time period , you can set a custom start time for the day. For example if you choose a start time of 17:00 the indicator will calculate the pivots by regarding the bar at 17:00 as the open time of the daily session and bar at 16:59 (the next day) as the closing bar of the day.
It is also possible to choose whether to display historical camarilla pivot point values in the data window.
Indicator input parameters:
- ctimeframe - sets the time frame from which the camarilla pivot points will be calculated.
- ShowValuesInDataWindow - either set to true or false, this parameter sets whether to show the camarilla pivot values in the data window.
- UseCustomStartTime - (true/false) please note that this feature only works when SetTimeFrame is set to the daily time frame.
- StartTime - input the custom start time in the format shown, i.e. hh:mm, of course this parameter has effect only if the UseCustomStartTime value is set to true.
- ShowHistoricalIndicatorValuesOnChart - (YES/NO) this parameter is for choosing whether to draw historial pivots values on the chart. In order to display pivots for the current session only set this value to NO.
- scolor - set color for all support levels.
- rcolor - set color for all resistance levels.











用户没有留下任何评级信息