PZ Mean Reversion MT5
- 指标
- PZ TRADING SLU
- 版本: 3.0
- 更新: 19 七月 2024
- 激活: 20
采用专业和量化方法进行均值回归交易的独特指标。它利用了价格以可预测和可衡量的方式转移并返回均值这一事实,这允许明确的进入和退出规则大大优于非量化交易策略。
[ Installation Guide | Update Guide | Troubleshooting | FAQ | All Products ]
- 清晰的交易信号
- 非常容易交易
- 可定制的颜色和尺寸
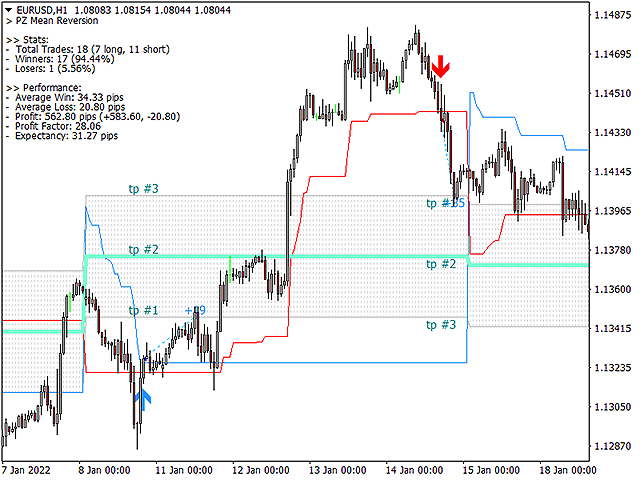
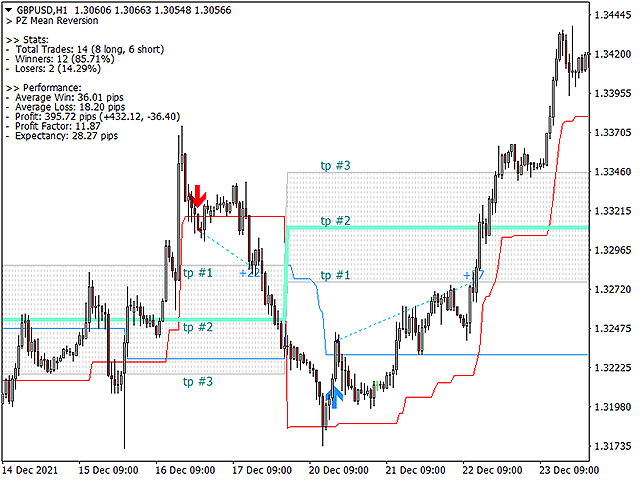
- 实现性能统计
- 优于大多数交易策略
- 显示合适的止损和止盈水平
- 它实现了电子邮件/声音/视觉警报
这个怎么运作
该指标从更高的时间范围测量完全可定制的移动平均线的标准偏差,并使用趋势跟踪方法精确地找到交易。交易是通过深入当前图表的价格行为发现的,并在价格返回到平均价格区间时关闭,根据您选择的更高时间范围计算。由于其编码方式,该指标将远离高波动性和强劲趋势市场,并且仅在可预测的情况下进行交易,在可接受的波动性与方向性比率范围内,回归均值是可行的。
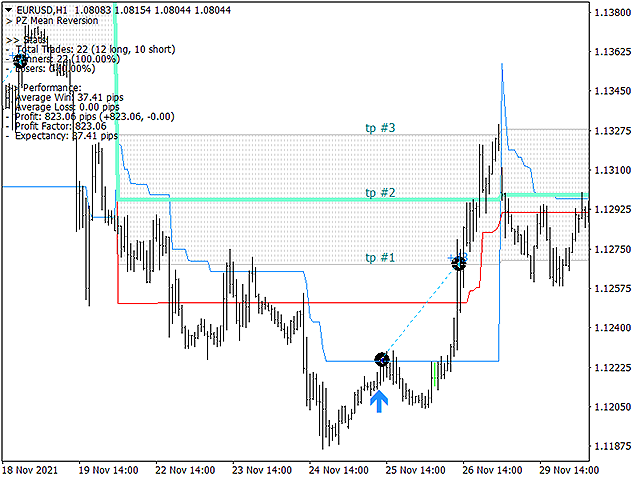
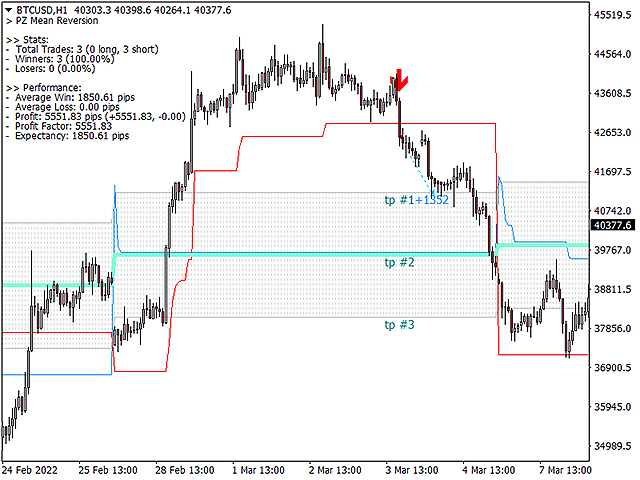
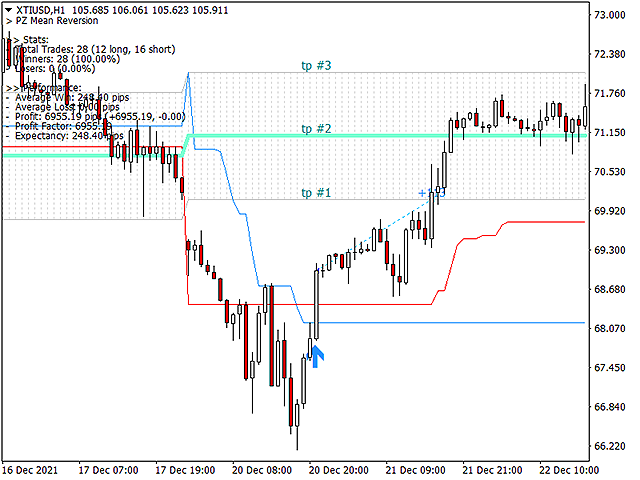
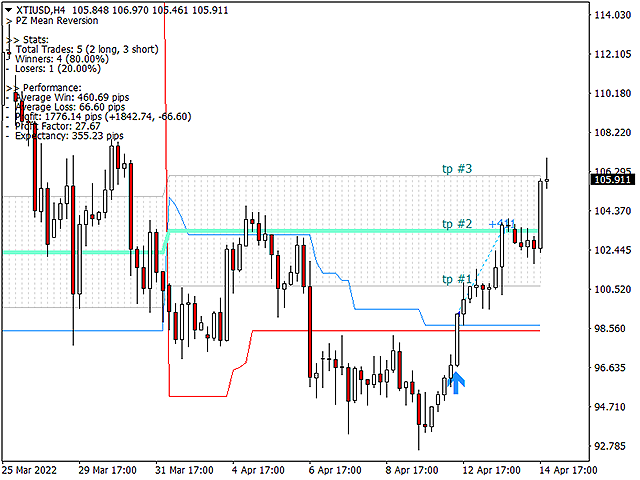
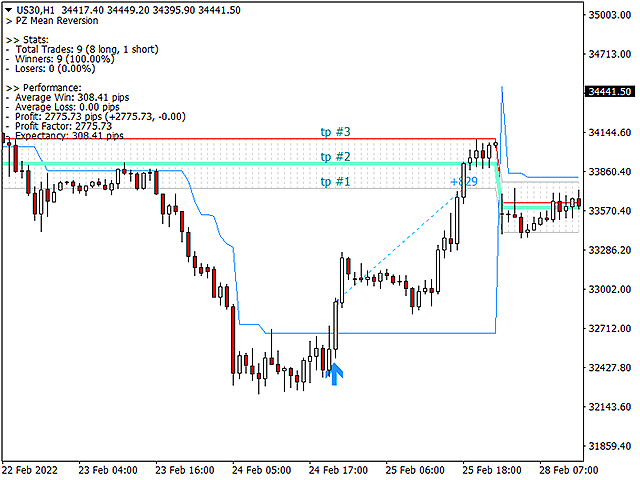
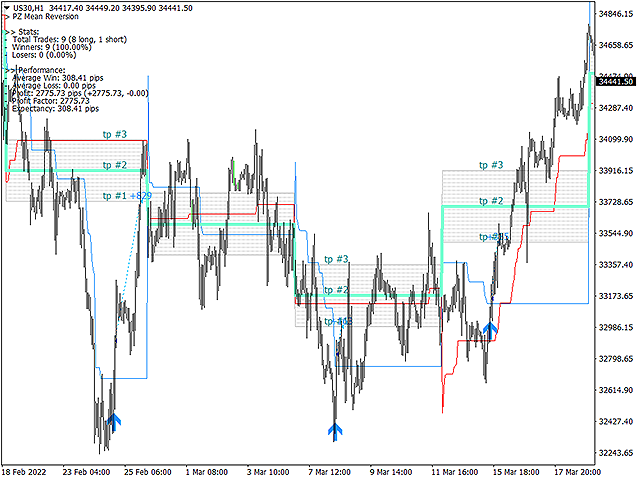
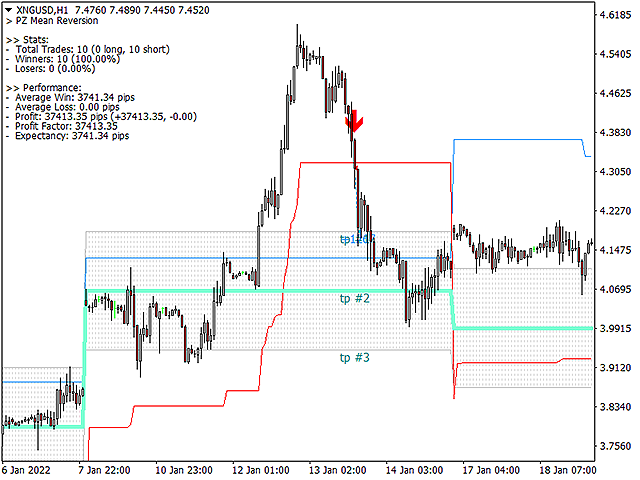
指标剖析
- 绿线是更高时间范围内的移动平均线(也就是平均值)
- 虚线区域是移动平均线周围的典型价格区间
- 蓝线是看涨交易的突破价格
- 红线是看跌交易的突破价格
交易是针对均值进行的,并在典型的价格区间内收盘。
交易什么
几乎所有市场都在发生均值回归。
- 外汇对
- 股票指数
- 贵金属
- 商品
- 加密货币
- 债券
推荐的时间范围
- H4 与 MN1 移动平均线
- H1 与 W1 移动平均线
- M15 与 D1 移动平均线
- M1 与 H4 移动平均线
输入参数
有关指标的所有输入参数的详细说明, 请单击此处。
作者
Arturo López Pérez,私人投资者和投机者、软件工程师和 PZ Trading Solutions 的创始人。 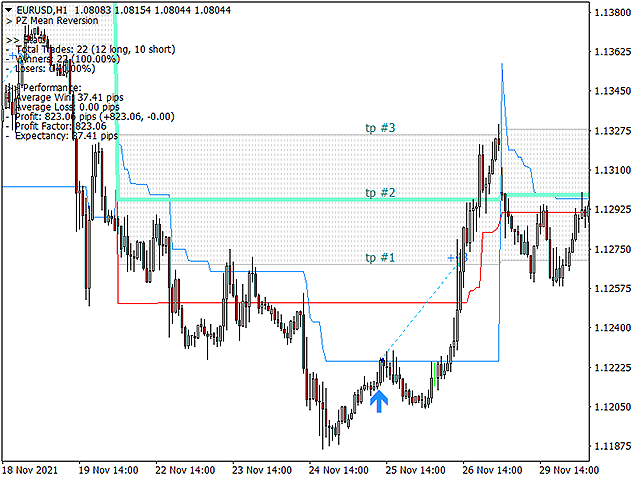

All in one indicator, with this indicator I know where the entry, where the TP and SL. The price exactly respect the line and mean area.. Good indicator, I love it..
The Bug was not a problem anymore when I switch my VPS from using Windows 7 OS to Windows 10 OS, it's fine now..