KT Aroon MT4
- 指标
- KEENBASE SOFTWARE SOLUTIONS
- 版本: 1.0
- 激活: 5
KT Aroon oscillator is the modified version of the original Aroon oscillator initially developed by Tushar Chande in 1995. It measures the time interval between the ongoing highs and lows and uses this deduction to calculate the market trend's direction and strength.
It works on the notion that the price will form new highs consecutively during an uptrend, and during a downtrend, new lows will be formed.
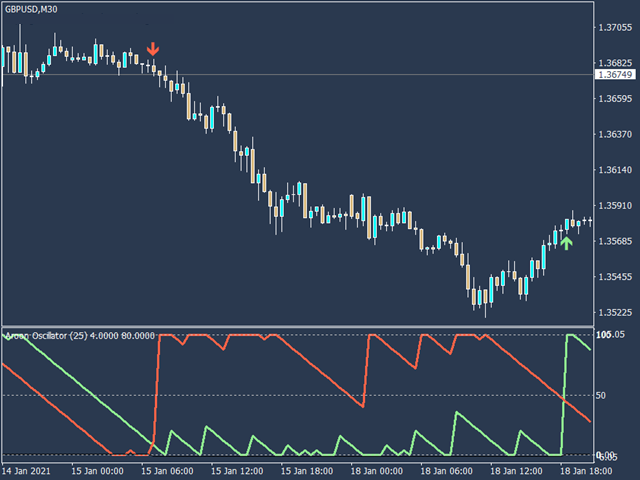
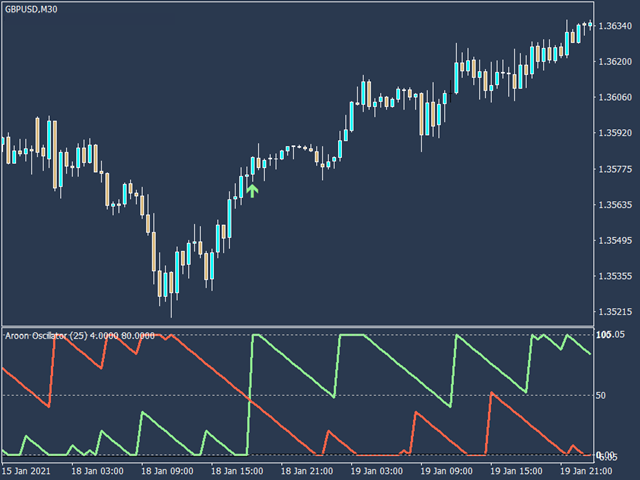
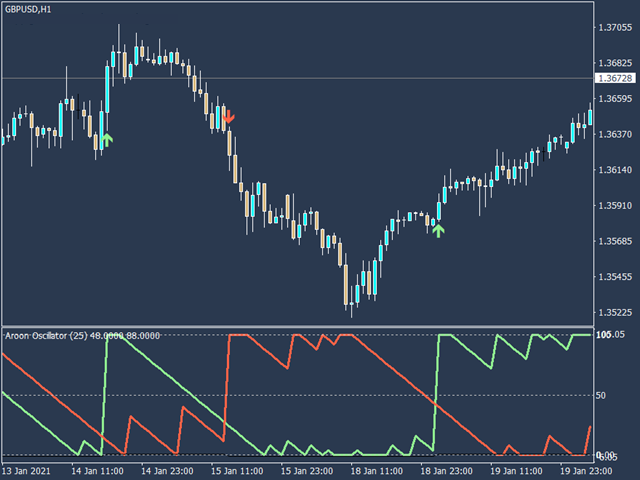
Buy Signal: When Aroon Up line cross above the Aroon Down line.
Sell Signal: When Aroon Down line cross above the Aroon Up line.
Features
- It is equipped with Up/Down arrows, which mark the Aroon signals on the price chart.
- Shows the market trend efficiently.
- Simple illustration without any clutter on the chart.
- All Metatrader alerts are available.
Inputs
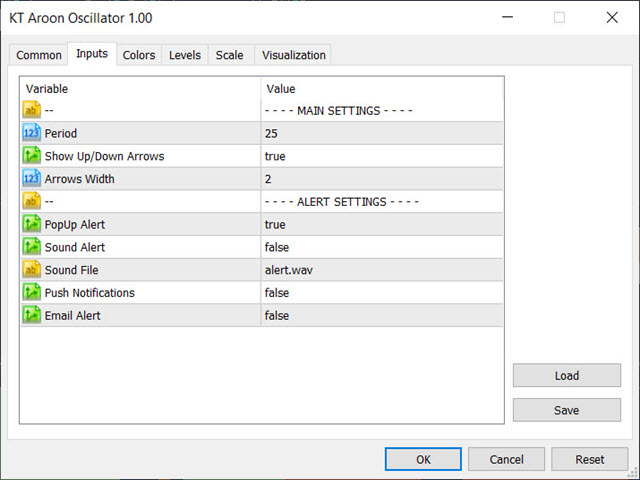
- Period: The period to calculate the Aroon Up and Down line.
- Show Up/Down Arrows: If set to True, it will place the Up and Down Arrows on the price chart for each new signal.
- Alert Settings: Configure the various alerts like Popup, Sound, Mobile notifications, and Emails.
More about the Aroon
Aroon oscillator is quite different from other popular oscillators because it comprehends time with the asset's price. On a Daily Timeframe, you can interpret the Aroon oscillator like:
Aroon Up: The Aroon Up signal measures the number of days that have passed since the 25-day high.
Aroon Down: The Aroon Down signal measures the number of days that have passed since the 25-day low.
Formula
Aroon-Up = ((P - Days Since P-day High)/P) x 100
Aroon-Down = ((P - Days Since P-day Low)/P) x 100
Where P is the Period chosen by the user. By default, P is set to 25.
Advantages
- Shows the new emerging market trend remarkably.
- It can also show the interval of consolidation. If the Aroon lines are below 50 or moving parallel, there could be indecision among the traders.
- Aroon lines crossover (Up and Down Arrows) can be used as new signals.












用户没有留下任何评级信息