• 概述
  • 评论 (10)
  • 评论 (42)
  • 新特性

News impact

4.67

Choose the best trading tool: The impact of news on the exchange rate of a currency pair!

As a news source you can use: Terminal calendar or Investing.com website

In the second case, you will additionally need the Get News5 utility.

The indicator combines well with the Trade maker utility, providing multi-currency trading.

Calculates:

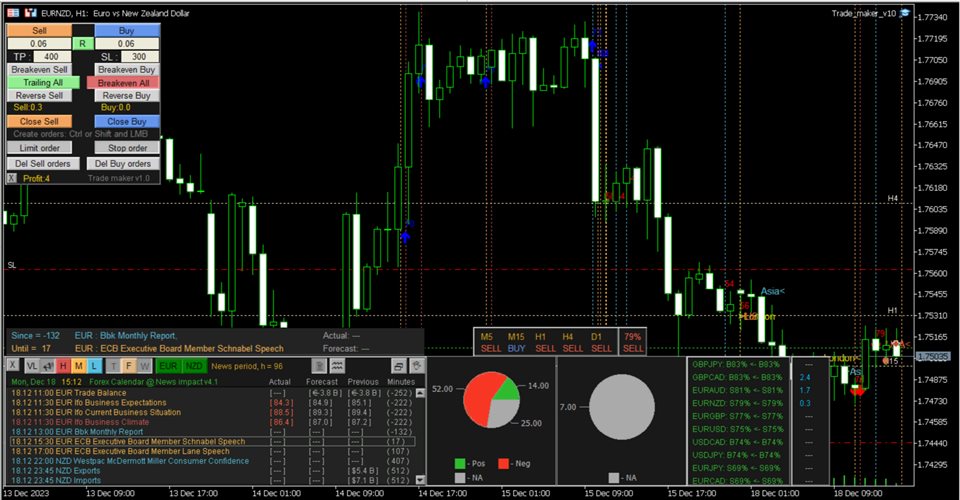
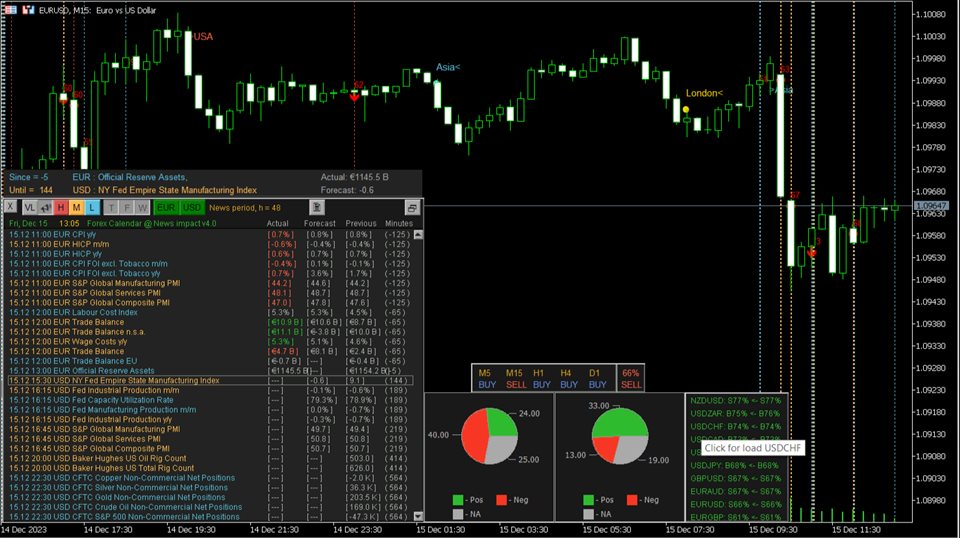
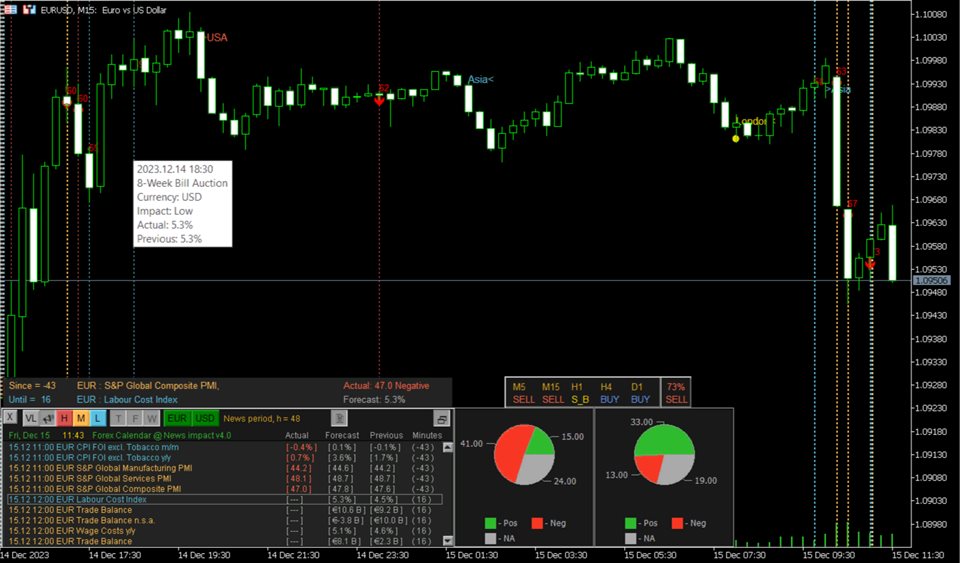
  • indices of the impact of current news on currency pairs, taking into account market expectations.
  • actual trend directions for 5 customizable timeframes and levels of change in trend direction
  • time elapsed since the publication of the next news and time remaining until the next one is published
  • writes a file with a news table in CSV format for the specified date interval
Current news values are analyzed based on their impact on the currency to which they relate.
The published current value of the news has a characteristic impact on the currency it relates to: positive, negative, neutral . The indicator summarizes all these values for the selected period, taking into account the importance of the news: high, medium, low and displays it on a graph in the form of a pie chart.

This allows you to make a forecast of exchange rate movement if one symbol has more positive news and the other has more negative news.

Uses the built-in news calendar of the MT5 terminal and does not require additional settings.

The indicator selects news based on the chart symbol or the specified value of the Currency pair news parameter, plus displays analysis on 16 pairs.

The Low, Medium, High buttons set the news filter by importance.

The Now, Today, Week buttons set the depth of the period of looking back to calculate the impact of current news values.

The influence rating panel (appears by clicking on the corresponding button) analyzes 12 currency pairs: EURUSD, GBPUSD, AUDUSD, NZDUSD, USDJPY, USDCHF, USDCAD, EURGBP, EURJPY, EURCAD, GBPJPY, plus the one to which the indicator is attached.

To change the news of the current currency pair to the news of another currency pair, just click on the corresponding line of the influence rating panel.

Allows you to find a currency pair whose rate is more likely to move under the influence of news

On the right you can open an additional Trading panel showing profit for the symbols of a given Magic number for multi-currency trading

There is a sound notification about the occurrence of news in the form of the spoken word “News”.

Markers for the beginning and end of trading sessions are displayed on the chart:

  • London
  • New York
  • Tokyo

Vertical lines of news released at the same time will be displayed on the chart with some offset.

To do this, set Options->Charts->Precise time scale in the terminal

Can be attached to any chart with any time frame.

If you purchased my indicator:

  • Your wishes will be taken into account when developing new versions
  • Tell your friends about it, because if they buy it, it will develop and improve

Parameters

Has Scale and markup =100% parameter for adjusting the interface on high-resolution monitors (100%, 125%, 150%, 175%, 200%).

Currency pair news = ""; // The entered value is used to display news; if not specified, then the symbol of the current chart

The value of the news impact filter, % = 60; // If the value of the news impact index is greater than the specified value, the corresponding arrow is displayed on the chart

. . . . . . . . . .

评论 10
Fabrizietto71
1088
Fabrizietto71 2024.04.16 02:35 
 

The product is well and carefully made. The developer's assistance is always timely and present. It proves to be very useful to have an overview regarding events that are upcoming. Very satisfied. We also optimized some settings together. I would add that Aleksander is always available and ready to make further improvements and changes.

220072256
4046
220072256 2024.03.08 12:59 
 

This fantastic news indicator is a staple of my trading

Matthew Phillip Clarke
315
Matthew Phillip Clarke 2023.12.08 10:08 
 

This tool has improved my trading so much, as now I am not wasting my time in markets that are too volatile during news times, it's the first template I open in the day before trading.

推荐产品
ToolBox 360 is the swiss knife of all indicators. It is full packed with useful tools to help you with your trading. It can be used to find best entry and exit points and help you to decide if you should open a trade or not. It shows market trends, candlestick formations outside / inside bars and you can sett time based allerts. Main features: Time based Fibonacci lines Choose a start and end time and the indicator shows you Fibonacci lines within the selected time range including range high
β指标,也被称为贝塔指标,作为对冲机构参考指标之一。 允许您测量个别资产(如货币和大宗商品)相对于市场组合、跨货币对、美元指数和股票指数的相对风险。通过了解您的资产与市场基准相比的表现,您将更清晰地了解您的投资风险状况。 显著特点: 准确的风险评估:β指标提供了资产相对于更广泛市场的风险的精确评估,帮助您做出明智的投资选择。 多样化策略:使用该指标优化您的投资组合,探索各种资产类别的多样化机会。 适用于多货币对冲:参与多货币对冲的投资者可以将该指标视为重要参考点。 实时见解:随时了解实时数据分析,以及时做出决策。 通过将β指标融入您的交易工具箱,解锁数据和风险分析的力量。开始做出更明智的选择,减少投资组合暴露于不必要风险。 β = 1:如果β等于1,表示资产的价格波动与市场整体的波动一致,即资产的价格变化与市场一致,通常意味着资产的风险与市场相当。 β > 1:如果β大于1,表示资产的价格波动比市场整体更大,即资产的价格变化波动较大,通常意味着资产更具风险。 β < 1:如果β小于1,表示资产的价格波动比市场整体更小,即资产的价格变化波动较小,通常意味着资产相对较低风险。 β = 0:
This product is designed for the MT5 platform and offers two key features: VWAP (Volume Weighted Average Price) calculation and Volume Profile analysis. Advantages: VWAP Calculation: The product calculates the VWAP, which is a popular indicator used by traders to determine the average price of a security based on its trading volume. It helps identify potential buying or selling opportunities by comparing the current price to the average price weighted by volume. Volume Profile Analysis: The prod
RAD Real Acummulation and Distribution
Jose Alejandro Jacome Jimenez
RAD CRITICAL LEVES RAD indicator tracks “Relevant Volume” in real time, identifying accumulation and distribution processes, projecting them in the chart as SUPPORT or RESISTANCE zones. Natural   support   and resistance levels are generated by Volume Accumulation and Distribution processes. As these processes evolve, levels at which the relevant volume in the market place is positioned, become difficult areas to cross upwards or downwards. By using this information, traders can identify very s
To download MT4 version please click here . - This is the exact conversion from TradingView: "Linear Regression Candles" By "ugurvu". - The overall look of the indicator is like Heiken Ashi. - It can be used as a trend confirmation indicator to detect the right trend direction. - This indicator lets you read the buffers for Candles' OHLC. - This is a non-repaint and light processing load indicator - You can message in private chat for further changes you need. Thanks
Tik Tok
Ivan Simonika
The Tik Tok indicator was created on the basis of the original extreme search indicators, the indicator is well suited for determining a reversal or a big sharp jerk in one direction, thanks to it you will know when this happens it will notify you when a blue dot for buying red for sale appears. It basically uses the process of detecting the rate of change in price growth and allows you to find entry and exit points from the market. fundamental technical indicator that allows you to assess th
VWAP Indicator MT5
Kyra Nickaline Watson-gordon
Description : VWAP (Volume-Weighted Average Price) is the ratio of the value traded to total volume traded over a particular time horizon. It is a measure of the average price at which pair is traded over the trading horizon. Read More. All Symbols and All Timeframes are supported. Indicator Inputs :     VWAP Mode : Mode of VWAP Calculation. Options can be selected : Single,Session,Daily,Weekly,Monthly     Volumes : Real Volumes,Tick Volumes     Price Type : Used price for cal
RSIScalperPro
PATRICK WENNING
介绍 RSIScalperPro - 这款基于 RSI 指标的革命性交易指标适用于 MetaTrader 5,专为一分钟图表的剖刺交易而设计。借助 RSIScalperPro,您将拥有一个强大的工具箱,用于精确的入场和出场信号,提升您的交易水平。 RSIScalperPro 使用两种不同的 RSI 指标,为超买和超卖区域提供清晰的信号。您可以根据自己的偏好自定义两个 RSI 的时间周期和限制值,以实现您的交易策略的最佳效果。图表上的明显箭头使您可以轻松识别何时进入或退出交易。 RSIScalperPro 的另一个亮点是三个可自定义的移动平均线,帮助您识别趋势方向并确认强大的交易信号。这使您可以早早发现趋势并参与到盈利交易中。 此外,您可以设置 RSIScalperPro 发出每个新交易信号的听觉警报。这样,即使您不经常坐在计算机屏幕前,也不会错过任何重要的交易机会。 RSIScalperPro 提供用户友好的界面,并且在 MetaTrader 5 中很容易插入和配置。您可以根据个人交易偏好自定义指标,并利用其多样化的功能,提高交易成果。 利用 RSIScalperPro 的优势,提高
Scroll Manager 5
Mohammad Badere
Hello ! If you scroll in one chart, all charts will be scrolled If you change the time frame in one chart, it will change in all charts Of course, you can turn this feature on or off All the charts in which you want changes to be applied are specified through ID in the indicator settings You can scroll the charts of different time frames in two ways at the same time 1: Coordinated based on time That is, 1 hour candle is 60 candles one minute back 2: scroll in the form of number of candles That i
White Weis Volume Ticks
Ricardo Almeida Branco
5 (4)
White Weis Volume This indicator shows the sum of the volume in each wave, bulish or bearish, as idealized by David Weis , but it brings an important addition , which is the marking of the bar with the highest volume of the wave (White Bar)! In coding the indicator, it was sought to optimize the code to require minimal processing during use and not to overload mt5. The indicator can be used for pre-trading analysis and study, where the trader analyzes possible points of support and resi
Индикатор Magneto Weekly Pro отображает: Недельные важные линии поддержки и сопротивления (выделены желтым, красным и синим цветами). Основные недельные цели (выделены белым цветом). Недельные паттерны возврата цены (обозначаются красными флажками). Применение индикатора Magneto Pro можно использовать и как дополнение к существующей стратегии, и как самодостаточную торговую стратегию. Данный продукт состоит из двух индикаторов, работающих на разных временных промежутках, и предназначен для скал
VWAP Bands
Rafael Caetano Pinto
This indicator uses VWAP and projects this VWAP into up to 3 levels, shifted by a percentage of the chart's symbol. How to configure: Choose the symbol and desired graphic time Set the start time of the symbol (in bovespa, WIN and WDO start at 9 o'clock). This time is used as the cutoff reference for VWAP. Check which VWAP period fits the chart better: Ideally, a period when VWAP is not too distant from the chart Set percentage levels: Ideally, you should set levels based on history, so that l
该指标基于离散哈特利变换。使用此转换允许您在处理金融时间序列时应用不同的方法。该指标的一个显着特点是它的读数不是指图表上的一个点,而是指指标周期的所有点。 处理时间序列时,指标允许您选择时间序列的各种元素。过滤的第一种可能性是建立在这种方法上的——所有不必要的高频分量都被简单地丢弃。第一个图展示了这种方法的可能性,选择CutOff参数,可以选择原始时间序列的细节(红线-只剩下主要信息CutOff = 0,黄色-主要和最低频率周期CutOff = 1 , 蓝色 - 所有最高频的噪声都被丢弃 CutOff = 4 )。然而,这不是唯一的可能性——噪声分量可以通过额外的过滤来抑制。 这两个选项都在该指标中实施。它的参数是: iPeriod - 指标周期 Shift - 指标相对于当前柱的偏移。通过更改此参数,您可以评估指标过去的表现。 NoiseReduction 是一种降低噪音的方法。可能的值:none - 不抑制噪声(在这种情况下只有 CutOff 参数起作用),constant - 噪声通过常数衰减,linear - 线性噪声抑制,对数 - 对数衰减,square - 根据平方根进行
Adjustable Consecutive Fractals  looks for 2 or more fractals in one direction and sends out a on screen alert, sound alert and push notification, for strong reversal points . Adjustable Consecutive Fractals, shows the fractals on chart along with a color changing text for buy and sell signals when one or more fractals appear on one side of price. Adjustable Consecutive Fractals is based Bill Williams Fractals . The standard Bill Williams fractals are set at a non adjustable 5 bars, BUT withe
GRat Clusters  is an indicator that shows various data in the form of clusters on a price chart: volume, delta, ratio of sales and purchases, etc. It allows you to visually see the market profile in real time and on history at a given depth. Capabilities 1.8 types of cluster data: volume, delta, purchases   and sales , volume and delta, imbalance between sales and purchases , volume profile, delta profile, buy and sell profile. 2. A cluster period can be either any available in MT5 timeframe or
Session Volume Profile  is an advanced graphical representation that displays trading activity during Forex trading sessions at specified price levels. The Forex market can be divided into four main trading sessions: the Australian session, the Asian session, the European session and the favorite trading time - the American (US) session. POC  - profile can be used as a support and resistance level for intraday trading. VWAP  - Volume Weighted Average Price. ATTENTION  ! For the indicator to
在分析金融时间序列时,研究人员通常会初步假设价格是根据正常(高斯)定律分配的。这种方法是由于以下事实:可以使用正态分布来模拟大量实际过程。而且,该分布的参数的计算没有很大困难。 但是,当应用于金融市场时,正态分布并不总是起作用。金融工具的收益通常具有不同于正常形式的形式。太频繁和/或大的排放导致使用所谓的“重尾巴”分布。 在构建此指标时,我们将假设价格水平受拉普拉斯分布的影响。这种分布之间的主要区别在于,它允许更大范围的值。因此,拉普拉斯分布使模拟价格走势成为可能。此外,拉普拉斯分布是复合的,因此可以在不同条件下出现低值和高值的情况下使用。分布本身外观上与正常情况有很大差异。图的形状和位置取决于两个参数-b和m。 等级设定 拉普拉斯分布的主要优点是参数值范围大。因此,当使用正态分布时,大多数值都介于-3到+3之间。使用Laplace分布时,范围会扩展到–5 ... + 5。因此,可以更准确地对价格变化进行分类并做出更平衡的交易决策。表中显示了价格将在指定限制内​​的大概概率。 Range Probability,% Subrange Probability,% – 1…+1  
El indicador "Mega Spike Boom and Crash" es una herramienta diseñada para su uso en los índices sintéticos, específicamente en los pares Boom y Crash. Su propósito principal es identificar y trazar zonas que funcionan como niveles de soporte y resistencia en distintas temporalidades. La temporalidad mas recomendada para usar este indicador es en el marco de tiempo de 5 minutos  El precio de apertura de ( 1 H , 15 M , 30M )   horas  son los niveles de precios más importante del día. Representa
Fat and Slim
Pavel Milicka
The Fat and Slim indicator tracks strong and weak money in the market. It is derived from RSI, MFI and many similar indicators. Input values are closing prices and volumes. The RSI (yellow curve) is in the range -100 ... 100. It is additionally multiplied by a coefficient so that the curve is not compressed to the middle values at higher periods (a problem with the classic RSI with different periods). Strong/Fat red curve is RSI weighted by higher volumes. Weak/Slim blue curve is calculated so t
Pivot Reversal
Fyodor Korotkov
Hi there! Since I am starting commercial and non-commercial product publishing I would highly appreciate: If you like this product, please rate it. That will help to promote not only this product, but indirectly another ones. So, such promotion will help to make some money from commercial products. Thus, I will have opportunity to fund my another directions of trading researches like bot development using mql4 and mql5 programming languages as well as python written products like crypto bots. If
DYNAMIC SR TREND CHANNEL Dynamic SR Trend Channel is a simple indicator for trend detection as well as resistance/support levels on the current timeframe. It shows you areas where to expect possible change in trend direction and trend continuation. It works with any trading system (both price action and other trading system that use indicators) and is also very good for renko charting system as well. In an uptrend, the red line (main line) serves as the support and the blue line serves as the
Unlock the power of Fibonacci with our advanced indicator! This tool precisely plots Fibonacci levels based on the previous day's high and low, identifying the next day's key support and resistance levels. Perfect for day trading and swing trading, it has consistently generated weekly profits for me. Elevate your trading strategy and seize profitable opportunities with ease. NOTE: In the Input section make sure the draw labels are set to "True" so you can see each levels.
Rejection Block
Usiola Oluwadamilol Olagundoye
The "Rejection Block" MetaTrader 5 Indicator offers traders a comprehensive tool for identifying and visualizing rejection candlestick patterns, commonly known as rejection blocks. These patterns are pivotal in discerning potential market reversals or continuations, making them invaluable for traders seeking to enhance their analysis. Key Features: Rejection Block Detection: The indicator diligently scans price data, pinpointing instances of rejection candlestick patterns. These patterns typical
FREE
Trading Session Multisession
Yibeltal Beyabel Eneyew
Visual guide which divides the 24 hours into three trading sessions. The default setting is to show Asian , London and New York sessions. But, the session start and end hours can be adjusted as required.  The indicator is useful to develop trading strategies by making it easy to see the market behavior during the three sessions.  Inputs Time Zone Start and End hours (Please provide values in HH:MM format, like 02:00, not like 2:00. Both the hours and minutes should have 2 digits) Time zone
Bull vs Bear Price Strength Oscillator
Maestri Investment Group Ltd.
Introducing the "Bull vs Bear Price Strength Oscillator" Indicator: Your Key to Smart Trading Decisions! Are you looking for a trading tool that can provide you with a clear and visual representation of price trend strength? Look no further! The Price Strength Indicator is here to transform the way you analyze the markets and make trading decisions. Uncover Hidden Market Strength: The Price Strength Indicator is designed to help you assess the market's momentum with ease. It does this by evaluat
Value Chart Candlesticks
Flavio Javier Jarabeck
4.7 (10)
The idea of a Value Chart indicator was presented in the very good book I read back in 2020 , " Dynamic Trading Indicators: Winning with Value Charts and Price Action Profile ", from the authors Mark Helweg and David Stendahl. The idea is simple and the result is pure genius: Present candlestick Price analysis in a detrended way! HOW TO READ THIS INDICATOR Look for Overbought and Oversold levels. Of course, you will need to test the settings a lot to find the "correct" one for your approach.
FREE
Color Histogram Volume Set
Ricardo Almeida Branco
Do you use volume in your reading of the market? Certainly many traders use it, and do not imagine operating without it. The Color Histogram Volume Set indicator allows the user to choose the value that he considers interesting to monitor. When you pass this you will have visual confirmation and if you want you will also have the audible alert that is given by the indicator. Of course, there are other ways to try to find a high volume, such as assessing whether the volume
Intraday Vwap Orion
Joao Paulo Botelho Silva
Theory VWAP is a volume-weighted moving average, bringing greater relevance to prices. The VWAP base calculation follows the classic formula described in Investopedia ( https://www.investopedia.com/terms/v/vwap.asp ). VWAP = sum(typical price[i]*volume[i]) / sum(volume[i]) Functionalities Orion Intraday VWAP innovates by allowing the user to choose between the conventional Daily, Weekly and Monthly periods, also having the option of calculating the Intraday indicator, as used in other platfo
VWAP with more settings
Maria Cristina Sabatini
I developed this vwap with more settings in order to be customized as much as possible.  VWAP is a really strong indicator for your trading. It can be used to check if the market is in balance or ranged, and also you can use the levels as support/resistence/target.  In the pictures you can see the main settings, and you can select the use of real volume from the broker. Hope you will find it useful. Many thanks in advance.  
This Indicator adding power to traditional zigzag indicator. With High-Low numbers in vision it will be easier to estimate change of trend by knowing the depth of each wave. Information including points, pips, percentage%, and #bars can be displayed based on configuration. All information is real-time update. This indicator is especially useful in sideway market to buy low sell high.
该产品的买家也购买
TPSpro RFI Levels MT5
Roman Podpora
4.75 (12)
指示       俄罗斯 -        英语   建议 与指示器一起使用     -       TPSpro 趋势专业版 -   MT4版本       交易中的一个关键要素是做出买卖交易工具决定的区域或水平。尽管主要参与者试图隐藏他们在市场中的存在,但他们不可避免地会留下痕迹。我们的任务是学习如何识别这些痕迹并正确解释它们。 主要功能: 向卖家和买家显示活跃区域! 该指标显示所有正确的初始买入和卖出脉冲水平/区域。激活这些水平/区域后,开始寻找切入点,水平会改变颜色并填充特定阴影。此外,还会显示箭头,以便更直观地了解情况。 显示更高时间范围内的级别/区域(MTF 模式) 添加了使用更高时间间隔显示级别/区域的功能。此外,该指标还具有自动趋势检测功能(   TPSproTREND PRO   )。 用于交易的单独专业的逐步算法。 该算法专为日内交易而设计,既可顺势交易,也可逆势交易。每个活动模板均提供详细说明。 适用于多种时间范围 。 TPSpro RFI 水平指标可用于图表上的任何时间范围,从一分钟(M1)开始一直到每月(MN)。 图形和声音警报。 该指标提供图形和声音指示
Quantum TrendPulse
Bogdan Ion Puscasu
5 (1)
介绍 Quantum TrendPulse   ,这是一款终极交易工具,它将 SuperTrend   、   RSI 和 Stochastic 的强大功能整合到一个综合指标中,以最大限度地发挥您的交易潜力。该指标专为追求精准和效率的交易者而设计,可帮助您自信地识别市场趋势、动量变化以及最佳进入和退出点。 主要特点: 超级趋势整合: 轻松跟随当前的市场趋势并乘上盈利浪潮。 RSI 精度: 检测超买和超卖水平,非常适合把握市场逆转时机,可用作 SuperTrend 的过滤器 随机精度: 利用随机振荡在波动的市场中寻找隐藏的机会, 用作超级趋势的过滤器 多时间范围分析: 从 M5 到 H1 或 H4,在不同时间范围内关注市场动态。 可定制的警报: 当您的自定义交易条件得到满足时收到通知,这样您就不会错过任何交易。 无论您是新手还是经验丰富的交易员,   Quantum TrendPulse 都能为您提供所需的优势,帮助您增强策略并自信地进行交易。借助这一强大的指标,将洞察力转化为利润 — 掌控您的交易! ***购买 Quantum TrendPulse,即可免费获得 Quantum T
FX Levels MT5
Daniel Stein
FX Levels 是一款异常精确的支撑位和阻力位指标,它将传统的灯塔方法与创新的动态方法相结合,可在所有交易符号中完美运行。这包括货币对、指数、股票或商品。FX Levels 可识别反转点并将其显示在图表上,在您的交易活动中,这些反转点可理想地用作盈利目标。 在开发 FX Levels 的过程中,我们利用了与经纪商打交道的丰富经验,以及他们在数据源和时间设置方面的差异。因此,FX Levels 现在可以识别不同经纪商几乎 100% 相同的水平。FX Levels 的这一特殊功能为用户提供了前所未有的可靠性,这是其他任何支撑和阻力指标都无法比拟的。 在 Stein Investments,我们非常注重细节,因为这正是一个好的交易工具与一个伟大的工具之间的区别所在,而这种对细节的额外关注使我们能够为用户将众所周知的分析方法提升到一个全新的水平。 试试吧... FX Levels 属性中的大多数条目都很直观;不过,我在此仅重点解释其中的关键条目。 首先,您可以选择两种分析方法。许多人都熟悉的 经典方法 来自前一款产品 Lighthouse,它的运行方式比较静态,每天只更新一次。 而创
该仪表盘显示所选符号的最新可用谐波形态,因此您可以节省时间并提高效率 /  MT4 版本 。 免费指标:  Basic Harmonic Pattern 指标列 Symbol:   显示所选符号 Trend:     看涨或看跌 Pattern:    形态类型(Gartley、蝴蝶、蝙蝠、螃蟹、鲨鱼、Cypher 或 ABCD) Entry:     入口价格 SL: 止损价 TP1: 第一止盈价 TP2: 第二次获利价格 TP3: 第三次获利价格 Current price:    当前价格 Age (in bars):   最后绘制的模式的年龄 主要输入 Symbols :   从 "28 种主要货币对 "或 "选定符号 "中选择。 Selected Symbols :   希望监控的符号,用逗号分隔("EURUSD,GBPUSD,XAUUSD")。如果您的经纪商为货币对设置了后缀或前缀,您必须在以下两个参数中添加(货币对前缀或货币对后缀)。 Max Iteration:   调整模式的最大迭代次数(如果该值越小,则模式越少,性能越快;如果该值越大,则模式越多,性能
Atomic Analyst MT5
Issam Kassas
4.32 (19)
首先值得强调的是,该交易指标是非重绘、非延迟的指标,这使其成为手动和机器人交易的理想选择。 用户手册:设置、输入和策略。 Atomic Analyst是一种PA价格行动指标,利用价格的力量和动量来寻找市场上更好的机会。配备了高级过滤器,可帮助去除噪音和假信号,并提高交易潜力。使用多层复杂的指标,Atomic Analyst扫描图表,并将复杂的数学计算转化为任何初学者都能理解并用来做出一致交易决策的简单信号和颜色。 “Atomic Analyst”是专为新手和经验丰富的交易者量身定制的综合交易解决方案。它将高级指标和一流功能融合为一体的交易策略,使其成为所有类型交易者的多功能选择。 日内交易和剥头皮策略:专为快速准确的日内交易和短期交易而设计。 日内和摆动交易策略:可用作追求价格大幅波动的日内和摆动交易者的可靠工具。 多货币和市场:凭借其可靠的精度,在不同的工具和市场上运作。 多个时间框架:可在多个时间框架上使用,性能良好。 稳定性:所有指标均不重绘、不重绘和不滞后,确保可靠的信号。 信号清晰度:提供箭头信号,用于清晰的入场和出场点。 实时警报:通过交易入场、SL和TP警报通知交
首先,值得强调的是,这个交易系统是一个非重绘、非重画和非滞后的指标,这使得它非常适合手动和机器人交易。 在线课程,手册和下载预设。 “智能趋势交易系统 MT5”是专为新手和经验丰富的交易者量身定制的综合交易解决方案。它结合了超过 10 个优质指标,具有 7 多个强大的交易策略,使其成为适用于各种市场条件的多功能选择。 趋势跟随策略:提供精确的入场和止损管理,以有效地跟随趋势。 反转策略:识别潜在的趋势反转,使交易者能够利用区域市场的机会。 剃头策略:专为快速准确的日内交易和短期交易而设计。 稳定性:所有指标都不会重绘、不会重画和不会滞后,确保可靠的信号。 定制:支持自定义策略,以满足个人交易偏好。超过 7 种策略和组合可帮助您找到最佳策略。 信号清晰度:提供箭头信号,以指示清晰的入场和退出点。 实时警报:通过交易进出警报使交易者保持了解。 深入分析:提供更高时间框架的趋势分析和实时交易监控。 自适应颜色编码:利用蜡烛颜色编码来显示成交量、趋势和反转蜡烛信号。通过蜡烛颜色分析市场方向。 “智能趋势交易系统 MT5”赋予交易者必要的工具,以便在各种市场条件下做出明智和战略性的交易决策。无论
FX Power MT5 NG
Daniel Stein
5 (7)
通过 mql5 和 Telegram 上 的晨间简报获取每日市场更新,包括详细信息和屏幕截图 ! FX Power MT5 NG 是我们长期以来非常受欢迎的货币强度计算器 FX Power 的下一代产品。 这款下一代强度计算器能提供什么?您所喜爱的原版 FX Power 的所有功能 附加功能 黄金/XAU 强度分析 更精确的计算结果 可单独配置的分析周期 可自定义计算限制,以获得更好的性能 为希望查看更多信息的用户提供特殊的多实例设置 无尽的图形设置,可在每个图表中设置您最喜欢的颜色 无数的通知选项,让您再也不会错过任何重要信息 采用 Windows 11 和 macOS 风格的全新圆角设计 神奇的移动指标面板 FX Power 主要功能 所有主要货币的完整强势历史 所有时间框架内的货币强弱历史 所有经纪商和图表的计算结果完全相同 100% 可靠的实时计算 -> 无重绘 可通过下拉列表选择分析时段 通过自定义模式单独配置分析时段 可在一个图表中使用多个实例 可移动 FX Power 显示屏(通过拖放) 适用于高分辨率 QHD、UHD 和 4K 显示器 自动终端配置 针对平板电脑
FX Volume MT5
Daniel Stein
4.93 (14)
通过 mql5 和 Telegram 上 的 " 晨间简报 "获取每日市场更新,包括详细信息和屏幕截图 ! 外汇交易量(FX Volume)是第一个也是唯一一个从经纪商角度真正洞察市场情绪的交易量指标。 直接在您的图表上看到这些信息是真正改变游戏规则和突破性的交易解决方案。 受益于独特的市场数据洞察,如 比率(Ratios )显示货币多头和空头头寸的比率(百分比 比率变化 显示所选时间段内的多头比率及其百分比变化 总交易量 显示货币的总交易量(多头和空头),以手为单位 多头 交易量显示货币所有多头头寸的交易量 空头 交易量显示所有货币空头头寸的交易量 净多头 显示净多头交易量,即所有多头头寸减去所有空头头寸(以手为单位)。 净多头百分比 显示货币净多头交易量的变化 请阅读我们的基本教程 -> "如何使用外汇交易量进行交易 " 获取更多信息,如常见问题、交易技巧和教程视频,请访问我们的 外汇交易量公共信息频道 请 安装并运行 SI Connect 以建立与我们数据中心的持续连接 背景信息 我们都知道,外汇是一个分散的市场。这就是为什么我们必须打破常规思维,开发一个独
Matrix Arrow Indicator MT5
Juvenille Emperor Limited
5 (13)
矩阵箭头指标 MT5   是一种独特的 10 合 1 趋势,遵循   100% 非重绘多时间框架指标 ,可用于所有符号/工具: 外汇 、 商品 、 加密货币 、 指数 、 股票 。 Matrix Arrow Indicator MT5 将在其早期阶段确定当前趋势,从多达 10 个标准指标中收集信息和数据,它们是: 平均定向运动指数 (ADX) 商品渠道指数 (CCI) 经典 Heiken Ashi 蜡烛 移动平均线 移动平均收敛散度 (MACD) 相对活力指数 (RVI) 相对强弱指数 (RSI) 抛物线SAR 随机振荡器 威廉姆斯的百分比范围 当所有指标给出有效的买入或卖出信号时,相应的箭头将打印在图表上,在下一根蜡烛/柱线开盘时,指示强劲的上升趋势/下降趋势。用户可以选择使用哪些指标,并可以单独调整每个指标的参数。 Matrix Arrow Indicator MT5 仅从选定的指标中收集信息,并仅根据其数据打印箭头。   Matrix Arrow Indicator MT5   还可以为所有新信号发送终端、推送通知或电子邮件警报。无论您是黄牛、日内交易者还是波段交易者, Mat
介绍黄金闪电剥头皮指标,这是在M1、M5和M15时间框架上剥头皮黄金的终极工具。该指标使用先进的AI神经网络开发,保证了稳定的盈利能力和卓越的交易结果。为了确保精准和高效,黄金闪电剥头皮指标在M15时间框架上提供最佳表现。 主要特点: 先进的AI神经网络: 利用尖端AI技术实现无与伦比的准确性。 无重绘: 保证信号可靠,无重绘,确保一致的表现。 多时间框架剥头皮: 针对M1、M5和M15时间框架进行优化,其中M15时间框架提供最佳结果。 全面的信号: 提供清晰的买入/卖出信号、盈利(TP)和止损(SL)水平,帮助做出明智的交易决策。 优势: 高准确性: 通过高度精确的信号实现卓越的交易成功。 实时警报: 通过即时警报和信号保持领先地位。 用户友好: 使用简便,提供清晰的说明和支持。 终身访问: 享受终身访问权限和当前版本的免费更新。 专家支持: 获得我们专家团队的终身个人支持。 使用方法: 将黄金闪电剥头皮指标安装到您的MT5平台上。 按照指标提供的买入/卖出信号进行操作。 利用TP/SL水平优化您的交易。 交易建议: 盈利(TP): 使用20至50点作为盈利目标。 止损(SL
介绍     Quantum Breakout PRO   ,突破性的 MQL5 指标,正在改变您交易突破区域的方式!由拥有超过13年交易经验的资深交易员团队开发,     量子突破 PRO     旨在通过其创新和动态的突破区域策略将您的交易之旅推向新的高度。 量子突破指标将为您提供带有 5 个利润目标区域的突破区域的信号箭头,以及基于突破框的止损建议。 它既适合新手交易者,也适合专业交易者。 量子 EA 通道:       点击这里 重要的!购买后请私信我领取安装手册。 建议: 时间范围:M15 货币对:GBPJPY、EURJPY、USDJPY、NZDUSD、XAUUSD 账户类型:ECN、Raw 或 Razor,点差极低 经纪商时间:GMT +3 经纪商:IC Markets、Pepperstone with Raw 和 Razor 的点差最低 规格: 不重漆! 最多 5 个建议利润目标区域 建议止损水平 可定制的盒子。您可以设置自己的 Box Time Start 和 Box Time End。 接触 如果您有任何疑问或需要帮
PZ Swing Trading MT5
PZ TRADING SLU
5 (4)
Swing Trading 是第一个旨在检测趋势方向的波动和可能的反转波动的指标。它使用在交易文献中广泛描述的基准摆动交易方法。该指标研究多个价格和时间向量,以追踪总体趋势方向,并检测市场超卖或超买并准备好进行修正的情况。 [ 安装指南 | 更新指南 | 故障排除 | 常见问题 | 所有产品 ] 市场波动的利润不会被窃取 指示器始终显示趋势方向 彩色价格带代表机会基准 彩色虚线表示可能的反转波动 该指标分析其自身的质量和性能 它实现了一个多时间仪表板 可定制的趋势和波动周期 它实现了电子邮件/声音/推送警报 指示器为非重涂或重涂 什么是摇摆交易 摇摆交易是一种尝试在一天到一周内从证券中获得收益的交易方式,尽管某些交易最终可以保持更长的寿命。摇摆交易者使用技术分析来买入弱点和卖出力量,并有耐心等待这些机会的发生,因为在发生一波抛售浪潮之后购买证券而不是陷入抛售更有意义。 机会基准 关于历史数据的大量研究证明,适合于波动交易的市场倾向于在基线价格带上下交易,基线价格带由图表显示,使用平均真实区间计算得出。波动交易者使用基线,该策略是购买常态和卖出躁狂,或做空常态并掩盖沮丧。
Entry Points Pro for MT5
Yury Orlov
4.44 (126)
这款指标用于 MT5,可提供准确的入场交易信号,且无重绘。 它可应用在任何金融资产:外汇、加密货币、贵金属、股票、指数。 它将提供极其精准的评估,并告诉您何时开仓和平仓的最佳时机。 观看 视频 (6:22),其中包含一个仅处理单一信号的示例,该信号即可值回指标购价! 大多数交易者在 Entry Points Pro 指标的帮助下,在第一个交易周内即改善了他们的交易结果。 订阅我们的 Telegram 群 ! Entry Points Pro 指标的益处。 入场信号无重绘 如果信号出现,并得到确认,则它不会再消失;不像是重绘指标,它会导致重大的财产损失,因为它们可以在显示信号后再将其删除。 无差错开仓 指标算法可令您找到入场交易(买入或卖出资产)的理想时机,从而提高每位交易者的成功率。 Entry Points Pro 可操作任何资产 它允许您在 MT5 平台上交易任何经纪商的加密货币、股票、贵金属、指数、大宗商品和货币。 提供任何方向的信号 Entry Points Pro 指标提供针对任意价格走势的入场交易信号 - 上涨、下跌或横盘(横向)。
Advanced Currency Strength28 MT5
Bernhard Schweigert
5 (1)
任何新手或专家交易者的最佳解决方案! 这个指标是一个独特的、高质量的、可负担得起的交易工具,因为我们纳入了一些专有的功能和一个新的公式。只需一个图表,你就可以读出28个外汇对的货币强度!想象一下,你的交易将如何得到改善,因为你的交易是在你的手中进行的。想象一下,你的交易将如何改善,因为你能够准确地确定新趋势或剥头皮机会的触发点? 用户手册:点击这里  https://www.mql5.com/en/blogs/post/697384 这是第一本,原版的! 不要买一个毫无价值的崇拜者的克隆品。 特别的 子窗口中的箭头显示强劲的货币势头GAP将指导你的交易! 当基础货币或报价货币处于超卖/超买区域(外盘斐波那契水平)时,在个人图表的主窗口中出现警告信号。 当货币力量从外围区间回落时,回撤/反转警报。 十字星模式的特别警报 可选择多个时间框架,以快速查看趋势! 货币强度线在所有的时间框架中都非常平稳,当使用较高的时间框架来识别总体趋势,然后使用较短的时间框架来确定精确的入口时,效果非常好。你可以根据自己的意愿选择任何时间框架。每个时间框架都由其自身进行了优化。 建立在
AT Forex Indicator MT5
Marzena Maria Szmit
5 (5)
The AT Forex Indicator MT5 is a sophisticated trading tool designed to provide traders with a comprehensive analysis of multiple currency pairs. This powerful indicator simplifies the complex nature of the forex market, making it accessible for both novice and experienced traders. AT Forex Indicator uses advanced algorithms to detect trends, patterns and is an essential tool for traders aiming to enhance their forex trading performance. With its robust features, ease of use, and reliable signal
Italo Trend Indicator MT5
Italo Santana Gomes
4.9 (10)
BUY INDICATOR AND GET EA FOR FREE AS A BONUS + SOME OTHER GIFTS! ITALO TREND INDICATOR  is the best trend indicator on the market, the Indicator works on all time-frames and assets, indicator built after 7 years of experience on forex and many other markets. You know many trend indicators around the internet are not complete, does not help, and it's difficult to trade, but the Italo Trend Indicator is different , the Italo Trend Indicator shows the signal to buy or sell, to confirm the signal t
RelicusRoad Pro MT5
Relicus LLC
5 (17)
现在$ 147(更新后增加到$ 499) - 无限帐户(PC或Mac) RelicusRoad 用户手册 + 培训视频 + 访问 Private Discord Group + VIP 身份 一种看待市场的新方式 RelicusRoad 是世界上最强大的外汇、期货、加密货币、股票和指数交易指标,为交易者提供保持盈利所需的所有信息和工具。我们提供技术分析和交易计划,帮助每一位交易者取得成功,从初学者到高级。它是一个关键的交易指标,可以提供足够的信息来预测未来的市场。我们相信一个完整的解决方案,而不是图表上几个没有意义的不同指标。这是一个多合一指标,显示无与伦比且非常准确的信号、箭头 + 价格行为信息。 RelicusRoad 基于强大的人工智能,提供缺失的信息和工具来教育您并使您成为交易专家,成为成功的交易者。 几乎所有技术指标都滞后,这意味着它们只能报告已经发生的事情。因此,他们只确认您过去可以看到的价格已经在哪里。我们相信领先指标可以预测未来价格,而无需重新绘制,也不要过度依赖可能改变并导致重新绘制的滞后指标。如果您根据滞后指标进行交易并建立头寸,您就知道您已
Blahtech Supply Demand MT5
Blahtech Limited
4.54 (13)
Was: $299  Now: $99   Supply Demand uses previous price action to identify potential imbalances between buyers and sellers. The key is to identify the better odds zones, not just the untouched ones. Blahtech Supply Demand indicator delivers functionality previously unavailable on any trading platform. This 4-in-1 indicator not only highlights the higher probability zones using a multi-criteria strength engine, but also combines it with multi-timeframe trend analysis, previously confirmed swings
可以说,这是您可以为MetaTrader平台找到的最完整的谐波价格形成自动识别指标。它检测19种不同的模式,像您一样认真对待斐波那契投影,显示潜在的反转区域(PRZ),并找到合适的止损和获利水平。 [ 安装指南 | 更新指南 | 故障排除 | 常见问题 | 所有产品 ] 它检测19种不同的谐波价格形态 它绘制了主要,衍生和互补的斐波那契投影(PRZ) 它评估过去的价格走势并显示每个过去的形态 该指标分析其自身的质量和性能 它显示合适的止损和获利水平 它使用突破来表明合适的交易 它在图表上绘制所有样式比率 它实现了电子邮件/声音/视觉警报 受斯科特·M·卡尼(Scott M. Carney)的书的启发,该指标旨在满足最纯粹和最熟练的交易者的需求。但是,它采取了一种使交易更容易的方式:在向交易发出信号之前,它会等待Donchian朝正确方向突破,从而使交易信号非常可靠。 斐波那契投影与向量无关 它实现了电子邮件/声音/推送警报 它绘制了ABCD投影 重要提示: 为了符合 Scott M. Carney先生 的商标申诉,某些图案名称已重命名为不言自明的替代方式, Scot
IX Power MT5
Daniel Stein
4.17 (6)
IX Power 终于将 FX Power 的无与伦比的精确性带到了非外汇交易符号中。 它能准确判断您喜爱的指数、股票、商品、ETF 甚至加密货币的短期、中期和长期趋势强度。 您可以 分析 终端提供的 一切 。试试吧,体验一下您在交易时如何把握 时机 。 IX Power 主要功能 100% 精确的非重绘计算结果 - 适用于您终端中的所有交易符号 下拉式选择预配置以及可单独配置的强度分析周期 通过电子邮件、消息和手机通知的无数种通知选项 可访问的 EA 请求缓冲区 可自定义计算限制,以获得更好的性能 为希望查看更多信息的用户提供特殊的多实例设置 无尽的图形设置,让您在每个图表中都能找到最喜欢的颜色 采用 Windows 11 和 macOS 风格的圆角新面板设计 神奇的移动指标面板,可在子窗口和主图表之间无缝移动 适用于高分辨率 QHD、UHD 和 4K 显示器,并针对平板电脑和触摸屏进行了优化 IX Power 参数 最重要的参数不言自明,但我们很快会在另一篇文章中为您提供所有 IX Power 参数的完整说明。 使用别名 "参数可为技术交易符号
Quantum Trend Sniper
Bogdan Ion Puscasu
4.71 (49)
介绍   量子趋势狙击指标 ,突破性的 MQL5 指标,正在改变您识别和交易趋势反转的方式!由拥有超过13年交易经验的资深交易员团队开发,     量子趋势狙击指标   旨在通过其创新的方式以极高的准确度识别趋势反转,将您的交易之旅推向新的高度。 ***购买量子趋势狙击指标,即可免费获得量子突破指标!*** 当量子突破指标识别出趋势反转时,它会向您发出警报和信号箭头,并建议您三个止盈水平。 它既适合新手交易者,也适合专业交易者。 量子 EA 通道:       点击这里 MT4版本:       点击这里 建议: 时间范围: 所有时间范围。为了获得最佳结果,我们建议在 M15、M30 和 H1 时间范围内使用它。 货币对:欧元兑美元、英镑兑美元、澳元兑美元、欧元兑英镑、, EURAUD,  XAUUSD 账户类型:ECN、Raw 或 Razor,点差极低 经纪时间:任意 经纪商:IC Markets、Pepperstone with Raw 和 Razor 的点差最低 建议止损:50 点 建议止盈水平:20 点、50 点和
Meco Ultimate Channel
Thapelo Kapwe
5 (1)
This indicator belongs to the family of channel indicators. These channel indicator was created based on the principle that the market will always trade in a swinging like pattern. The swinging like pattern is caused by the existence of both the bulls and bears in a market. This causes a market to trade in a dynamic channel. it is designed to help the buyer to identify the levels at which the bulls are buying and the bear are selling. The bulls are buying when the Market is cheap and the bears a
Blahtech Market Profile MT5
Blahtech Limited
5 (9)
Was: $249  Now: $99   Market Profile defines a number of day types that can help the trader to determine market behaviour. A key feature is the Value Area, representing the range of price action where 70% of trading took place. Understanding the Value Area can give traders valuable insight into market direction and establish the higher odds trade. It is an excellent addition to any system you may be using. Inspired by Jim Dalton’s book “Mind Over Markets”, this indicator is designed to suit the
Gold TMAF MTF - 这是一个最佳股票技术指标。该指标算法分析资产的价格走势,并反映波动性和潜在进入区域。 最佳指标信号: - 卖出 = TMA2 的红色上边界高于 TMA1 的红色上边界 + 上方的红色分形指标 + 同方向的黄色 SR 信号箭头。 - 买入 = TMA2 的蓝色下边界低于 TMA1 的蓝色下边界 + 下方的蓝色分形指标 + 同方向的水蓝色 SR 信号箭头。 该指标的优点 1. 指标产生的信号精确度高。 2. 确认的箭头信号不会重绘,分形信号可以重绘半个周期。 3. 您可以在任何经纪商的 MetaTrader 5 交易平台上进行交易。 4. 您可以交易任何资产(货币、金属、加密货币、股票、指数等)。 5. 最好在 M30-H1 时间框架(中期交易)上进行交易。 6. 在指标设置中可更改个别参数(TF、颜色等),以便每位交易者都能轻松定制适合自己的指标。 7. 该指标既可作为交易系统的主要补充,也可作为独立的交易系统使用。 注意:交易的入市准确性和盈利能力仅取决于交易者的技能。任何指标都只是交易者的助手,而非行动指南。
TPA True Price Action indicator reveals the true price action of the market makers through 100% non-repainting signals strictly at the close of a candle! TPA shows entries and re-entries, every time the bulls are definitely stronger than the bears and vice versa. Not to confuse with red/green candles. The shift of power gets confirmed at the earliest stage and is ONE exit strategy of several. There are available now two free parts of the TPA User Guide for our customers. The first "The Basics"
该指标可识别30多种日本烛台图案,并在图表上突出显示它们。这只是价格行为交易者不能没有的那些指标之一。 一夜之间增强您的技术分析 轻松检测日本烛台图案 交易可靠且通用的反转模式 使用延续模式安全跳入已建立的趋势 指示器不重涂并实施警报 该指标实现了一个多时间框架 仪表板 它检测到的模式太多,以至于图表看起来非常混乱,难以阅读。交易者可能需要禁用指标输入中的不良图案,以使图表更具可读性。 它检测1条,2条,3条和多条样式 它检测逆转,持续和弱点模式 模式可以启用或禁用 看涨模式用 蓝色 标记,空头模式用 红色 标记,中性模式用 灰色 标记。 检测到的烛台模式列表 从1到5小节的突破距离(又名线罢工) 法基(又名Hikkake) 反间隙 三名士兵/三只乌鸦 锤子/流星/吊人 吞没 外上/外下 Harami 由上至下 晨星/晚星 踢球者 刺穿/乌云 皮带托 从1到5小条上升三分/下降三分 田木峡 并排间隙 视窗 前进块/下降块 审议 Marubozu 挤压警报(又称主蜡烛) Dojis 设置 PaintBars 使用条形的颜色打开/关闭图案的突出显示。 DisplayLabel
ON Trade Gann Squares MT5
Abdullah Alrai
5 (1)
Gann 方块指标是一种强大的市场分析工具,基于 W.D. Gann 在其“市场预测数学公式”一文中介绍的数学概念。该指标融合了与平方数(如 144、90 和 52)有关的 Gann 技术,以及平方 9。此外,它还融入了  关于如何将平方 9 与通道和星形图案结合使用的方法。 用户手册和使用方式: 在使用该指标之前,我们建议您阅读用户手册,并与我们联系以获得任何澄清。您可以在我们的网站上找到完整的用户手册。 该指标提供了 MT5 的完整版本供购买,也提供了 MT4 的免费版本供测试。提供了两个版本的链接供您方便使用。 主要特点和功能: Gann 方块指标为您的交易环境提供了全套工具,使您能够基于几何图案和 Gann 的概念做出明智的决策。以下是主要特点: 平方 9 分析:   该指标可以绘制与平方 9 有关的各种元素,包括水平线、星形图案、网格、Gann 扇形等。这在您的图表上提供了 Gann 的几何概念的视觉表示。 Gann 方块:   该指标绘制了 Gann 方块 52、90 和 144,使您能够可视化和分析它们与价格走势的关系。 自由 Gann 星形图案:   该指标使您能够直接
Gartley Hunter Multi
Siarhei Vashchylka
5 (8)
Gartley Hunter Multi - An indicator for searching for harmonic patterns simultaneously on dozens of trading instruments and on all possible timeframes. Manual (Be sure to read before purchasing) | Version for MT4 Advantages 1. Patterns: Gartley, Butterfly, Shark, Crab. Bat, Alternate Bat, Deep Crab, Cypher 2. Simultaneous search for patterns on dozens of trading instruments and on all possible timeframes 3. Search for patterns of all possible sizes. From the smallest to the largest 4. A
Royal Wave Pro M5
Vahidreza Heidar Gholami
3.5 (4)
Royal Wave is a Trend-Power oscillator which has been programmed to locate and signal low-risk entry and exit zones. Its core algorithm statistically analyzes the market and generates trading signals for overbought, oversold and low volatile areas. By using a well-designed alerting system, this indicator makes it easier to make proper decisions regarding where to enter and where to exit trades. Features Trend-Power Algorithm Low risk Entry Zones and Exit Zones Predictions for Overbought and Over
作者的更多信息
Trends and News
Aleksander Gladkov
5 (1)
With the Trend and News indicator you will always be up to date! Tells you in which direction it is safer to open positions 3 in 1: trends + news + news influence index news for the selected period actual trends for five timeframes (M5, M15, H1, H4, D1 by default) news impact index calculated by assessing the actual values of published news News Displayed on the chart as vertical lines with a description in the form of a tooltip The text displays two news: the previous published and the ne
GS smart
Aleksander Gladkov
5 (1)
Best price, read GS smart channel ! 1 copy left for $185. Next price --> $250 Traders who purchase GS smart receive a personal bonus. After purchase contact me for assistance GS smart is 3 in 1 = Superior Grid Expert Advisor + News feed + Trend indicator. (for MT5: GS smart5 ) Live results for Gold trading can be viewed here . You don't need to follow the trend, the EA uses the trend indicator in the trading algorithm. Automatically adjusts its parameters to work on any Forex instrument (in
News impact L
Aleksander Gladkov
Uses the built-in news calendar of the MT5 terminal or the Investing.com website (in the latter case, the Get news5 utility is required) Has the Scale parameter={100%, 110%, 125%, ...} to adjust the comfortable size of the text and control elements Tells you in which direction it is safer to open positions 3 in 1: news + trends + news impact index news for the selected period: current and in tabular form actual trends for 5 customizable timeframes and trend reversal levels forecast of exc
GS trendS
Aleksander Gladkov
GS trendS is a trend indicator that can be used for any Forex financial instrument. The indicator does not redraw and does not lag. Recommended timeframe H1. It is possible to select the trend algorithm settings {Only Open, Average Open/Close, Average High/Low} The color indicates the direction of the trend: yellow - direction can be SELL or BUY (S_B) blue - uptrend (BUY) red - downward trend (SELL) The indicator panel displays trend values of 5 timeframes for the current price level.
Get news
Aleksander Gladkov
Utility for reading news from investing.com To access the site, you need to add WebRequest in the Options terminal menu on the Expert Advisors tab: https://sslecal2.investing.com If reading is successful, a message about writing the file is displayed. The INV_week_this.txt file is written to the MQL4\Files folder of the terminal and is kept up to date, updating data according to its own timer You can attach the utility to any chart with any time frame; one is enough to support indicators o
FREE
GS spread
Aleksander Gladkov
The indicator calculates the current spread for each tick using the formula Spread=(ASK-BID)/Point. Schedule of changes in the boundaries spread over the timeframe displayed in a separate window from the date of accession of the indicator. Two lines corresponding to the minimum and maximum spread values are displayed. The indicator window is self-adjusted according to the minimum and maximum values from the moment of launch. The minimum and maximum values for the entire period of the indicator o
FREE
GS AssistDemo
Aleksander Gladkov
The demo version of GS Assist: only EURUSD, limited Lot, Profit and Loss parameters, the Members of Group panel has only two rows. The full version features a built-in Forex Factory news feed to allow closing orders before the news releases. GS Assist is designed for managing orders of other experts and risk exposure. It can run on all forex symbols. The tool can be used as an order manager for other experts and/or as a quick trading tool featuring BUY and SELL buttons. Features: Automatic closi
FREE
GS Assist
Aleksander Gladkov
Advisor to manage all orders opened in the terminal. It is used as an administrator of open orders, setting them with Stop Loss and Take Profit, if they didn’t have such when creating them. It has a built-in news feed from Forex Factory for the ability to automatically close orders before the news is released. It can be attached to any currency pair, and will work with all open orders. Advisor provides: The installation of Stop Loss and Take Profit of all orders opened in the ter
GS grid
Aleksander Gladkov
5 (4)
Uses an advanced grid algorithm with no martingale or limited Martingale (default) (version for MT5: GS grid5 ) . Defines and control the current trend; It switches himself its parameters in accordance with the current market conditions ; Flexible customizable grid algorithm with or without martingale; Drawdown reduction algorithm (DD Reduction Algoritm); Hedge algorithm; Interactive trade control buttons; The ability to open / close orders manually; News filter to prevent trading during news
GS target
Aleksander Gladkov
5 (2)
The automatic adviser of the new generation with parameters: Target profit per month (10%, 25%, 50%, 75%, 100%) - choice of strategy Stop Loss Limit, USD Filter News Forex Factory (true, false) Parameters for setting the lot size Uses the news feed from Forex Factory to prevent trading during news releases. Set up to work on EURUSD timeframe M15. Works on USD accounts with a leverage from 1:500 and a Deposit from 500USD.   Enough for work: Decide on the size of the deposit that you can trust
GS Hero
Aleksander Gladkov
According to the trading algorithm GS Hero is similar to the best expert advisors on the Market. Unique GS Hero make the author's criteria for entering the market, the ability to close trades with maximum profit (in mode TakeMaximumProfit=true, the TargetProfit parameter sets only the required minimum profit) and the trading intensity: 4 orders per day and 75% with profit. GS Hero trades on the Heiken Ashi indicator in the direction of the trend, orders are filtered using RSI and MACD indicator
GS done
Aleksander Gladkov
Designed for the safe trading of instruments in the Forex market. DOES NOT use Martingale, Grid and other dangerous strategies. GS done Expert uses only pending orders on the broker's server, which reduces the risk Each trade has a fixed StopLoss For each currency pair, no more than one transaction can be executed Trades at specific business hours when the market is most stable using customizable time filters and a news feed Uses the search algorithm for the most favorable moment to enter
GS fast
Aleksander Gladkov
GS fast is fully autonomus automatic adviser, that includes very advanced indicators and the author's trading algorithm (for MT5 GS fast5 ). Trend Following, Counter Trend system , Level Trading algoritm and averaging are used. Properties: Built-in filter for news on interest rates of the FOMC and the ECB for 2021 Can trade with an initial deposit of 100USD The default settings are optimal for the EURUSD H1 currency pair Principle of operation Signals of the ATR RSI i4 indicator for opening
ATR RSI i4
Aleksander Gladkov
Composition of ATR and RSI indicators. The ATR RSI indicator compares two calculations of the ATR indicator with the Fast and Slow periods on one chart, plus the line of the average and the overbought and oversold zones of the RSI indicator. ATR shows the values of the volatility change in the currency pair in points, taking into account the period specified as a parameter. The entry points provided by the RSI indicator show a very good risk-reward ratio in volatile and trending markets. ATR
ATR RSI x4
Aleksander Gladkov
The Expert Advisor implements a trading strategy based on overbought and oversold zones of ATR RSI i4 indicator signals, which is included in the code . Trend Following, Counter Trend system , DD reduction Algoritm and Level Trading algoritm are used. To start trading, simply attach the EA to the chart, preferably EURUSD H1 timeframe. Live results can be viewed here . To trade with the new Forex instrument (EURUSD H1 by default), it is recommended to set up the parameter values by testing, initi
GS gold
Aleksander Gladkov
Best price! GS gold is 2 in 1 = Advanced Grid Expert Advisor + Trend Indicator. The algorithm is optimized for trading XAUUSD M5 (gold). Deposit from $5000 with a leverage of 1: 500 and above. GS gold can be used on any other Forex instruments with default settings. Smart Grid Algoritm, Trend Following, Counter Trend system, DD reduction Algoritm, Active Hedging Algoritm and averaging are used. Preset strategies (Use strategy parameter): No strategy Low profit Medium profit High profit
Gain since start
Aleksander Gladkov
It will perfectly complement your working Expert Advisor or manual trading with up-to-date information. There is a sound notification of exceeding the established profit and loss limits of open SELL and BUY orders. Moreover, for each currency pair EURUSD, GBPUSD, XAUUSD, and others, various sound alerts are activated in English. Results are displayed on a special panel on the chart from the moment the indicator is activated: Elapsed time Fixed profit Current profit SELL Current profit BUY M
GS Trend5
Aleksander Gladkov
This Expert Advisor has been developed for autonomous automatic trading on EURUSD M15 around the clock. It provides protection of the deposit from significant drawdown and the profitable trade saving mode. Trades using a single deal. With the default settings, it opens one deal per day on average. How it works It uses a proprietary algorithm that analyzes three indicators and the market direction to make a decision on opening a deal. RSI Stochastic Bands market movement direction It opens an o
GS grid5
Aleksander Gladkov
F ully automated Expert Advisor using the advanced grid algorithm and constrained Martingale (MT4 version: GS grid ). Set up to work on EURUSD timeframe M15. Test 2021 shows a high percentage of winning orders: more than 98%. Works on HEDGING accounts with a leverage of 1:500 and a Deposit from 1000USD. Can use the news feed from Forex Factory to prevent trading during news release (Filter News Forex Factory=true;). To access the options terminal menu on the Expert Advisors tab, you must enable
GS target5
Aleksander Gladkov
The revolutionary automatic adviser of the new generation with three parameters: Target profit per month (from 10% to 100%) Degree of risk (SuperLow, Low, Medium, High) Stop Loss Limit, USD Set up to work on EURUSD timeframe M15. Works on HEDGING accounts with a leverage of 1:500 and a Deposit from 500USD.   Enough for work: Decide on the size of the deposit that you can trust him Set the value of the desired profit per month (from 10 to 100 percent) Select the degree of risk (Low, Medi
GS fast5
Aleksander Gladkov
5 (1)
GS fast5 is a completely independent automated Expert Advisor that includes very advanced indicators and an author's trading algorithm (for MT4 GS fast ). Live results can be viewed here . Properties: Built-in filter for news on interest rates of the FOMC and the ECB for 2021 Can trade with an initial deposit of 100USD The default settings are optimal for the EURUSD H1 currency pair Principle of operation Signals of the Stochastic_MACD indicator for opening an order with appropriate sett
GS smart5
Aleksander Gladkov
5 (4)
Best price, read GS smart channel ! 3 copies left for $350. Next price --> $400 Traders who purchase GS smart5 receive a personal bonus. After purchase contact me for assistance Real-time Gold trading signal 24/7 https://www.mql5.com/en/signals/2264587 GS smart5 is 3 in 1 = Superior Grid Expert Advisor + News feed + Trend indicator. Automatically adjusts its parameters to work on any Forex instrument (including cryptocurrencies, indices and CFDs) for USD accounts. To start trading, simply a
Gain since start MT5
Aleksander Gladkov
It will perfectly complement your working Expert Advisor or manual trading with up-to-date information. There is a sound notification of exceeding the established profit and loss limits of open SELL and BUY orders. Moreover, for each currency pair EURUSD, GBPUSD, XAUUSD, and others, various sound alerts are activated in English. Indicators are displayed on a special panel on the chart from the moment the indicator is activated: Elapsed time Fixed profit Current profit Maximum drawdown Curr
GS one
Aleksander Gladkov
Try how the adviser trades, I'm sure you'll like it! Extremely easy to use, does not require additional settings. Unique dynamic grid algorithm with trend indicator and hedging. Works with all Forex currency pairs. Default parameters are configured for EURUSD M5 What can be a problem for other grid Expert Advisors GS one turns into profit. Has a set of strategies: Follow the trend Sell and Buy Only Sell Only Buy XAUUSD_M5 GBPUSD_H1   GS one has an intuitive interface for quick management of t
GS trade report
Aleksander Gladkov
5 (1)
GS grid Pro
Aleksander Gladkov
The Expert Advisor works as quickly as possible using a minimum of resources, which is very good when using a VPS. Includes the latest grid algorithm implementation solutions: trend tracking separate automatic Breakeven for Sell and Buy series Active Hedging Algorithm during the trading process, sets Stop loss and Take profit for orders The default parameter settings do not use martingale. Works on all Forex instruments. Recommended: Deposit from $300 (only USD) with leverage from 1:500 Best r
A professional tool for real-time monitoring of the account status and the work of Expert Advisors. Information about the account status can be sent to Telegram chats automatically at a specified interval or upon request. From the screenshots of the open charts of the terminal, you receive upon request from your Telegram bot. Account information includes: 13:02 Trade monitoring by Telegram v.1.0 (headline) Account : 6802ххх RoboForex-Pro (account information) Profit start: 2661 USD (profit ear
Trade maker
Aleksander Gladkov
Multi-currency trading on one chart! Creation and management of positions with trailing and breakeven, risk management and other useful functions. To fix profits, the Target profit parameter is provided; if it is greater than zero, all positions will be closed if the set value is exceeded. All positions and orders have set Stop Loss and Take profit. For multi-currency trading, taking into account the impact of news and switching symbols on the chart, it is useful to use the News impact indicat
Bars news
Aleksander Gladkov
Indicator of news linked to a bar. The published current value of the news has a characteristic impact on the currency it relates to: positive, negative, neutral . The indicator summarizes all these values for the selected period, taking into account the importance of the news: high, medium, low . As a result, a percentage is calculated for the currency pair, which shows the news of which currency is dominant. If the value is positive, then the pair has news pressure towards BUY, if negative - S
Get news5
Aleksander Gladkov
Utility for reading news from investing.com To access the site, you need to add WebRequest in the Options terminal menu on the Expert Advisors tab: https://sslecal2.investing.com If reading is successful, a message about writing the file is displayed. The INV_week_this.txt file is written to the MQL5\Files folder of the terminal and is kept up to date, updating data according to its own timer You can attach the utility to any chart with any time frame; just one is enough to support indicat
筛选:
Fabrizietto71
1088
Fabrizietto71 2024.04.16 02:35 
 

The product is well and carefully made. The developer's assistance is always timely and present. It proves to be very useful to have an overview regarding events that are upcoming. Very satisfied. We also optimized some settings together. I would add that Aleksander is always available and ready to make further improvements and changes.

Aleksander Gladkov
4990
来自开发人员的回复 Aleksander Gladkov 2024.04.16 09:18
Thank you, the review is very important to me.
220072256
4046
220072256 2024.03.08 12:59 
 

This fantastic news indicator is a staple of my trading

Aleksander Gladkov
4990
来自开发人员的回复 Aleksander Gladkov 2024.03.08 13:34
Thanks for the review. Hopefully a new opportunity to use the site's news Investing.com improve the quality of calculating the news impact index and it will be more adequate for the market.
Matthew Phillip Clarke
315
Matthew Phillip Clarke 2023.12.08 10:08 
 

This tool has improved my trading so much, as now I am not wasting my time in markets that are too volatile during news times, it's the first template I open in the day before trading.

CraigLeith
64
CraigLeith 2023.12.05 20:12 
 

Great utility. I especially like the vertical lines that show upcoming news.

Antonio Fluxa Vidal
2273
Antonio Fluxa Vidal 2023.11.30 18:38 
 

This indicator is an essential utility for FX trading based on fundamental analysis. I recommend it without a doubt. Its design integrated into the graph makes the great task of detecting trends based on future macroeconomic data much more precise and clear. A great job with many opportunities in the future!

Mohammed Mohammed Mohammed Abu Zaid
350
 

Very good and useful indicator.. I have one point though: - the values in the [Actual, Forecast and Previous] columns don't show the '%' mark, so I don't know if this value is in points or percentage... Also there are other symbols as "K & M" that don't show. Some times the value is (3.8K or 3.8M) but the indicator only shows (3.8) Hope you fix this soon...

Also, I think it might me a good idea to include multiple news sources like "investing.com" and "forexfactory" and let users choose either one through a settings option

Aleksander Gladkov
4990
来自开发人员的回复 Aleksander Gladkov 2024.02.12 15:54
In version 2.5, the display of news values in the table has been fixed. As for other news sources, I do not plan to connect such an opportunity. The fact that the indicator is self-sufficient and does not require external resources, drawing all the information from the terminal is an advantage. Using the sites will lead to a significant increase in traffic.
12.02.2024 The News impact L indicator can use the site's news investing.com
طاهر
76
طاهر 2023.05.02 16:13 
 

nah, I have bought this 2 days ago, and The JOLTS Job openeing today May second, was diffrent from investing.com, it actaully gave a positive sign for the USD yet the usd went down, lucky I wasn't depending on it.

Aleksander Gladkov
4990
来自开发人员的回复 Aleksander Gladkov 2024.03.08 13:23
Hi, the News impact indicator uses the economic calendar of the MQL5 website: https://www.mql5.com/en/economic-calendar , which is also available in the MT5 terminal on the Toolbox panel Calendar tab.
Calendar data is collected from public sources and the developer of this calendar, the MQL5 website, is responsible for them.
Non-compliance of individual calendar parameters with news from the site investing.com can be discussed on the forum https://www.mql5.com/en/forum or contact the support of the MQL5 website.
Website investing.com not the only source of the economic calendar. There is https://www.forexfactory.com/calendar and probably other sources. The data on each of them may differ.
What does the indicator do:
1. Takes data from the MQL5 calendar, selecting by currency pair symbols and binds them to the terminal time. The indicator is responsible for the compliance of the data published by it with the MQL5 calendar.
2. Generates a table of economic news values with the ability to set the viewing period (Today, 4 days, Week) and selection by importance (Low, Medium, High).
3. Displays vertical lines on the chart corresponding to the moment of the news release.
4. For the published value of Actual news in the calendar, an assessment of the compliance of the value with market expectations is set: Better than expected, Worse than expected, Neutral. This characteristic is emphasized by the color: green, red, gray.
The indicator collects these characteristics for a set period and generates a "news pressure index for the current quote".
For example, if there is more "good" news for EUR and less for USD for the EURUSD pair during the period, as well as "bad" news for USD add the EUR index and "bad" for EUR add the USD index.
As a result, the indicator shows the index value in the form of BUY and SELL percentages for a currency pair.
Moreover, the last panel shows two index values: for the current time interval and for the same previous one. This allows to assess the dynamics of changes in news pressure.
5. Pie charts show the weight of news falling into the index for a set period for each symbol.
6. It should be borne in mind that the market reacts to emerging economic news, but they are not the only factor affecting the rate of the currency pair.
7. I hope that having gained experience with my indicator, you will give it an adequate assessment.
Sincerely, good luck in trading. 12.02.2024 The News impact L indicator can use the site's news investing.com : https://www.mql5.com/en/market/product/107761 08.03.2024 News impact Version 5.0 allows you to select website Investing.com as a news source However, you will additionally need the Get News5 utility, since indicators cannot receive data from websites.
Barend Herculaas Christiaan Fourie
1005
 

用户没有留下任何评级信息

Aleksander Gladkov
4990
来自开发人员的回复 Aleksander Gladkov 2023.04.03 18:51
Thank you, user reviews and suggestions help to make my products become better
wuzzy66
921
wuzzy66 2023.03.17 21:50 
 

This is a game changer indicator this indicator gives a better picture of what is happening to a particular currency pair you all know the release of forex news has a great impact on the movement of the currency pair with this indicator also gives assessment taking into account market expectations, which certainly has an impact on the future movement of the currency pairyou trade with confidence you have a clear view how who is in controll in the market either the bulls or the bears you get all statistics that allows you to make quick inform decisions you also get vertical lines informing you of upcoming news that can impact you trade the concept is so good that you can make lots of pips I wish I had known about this indicator long ago but it's never to late to start trading with confidence was actually searching for an indicator that can inform me of future coming news and previous impact on news this a real game changer made over 100 pips using this the 1st day all you need is just take time to understand key statics shown on the chat very user friendly with lots of functionality wish I could give a 10 stars

Aleksander Gladkov
4990
来自开发人员的回复 Aleksander Gladkov 2023.03.18 09:15
Thank you, the indicator not only displays the news feed with the actual values, but also gives their assessment taking into account market expectations, which certainly has an impact on the future movement of the currency pair
Satbieter
251
Satbieter 2022.03.27 09:42 
 

Very good indicator. Support is very good and suggestions are implemented quickly.

回复评论
版本 5.5 2024.06.03
1. The management of labels for levels of trend direction change has been adjusted
2. The operation of the X button has been corrected
3. Fixed the audio notification of the news publication.
4. The Custom sound file parameter has been added. The file must be located in the terminal directory\Sounds. Only WAV audio files are played.
版本 5.4 2024.05.10
1. The Display Local time parameter = true; (by default) switching the displayed time from terminal to local
2. Added the Trend calc mode=Average value of the span Min/Max; (by default) parameter
版本 5.3 2024.04.08
1. The terminal time display has been adjusted
2. Added the Display Local time = false; parameter switching the displayed time to local
版本 5.2 2024.03.15
Access to the Investing.com news file has been adjusted
版本 5.1 2024.03.10
1. The work with the Investing.com site has been corrected
2. Fixed the display of the news impact index values on the chart
版本 5.0 2024.03.08
1. Added the ability to select a news source: terminal calendar or website Investing.com (News source parameter)
To access the site, you will need the Get News5 utility: https://www.mql5.com/en/market/product/110468
and terminal setup: Allow WebRequest for News from investing.com : Tools->Options->Expert Advisors Add=https://sslecal2.investing.com
2. The trend indicator has been improved and optimized
版本 4.7 2024.02.26
1. The column of the news impact index for the previous period in the right symbols panel is excluded
2. Corrected the display of the pie chart when switching it
版本 4.6 2024.02.14
The algorithm for changing the timeframe or symbol has been adjusted
版本 4.5 2024.01.01
1. The Allow change symbol mode has been adjusted
2. Added a button to control the chart display
版本 4.4 2023.12.25
Fixed the setting for saving the indicator modes
版本 4.3 2023.12.22
Fixed the output of trend levels
版本 4.2 2023.12.19
1. Added the parameter allowing/prohibiting overloads the graph symbol : Allow change symbol = false;
2. Button for recording .CSV news file has been added
3. Added File Start Time and File End Time parameters
版本 4.1 2023.12.18
1. Clicking on the right panel overloads the chart symbol to the selected one and updates all indicator data
2. Added output to the chart of trend direction change levels for each of the five indicators
3. Added a panel with information about the profit of open positions by the symbols of the specified Magicnumber
版本 4.0 2023.12.15
When switching symbols using the right panel, the data of trend indicators is updated
版本 3.9 2023.12.12
1. Redesigned interface
2. Five customizable trend indicators have been added
3. Fixed scrolling of news in the table
4. Fixed the multiplicity of displaying vertical lines of future news
版本 3.8 2023.12.09
1. The terminal remembers the indicator settings when changing the timeframe
2. The indicator has been switched to the terminal timer
版本 3.7 2023.12.03
Added the Scale and markup parameter = 100% (default)
版本 3.6 2023.12.02
Fixed the display of vertical lines
版本 3.5 2023.12.02
A filter has been made for symbols with a dot in the name
版本 3.4 2023.11.14
1. The Start time offset to the past parameter is set in hours
2. Optimized the output of vertical news lines
版本 3.3 2023.10.29
1. Corrected the output of the current news values
2. Added VL button (Hide/Show vertical news lines on the chart)
3. The operation of the X button has been corrected (Show/Hide the indicator)
4. The parameters of the trend indicator panel have been changed
版本 3.2 2023.10.16
Added the Hide the Trend panel = false parameter;
版本 3.1 2023.10.12
Added trend indicator for two timeframes and its parameters
版本 3.0 2023.10.08
Corrected the output of information to the current news panel
版本 2.9 2023.10.04
1. Added a panel for displaying information about the current past and next news
2. Added output to the schedule of the start and close of trading sessions (London, New York, Tokyo)
3. Added a parameter that allows you to display news on the chart determined by the parameter value (convenient for indexes)
4. Added parameters:
Currency pair news = ""; //The entered value is used to display news, if not specified, then the symbol of the current chart
Show current panel = true;//panel for displaying information about the current past and next news
Show trading sessions = true; //Displays labels for the beginning and end of trading sessions (London, New York, Tokyo)
版本 2.8 2023.09.28
1. Added parameters:
Show signal arrows = true;
The size of the arrows on the chart = 2;
Show the signal value = true;
Signal Font size = 9;
2. Changed default parameter values
3. Renamed the parameter Limit the impact of news, % to The value of the news impact filter, %
版本 2.7 2023.09.09
1. In the terminal, set Options->Charts->Precise time scale
2. Vertical lines of news coming out at the same time will be displayed on the chart with some offset
3. The vertical line of the future next news is displayed on the chart to the right of the current time
4. Added Setting Ray parameter of vertical lines = false;
版本 2.6 2023.08.13
1. Vertical news lines on the chart remain after clicking the hide "X" button, if the Show vertical lines parameter = true;
2. The actual value of the news with the characteristic of impact has been added to the hint of the vertical line
版本 2.5 2023.07.20
Fixed the display of news values in the table.
版本 2.4 2023.04.03
Added parameters: Always show USD news=false; и Include USD Low news=false;
版本 2.3 2023.02.23
Fixed the error of "disappearing" the Hide button when expanding the news list
版本 2.2 2023.02.21
1. Hide news/Show news button added
2. The pie chart panel has been corrected
版本 2.1 2022.12.05
The interface has been corrected
版本 2.0 2022.09.04
Added a filter by currency pair symbols
版本 1.9 2022.04.25
Added the Show vertical lines parameter
版本 1.8 2022.04.16
Fixed the output of vertical lines marking news events on the graph
版本 1.7 2022.03.27
Added the ability to scroll the news table
版本 1.6 2022.03.25
Added the ability to switch a currency pair by clicking on the row of the ratings panel of the impact of preset pairs
版本 1.5 2022.03.24
Values for the current and previous periods have been added to the news impact results panel by the list of symbols
版本 1.4 2022.03.23
1. Added font settings
2. Added the parameter of the maximum number of rows in the viewport
版本 1.3 2022.03.22
Added a panel of resulting estimates of the impact of news on 10 currency pairs
版本 1.2 2022.03.21
Added the resulting assessment of the impact of news on the currency pair: BUY and SELL as a percentage
版本 1.1 2022.03.20
Fixed bugs