Moving Average Cross lines Alert MT5
- 指标
- Issam Kassas
- 版本: 1.10
- 更新: 4 十月 2022
- 激活: 5
Description:
For a comprehensive understanding of our indicators, we invite you to explore the entire Q&A section within this MQL5 blog post here.
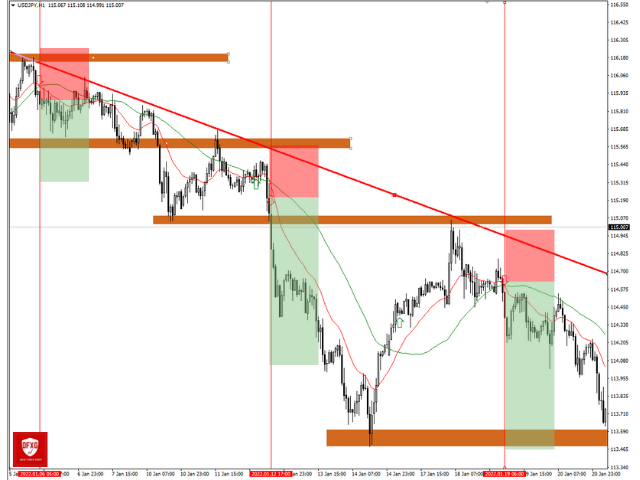
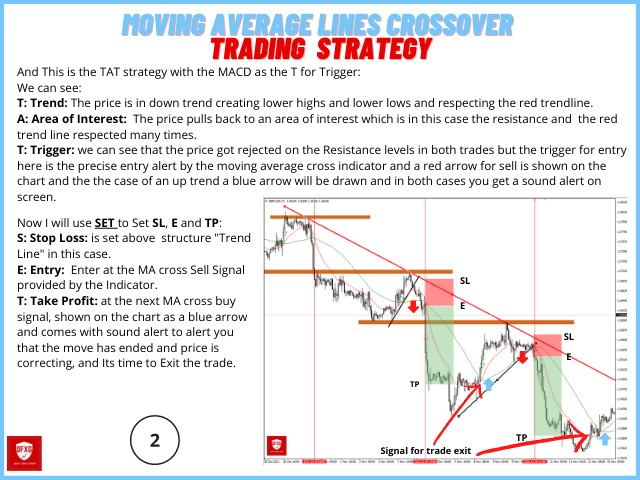
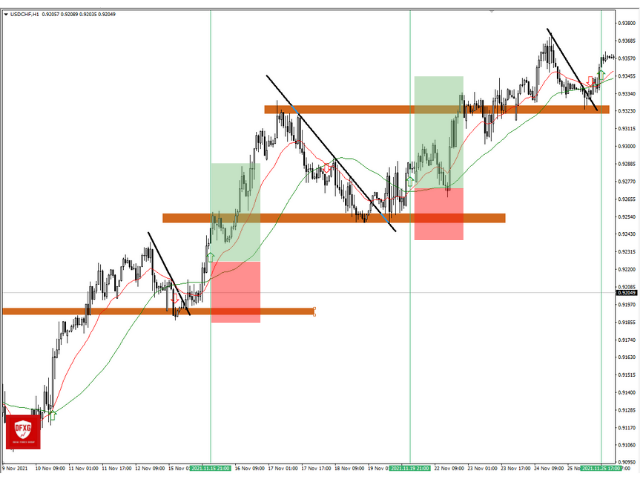
The "Moving Average Lines Crossover with Alert" is a valuable technical analysis tool designed to help traders identify potential trend reversals and trading opportunities. Seamlessly integrated into your trading platform, this indicator empowers you with essential data to make well-informed trading decisions.
Spot Trend Reversals: Utilize the power of moving averages to identify trend reversals in the market. The crossover of different moving average lines can signal potential changes in the direction of the price movement.
Customizable Moving Averages: Tailor the indicator to match your trading preferences. Choose from various types of moving averages, such as simple, exponential, or weighted, and adjust their periods to suit your trading style.
Cross-Platform Compatibility: The "Moving Average Lines Crossover with Alert" is compatible with multiple trading platforms, making it accessible to traders using different software.
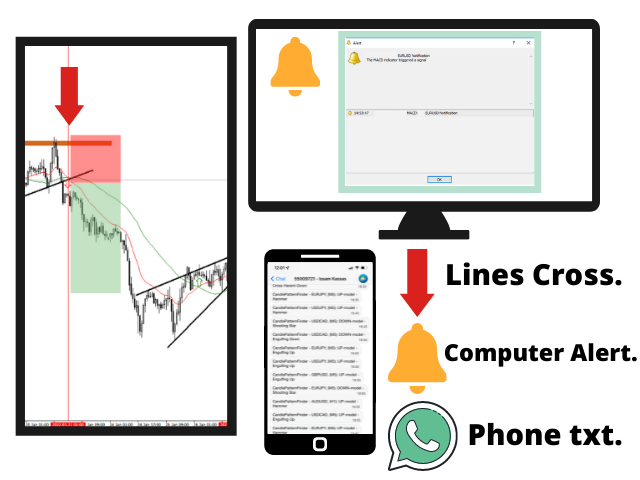
Stay Informed with Alerts: Never miss a trading opportunity with the built-in alert system. Receive notifications when moving average lines cross over, allowing you to take timely actions.
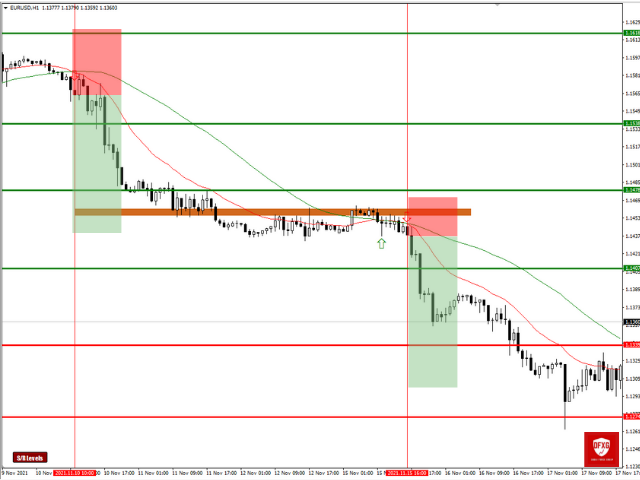
Confirmation with Other Indicators: Combine the crossover signals from this indicator with other technical analysis tools, such as oscillators or support/resistance levels, to confirm potential trading opportunities.
Distinguish Between Moving Average Crossovers: Learn to differentiate between golden cross (bullish signal) and death cross (bearish signal) formations to make more accurate trading decisions.
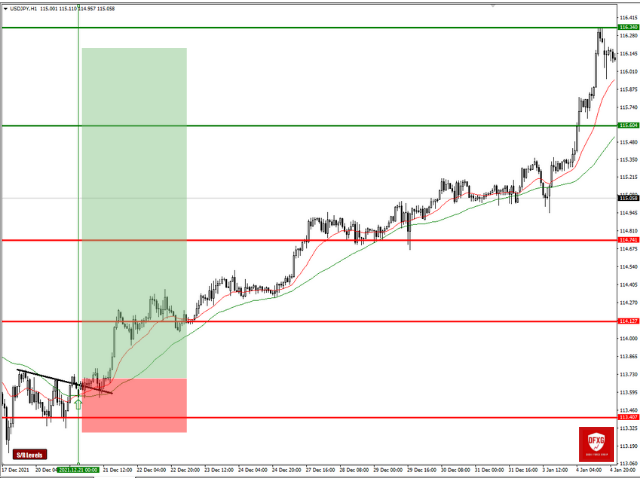
Trend Confirmation: Use moving average crossovers to confirm the strength of an existing trend. A bullish crossover above a long-term moving average can signal a robust uptrend, while a bearish crossover below a long-term moving average may indicate a strong downtrend.
Apply to Multiple Timeframes: The "Moving Average Lines Crossover with Alert" can be applied to various timeframes, from short-term intraday trading to long-term position holding, allowing you to adapt to different market conditions.
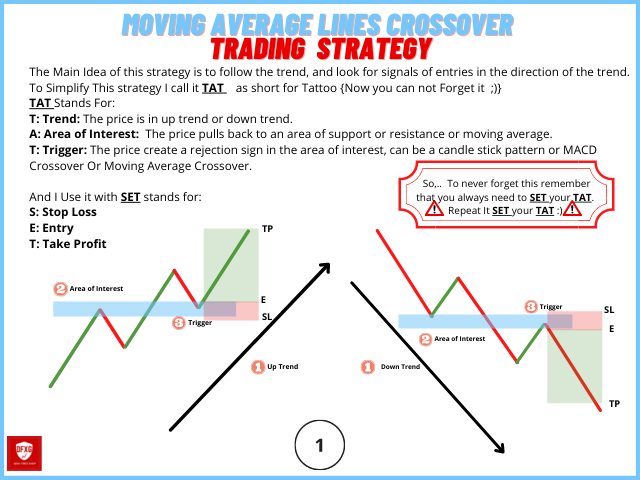
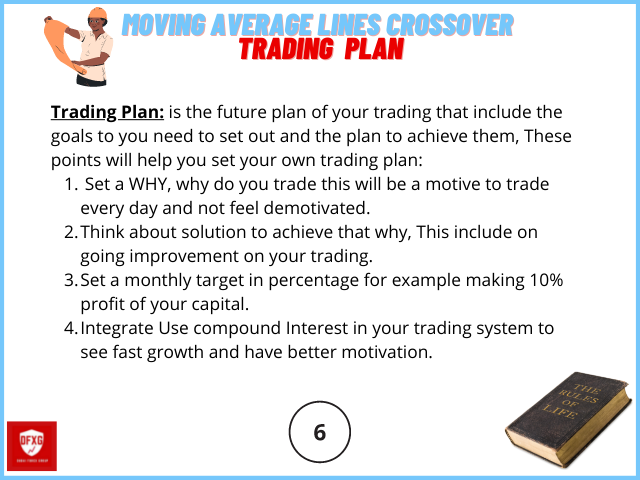
Trend Following and Reversal Trading: Incorporate the indicator into your trend-following or trend-reversal trading strategies. Combine it with other technical tools to build a comprehensive trading plan.
Risk Management: Remember that trading involves risk, and past performance is not indicative of future results. Always use proper risk management practices and avoid trading based solely on indicator signals.
Seamless Installation: The "Moving Average Lines Crossover with Alert" can be effortlessly installed and set up in your trading platform. Start using the indicator right away to enhance your trading experience.
Stay Disciplined: Maintain a disciplined trading approach by using the "Moving Average Lines Crossover with Alert" as a supportive tool in your overall trading strategy.

مؤشر ممتاز انصح باستخدامه شكرا لك أخي عصام
Pls stay tuned for future tools I also have new Trade assistant manager to better manage risk you can check it out here: https://www.mql5.com/en/market/product/82372?source=Site+Profile+Seller