• 概述
  • 评论
  • 评论

Reservoir mt4

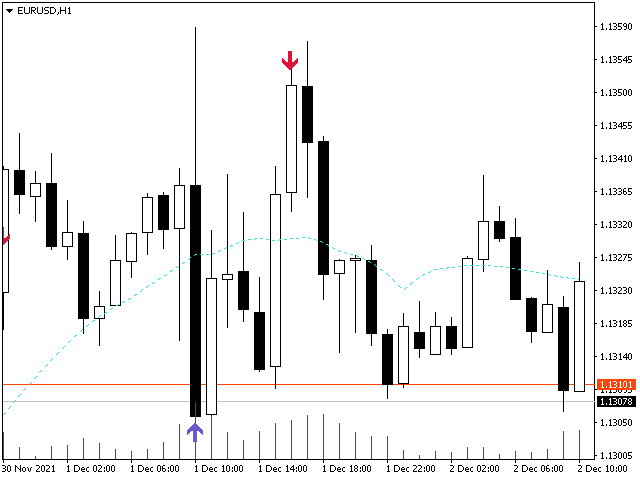
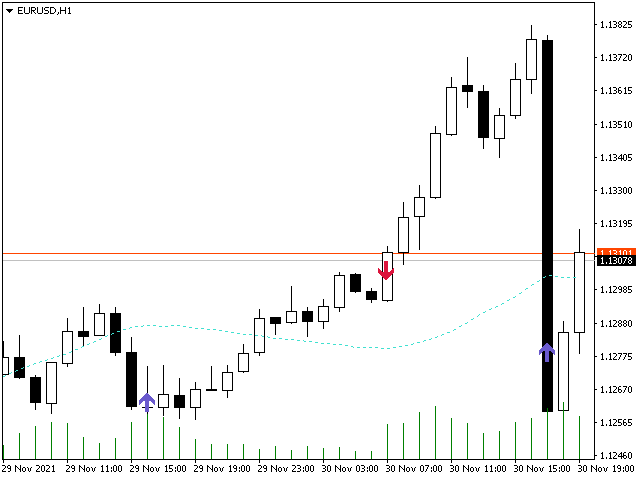
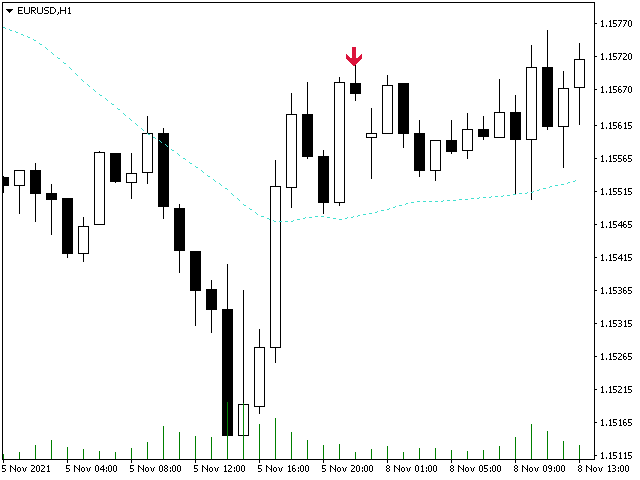
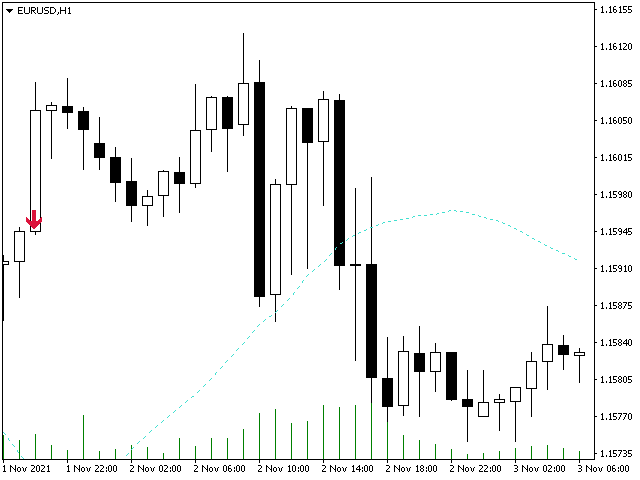
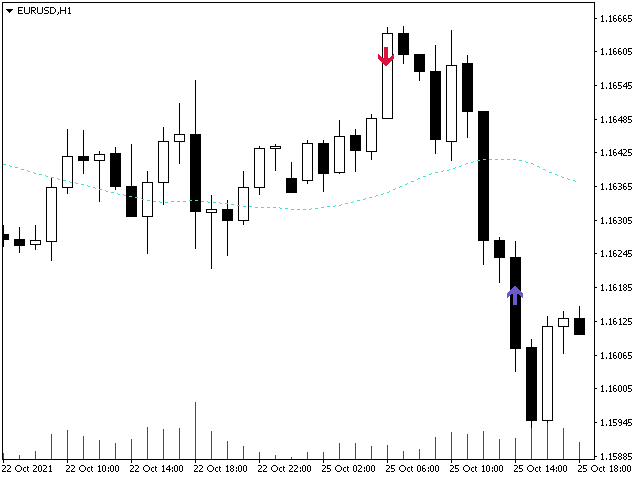
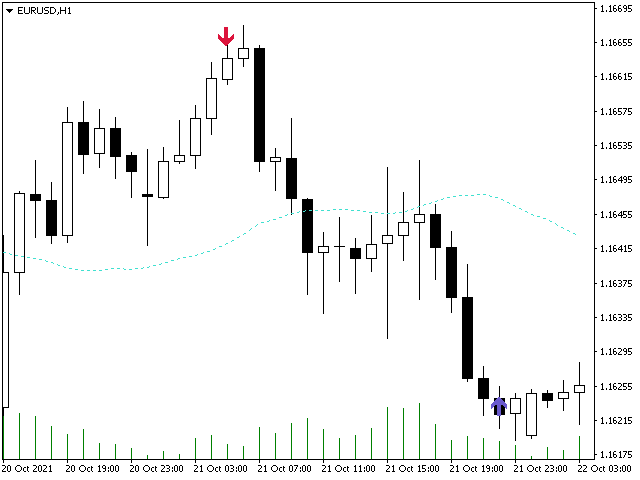
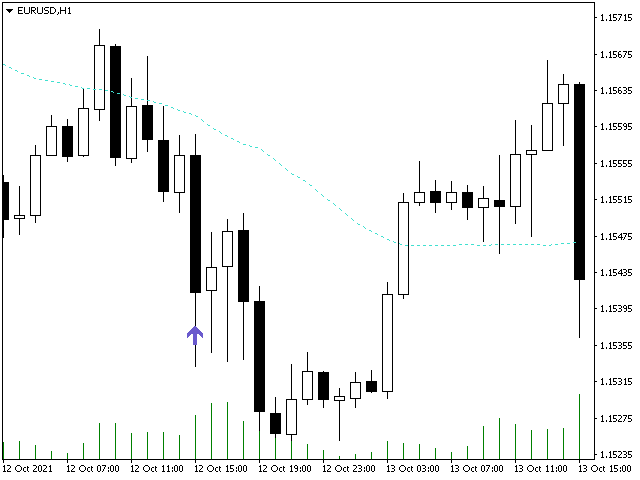
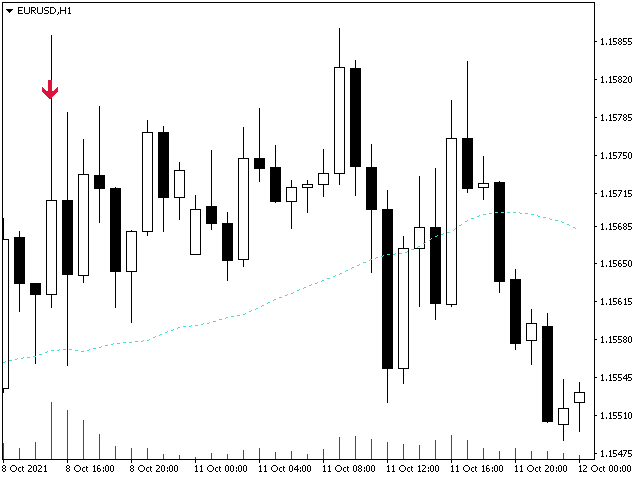
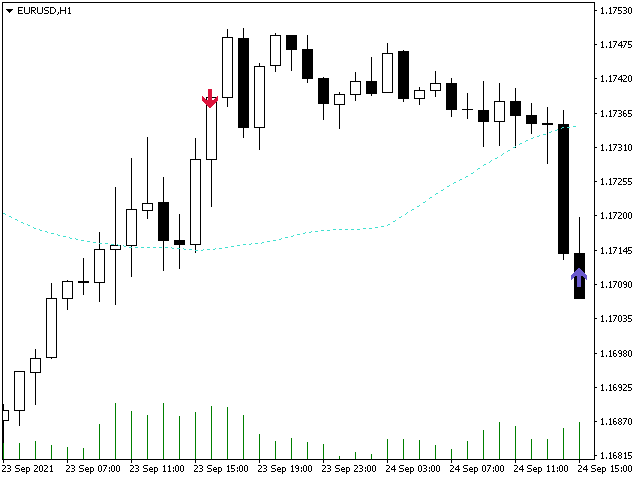
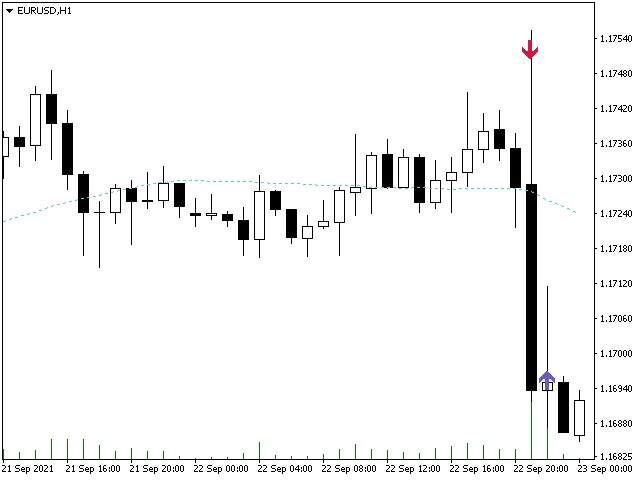
Reservoir is a reversal indicator and is part of a special category of instruments. The indicator not only analyzes the price movement, but also indicates the points of possible reversals. This contributes to the quick and optimal opening of buy or sell orders (depending on the current situation). In this case, the historical data of the analyzed asset is necessarily taken into account. It is the correct implementation of such actions that in many ways helps traders make the right decision in time and get a profit.

The indicator helps to analyze the market on the selected time interval. It determines the prevailing trend, makes it possible to classify the direction of the price movement, determining its strength. Solving this problem helps investors. Ready trading system.
推荐产品
Haine
Yvan Musatov
Haine is a reversal indicator that is part of a special category of instruments. The indicator not only analyzes the price movement, but also indicates the points of possible reversals. This facilitates fast and optimal opening of buy or sell orders (depending on the current situation). In this case, the historical data of the analyzed asset must be taken into account. It is the correct execution of such actions that largely helps traders to make the right decision in time and get a profit. T
A top-quality from the famous XSuper Trend indicator. It is completely loyal to the original algorithm, and implements many useful features Which includes Trend Indicators as Filters like MACD,CCI and Alligator. The Chefs Super Trend Plus Indicator is a great way to identify the current market trend. The indicator shows a clear distinction between uptrends and downtrends. The indicators has optional filters for sound signal. Suitable for the following trending pairs: EUR/USD, GBP/USD, USD/JPY,
SFO Trend Racer
Tevin Marshall
5 (1)
SFO Trend Racer system is a trend indicator created by the CEO and Founder of " Simple Forex Options ", Tevin Marshall . It serves 6 different functions all in one. It shows the trader the entry signals as well as exit signals, whether it is a take profit or a stop loss. It also uses trend filters and signal confirmations so that the trader is able to make the most logically fit decision. Trend Racer uses various filters and specific settings from a plethora of indicators. The beauty in this ind
HeikenashiSmoothing
Rodolfo Leonardo De Morais
Heiken ashi Smoothing in separate window MTF The color of the Heiken-Ashi candles depend on their shadows. The advantage of the Heiken-Ashi chart is that the trend is determined very simply, the upward-facing sails are blue, and the downward-tendency sails are red. For profitable trading it is necessary to use it with the standard candles (make analyzes) and with the other indicators. Indicator Parameters TimeFrame - Graphic time being 0 = Current graph time, 1 = M1, 5 = M5, 15 = M15, 30 = M30
MetaCOT 2 is a set of indicators and specialized utilities for the analysis of the U.S. Commodity Futures Trading Commission reports. Thanks to the reports issued by the Commission, it is possible to analyze the size and direction of the positions of the major market participants, which brings the long-term price prediction accuracy to a new higher-quality level, inaccessible to most traders. These indicators, related to the fundamental analysis, can also be used as an effective long-term filter
FBO Impact
Abayomi Bello
FBO Impact  is a professional yet simple to use trend following system. It detects the prevailing trend and gives entry points after pullbacks to significant price levels. To determine the trend it uses a unique filtering algorithm. Suitable for defining entry points for scalping as well as for intra-day trading. Features Works with the prevailing market trend. Suitable for all currency pairs. Ideal for all time frames but higher time frames are recommended. Does not redraw/repaint the arrows on
RSI Divergence Scanner
Reza Aghajanpour
4.5 (14)
** All Symbols x All Timeframes scan just by pressing scanner button ** ***Contact me after purchase to send you instructions and add you in "RSI scanner group" for sharing or seeing experiences with other users. Introduction RSI divergence is a main technique used to determine trend reversing when it’s time to sell or buy because prices are likely to drop or pick in the charts. The RSI Divergence indicator can help you locate the top and bottom of the market. This indicator finds Regular div
Smart Indicatorl
Mustain Jiddan Mubarak Zaka
The Indicator Has signal with wait ,  Ready To Buy and Ready To Sell to make you ready to execute when signal coming , it very easy to use and very profitable , good for forex , Binary or crypto and GOLD , you just wait and execute , no need to analysis , because it already analysis by indicator , for exsample Wait than ready to buy or ready to sell than buy or sell you just entry as per instruction of indicator , very easy and usefull
This indicator is based on the standard MACD indicator, but showing the changes up and down colored. It is a nice assistance to visualize our Expert MAGIC MACD. MAGIC MACD MT4: https://www.mql5.com/en/accounting/buy/market/41144?period=0 MAGIC MACD MT5: https://www.mql5.com/en/accounting/buy/market/41151?period=0 Inputs in the Indicator: Fast EMA: standard is 12 Slow EMA: standard is 26 Signal: depending on what you want to see. For the MAGIC MACD the standard is 1 in common settings: Fixe
RSI Jurik
Augustine Kamatu
Introducing RSI Jurik—an innovative indicator designed to revolutionize your forex trading strategy by combining custom moving averages based on the Relative Strength Index (RSI) with the MetaTrader 4 indicator, RSI. Jurik moving averages are renowned for their accuracy and reliability in analyzing price movements in the forex market. They provide traders with smoother representations of price action, reducing noise and offering clearer signals for identifying trends and potential reversals.
FREE
Multi Channel Trend
Muhammed Emin Ugur
The Multi Channel Trend indicator was developed to help you determine the trend direction by drawing channels on the graphical screen. It draws all channels that can be trending autonomously. It helps you determine the direction of your trend. This indicator makes it easy for you to implement your strategies. The indicator has Down trend lines and Up trend lines. You can determine the price direction according to the multiplicity of the trend lines. For example , if the Down trend lines start to
About
Tatiana Savkevych
About - Forex indicator. This trend indicator is used to determine the current trend in price movement, making it clear in which direction it is better to open a position: buy or sell. The About trend indicator is displayed on the chart and moves in parallel with the price. The Forex About trend indicator allows you to determine in time a change in the direction of price movement, thereby minimizing the likelihood of capital loss. In trading practice, various combinations of About and other ind
Contact me for instruction, any questions! Introduction Triangle chart patterns are used in   technical analysis , which is a trading strategy that involves charts and patterns that help traders identify trends in the market to make predictions about future performance.   Triangle Pattern Scanner Indicator It is usually difficult for a trader to recognize classic patterns on a chart, as well as searching for dozens of charts and time frames will take time, and there is also a possibility of a
Oscillator helps determine the direction of the market Shows the direction of the price movement and is painted in the appropriate color. Allows you to conduct trend and counter trend trading It works on all timeframes, on any currency pairs, metals and cryptocurrency Can be used when working with binary options Distinctive features Does not redraw; Simple and clear settings; It works on all timeframes and on all symbols; Suitable for trading currencies, metals, options and cryptocurrency (Bitco
FREE
Arrow Effect
Nadiya Mirosh
Using the Arrow Effect forex indicator algorithm, you can quickly understand what kind of trend is currently developing in the market. The Elephant indicator accompanies long trends, can be used without restrictions on instruments or timeframes. With this indicator, you can try to predict future values. But the main use of the indicator is to generate buy and sell signals. The indicator tracks the market trend, ignoring sharp market fluctuations and noises around the average price. The indicator
MetaCOT 2 COT Index MT4
Vasiliy Sokolov
3 (2)
MetaCOT 2 is a set of indicators and specialized utilities for the analysis of the U.S. Commodity Futures Trading Commission reports. Thanks to the reports issued by the Commission, it is possible to analyze the size and direction of the positions of the major market participants, which brings the long-term price prediction accuracy to a new higher-quality level, inaccessible to most traders. These indicators, related to the fundamental analysis, can also be used as an effective long-term filter
Arrow indicator, to determine adjustments and local trends The arrow appears on the current bar and after closing the bar will not disappear. Allows you to enter the transaction at the very beginning of the movement Thanks to the flexible settings you can use on any currency pairs, metals and cryptocurrency Can be used when working with binary options Distinctive features Does not redraw. Additional parameters for fine tuning. Works on all timeframes and symbols. Suitable for trading c
Valiant Strong Trend
Muhammed Emin Ugur
" Valiant Strong Trend " - Your Ultimate MT4 Signal Indicator Are you ready to elevate your trading game to new heights? Look no further than the "Valiant Strong Trend" MT4 signal indicator, your indispensable tool for navigating the complex world of financial markets. Key Features: Precise Trend Identification : "Valiant Strong Trend" employs advanced algorithms to accurately identify market trends, whether they are bullish or bearish. Say goodbye to guesswork and hello to informed trading deci
Skynet Lasso
Roman Yablonskiy
This indicator displays entry and exit points in the market. The indicator is based on Parabolic and various mathematical and statistical methods to increase profitability and reduce the number of losing trades. The indicator helps in many cases to skip false inputs, the support and resistance lines go around the price in a certain mode, reducing losses. The dashboard shows the results of the indicator so that you can adjust it more accurately and see how the parameters affect the result. The
With the MACD Multi Time Frame indicator you can spot divergences of higher timeframes while you are searching for pinpointed entries on lower timeframes. This blog post gives you real-time MACD Divergence Analysis for free and tips how to trade the divergences: Real-Time MACD Divergence Analysis The MACD Multi Time Frame gives you an very good overview of what is happening on higher timeframes without the need of switching to the higher timeframe. You will e.g. always see the MACD value of the
The Momentum Standard/Hidden Divergence indicator will plot the momentum, and will also identify and plot standard (regular) divergences between the indicator and the price action, OR it can be set to identify and plot hidden (reverse) divergences between the indicator and the price action. The divergences themselves are implemented as lines (default green for bullish divergence and red for bearish divergence) drawn in the indicator pane. If activated via the Inputs dialog, alerts will be genera
Fibonacci CSM
Emir Revolledo
5 (1)
Fibonacci Currency Strength Meter (FCSM) Early Access Sale!! This new product is still in the process of adding new features and settings. For early bird buyers. The Price will be 50% Sale. In a few weeks, the product will be done. Go Grab your copy while it's still cheap. More details will be added soon. Things to be added. Alert Levels Mobile and Email Alert From it's name, Fibonacci Currency Strength Meter is a combination of Fibonacci levels and Currency Strength Meter. The plot of Fib
MACD (short for Moving Average Convergence/Divergence) is one of the most famous and oldest indicators ever created and is widely used among beginners . However, there is a newer version of the MACD that is named Impulse MACD  which have less false signals than the standard MACD. Classic MACD helps us to identify potential trends by displaying crossovers between two lines. If MACD line crosses above the Signal line it shows us that the market is potentially up trending and that it would be a go
Easy RSI Alerts
Luke Kendall
5 (1)
The Relative Strength Index (RSI) was developed by J. Welles Wilder and is a momentum oscillator that identifies overbought and oversold conditions. It is also a popular choice for many traders helping them find entries into the market. How it Works The simplest way to use the Relative Strength Index is to wait for an overbought or oversold condition and then enter into a trade when the RSI indicates that price is resuming in the dominant direction of the trend. Buy signals : For the first con
EW Oscillator PRO
Evgeny Belyaev
3 (2)
EW Oscillator PRO is an indicator for MetaTrader 4 based on mathematical calculations on the price chart. This is one of the most common and useful indicators for finding the trend reversal points. EW Oscillator PRO is equipped with multiple types of notification (push notifications, emails, alerts), which allows opening trades in time. A panel for displaying the information on the indicator signals from different timeframes is located in the top left corner (see screenshot #2). Distinctive fe
MACDivergence MTF
Pavel Zamoshnikov
4.29 (7)
Advanced ideas of the popular MACD indicator: It detects and displays classic and reverse divergences (three methods of detecting divergences). It uses different color to highlight an uptrend and a downtrend. Two methods of determining a trend: а) MACD crosses the 0 level (classic signal); б) MACD crosses its own average (early signal). This is a multi-timeframe indicator: it can display MACD data from other timeframes. Two methods of drawing: classic histogram and line. It generates sound and v
MACDXover
Muhammad Robith
This indicator helps you to find price that may cause MACD Signal crossover on the current bar.. These crossover points are depicted in form of stars (like Parabolic SAR). prevEMA line also helps you to decide the trend. Get 20% OFF for rents for 1 year! How to use: MACDSignalStars (Violet) stars displayed are the the prices that make the MACDmain = MACDsignal. If the close price is higher than the star, then MACDmain > MACD signal. If the close price is lower than the star, then MACDmain
ZhiBiCCI MT4
Qiuyang Zheng
5 (1)
【ZhiBiCCI】指标适合所有的周期使用,也适合所有的市场品种。 【ZhiBiCCI】绿色实线是逆转看涨背离。绿色虚线是经典的看涨背离。 【ZhiBiCCI】向红色实线是反向看跌背离。红色虚线是古典看跌背离。 【ZhiBiCCI】可以在参数里面设置(Alert、Send mail、Send notification),设置为(true)就可以发送即时信号到警报窗口、电子邮件、即时消息。 参数设置说明: 【displayAlert】:这是警报开关,设置成true,如果出现箭头就会自动警报提示;设置成false,则不会警报提示。 【sendmail_NO_OFF】:这是发送邮件的开关,设置成true,如果出现箭头就会发送邮件到你在MT4设置好的邮箱里面;设置成false,则不会发邮件。 【sendnotification_NO_OFF】:这是发送即时消息的开关,设置成true,如果出现箭头就会发送消息到你的移动设备;设置成false,则不会发消息。 更多好用的指标网址: https://www.mql5.com/en/users/zhengqiuyang/seller
Macd 2 线指标与交易箭头。 包括: MACD信号和MACD线 2 颜色直方图 0级 可能的贸易箭头 如何阅读 : 交叉发生后,指标会给您一个箭头,并且快线位于零线上方或下方! 使用适当的风险管理,不要根据高波动性新闻进行交易! 查看其他产品: https://www.mql5.com/en/users/gabedk/seller Macd 2 xiàn zhǐbiāo yú jiāoyì jiàntóu. Bāokuò: MACD xìnhào hé MACD xiàn 2 yánsè zhífāng tú 0 jí kěnéng de màoyì jiàntóu rúhé yuèdú: Jiāochā fāshēng hòu, zhǐbiāo huì gěi nín yīgè jiàntóu, bìngqiě kuài xiàn wèiyú líng xiàn shàngfāng huò xiàfāng! Shǐyòng shìdàng de fēngxiǎn guǎnlǐ, bùyào gēnjù gāo bōdòng xìng xīnwén j
FREE
TSO Top Bottom Divergence MACD
Dionisis Nikolopoulos
5 (1)
This indicator combines double bottom and double top reversal chart patterns together with detection of divergences between the price chart and the MACD oscillator. Features Easily detect strong reversal signals Allows to use double top/bottom and MACD divergence signals combined or independently Get email and/or push notification alerts when a signal is detected Custom colors can be used The indicator is not repainting Can easily be used in an EA (see below) Inputs ENABLE Double Top - Botto
该产品的买家也购买
TPSpro RFI Levels
Roman Podpora
4.85 (20)
Reversal First Impulse levels (RFI)    INSTRUCTIONS        RUS       -       ENG              R ecommended to use with an indicator   -   TREND PRO -  Version MT5 A key element in trading is zones or levels from which decisions to buy or sell a trading instrument are made. Despite attempts by major players to conceal their presence in the market, they inevitably leave traces. Our task was to learn how to identify these traces and interpret them correctly. Main functions: Displaying active zones
Atomic Analyst
Issam Kassas
5 (3)
首先值得强调的是,该交易指标是非重绘、非延迟的指标,这使其成为手动和机器人交易的理想选择。 用户手册:设置、输入和策略。 Atomic Analyst是一种PA价格行动指标,利用价格的力量和动量来寻找市场上更好的机会。配备了高级过滤器,可帮助去除噪音和假信号,并提高交易潜力。使用多层复杂的指标,Atomic Analyst扫描图表,并将复杂的数学计算转化为任何初学者都能理解并用来做出一致交易决策的简单信号和颜色。 “Atomic Analyst”是专为新手和经验丰富的交易者量身定制的综合交易解决方案。它将高级指标和一流功能融合为一体的交易策略,使其成为所有类型交易者的多功能选择。 日内交易和剥头皮策略:专为快速准确的日内交易和短期交易而设计。 日内和摆动交易策略:可用作追求价格大幅波动的日内和摆动交易者的可靠工具。 多货币和市场:凭借其可靠的精度,在不同的工具和市场上运作。 多个时间框架:可在多个时间框架上使用,性能良好。 稳定性:所有指标均不重绘、不重绘和不滞后,确保可靠的信号。 信号清晰度:提供箭头信号,用于清晰的入场和出场点。 实时警报:通过交易入场、SL和TP警报通知交
TPSproTREND PrO
Roman Podpora
4.78 (18)
TPSpro TRENDPRO  - is a trend indicator that automatically analyzes the market and provides information about the trend and each of its changes, as well as giving signals for entering trades without redrawing! The indicator uses each candle, analyzing them separately. referring to different impulses - up or down impulse. Exact entry points into transactions for currencies, crypto, metals, stocks, indices!  -  Version MT5               DETAILED DESCRIPTION                R ecommended to use with
Scalper Inside PRO
Alexey Minkov
4.74 (58)
An exclusive indicator that utilizes an innovative algorithm to swiftly and accurately determine the market trend. The indicator automatically calculates opening, closing, and profit levels, providing detailed trading statistics. With these features, you can choose the most appropriate trading instrument for the current market conditions. Additionally, you can easily integrate your own arrow indicators into Scalper Inside Pro to quickly evaluate their statistics and profitability. Scalper Inside
目前八折优惠! 对任何新手或专家交易者来说都是最好的解决方案! 这个仪表板软件适用于28种货币对。它基于我们的两个主要指标(高级货币强度28和高级货币冲动)。它对整个外汇市场提供了一个伟大的概述。它显示高级货币强度值,货币运动速度和28个外汇对在所有(9)时间段的信号。想象一下,当你可以使用图表上的单一指标观察整个市场,以确定趋势和或剥头皮的机会时,你的交易将得到改善 我们已经在这个指标中建立了一些功能,使你更容易识别强势和弱势货币,同时识别和确认潜在的交易。该指标以图形方式显示货币的强势或弱势是增加还是减少,以及它在所有时间段的表现。 增加的新功能是动态市场斐波那契水平,它适应当前的市场条件变化,这是一个已经在我们的高级货币强度28和高级货币冲动指标中使用的成熟的加分项。 在交易时,总是将弱势货币和强势货币配对,这个新指标将帮助你做到这一点。 用户手册:点击这里  https://www.mql5.com/en/blogs/post/708783 特点  显示每个时间段的ACS28和GAP-speed(冲动)的货币强度值。 列:颜色代码以7种颜色
FX Volume
Daniel Stein
4.6 (35)
通过 mql5 和 Telegram 上 的 " 晨间简报 "获取每日市场更新,包括详细信息和屏幕截图 ! 外汇交易量(FX Volume)是第一个也是唯一一个从经纪商角度真正洞察市场情绪的交易量指标。 直接在您的图表上看到这些信息是真正改变游戏规则和突破性的交易解决方案。 受益于独特的市场数据洞察,如 比率(Ratios )显示货币多头和空头头寸的比率(百分比 比率变化 显示所选时间段内的多头比率及其百分比变化 总交易量 显示货币的总交易量(多头和空头),以手为单位 多头 交易量显示货币所有多头头寸的交易量 空头 交易量显示所有货币空头头寸的交易量 净多头 显示净多头交易量,即所有多头头寸减去所有空头头寸(以手为单位)。 净多头百分比 显示货币净多头交易量的变化 请阅读我们的基本教程 -> "如何使用外汇交易量进行交易 " 获取更多信息,如常见问题、交易技巧和教程视频,请访问我们的 外汇交易量公共信息频道 请 安装并运行 SI Connect 以建立与我们数据中心的持续连接 背景信息 我们都知道,外汇是一个分散的市场。这就是为什么我们必须打破常规思维,开发一个独
Enigmera
Ivan Stefanov
5 (3)
ENIGMERA:市场核心 https://www.enigmera.com 简介 该指标和交易系统是金融市场的一种非凡方法。ENIGMERA 利用分形周期精确计算支撑位和阻力位。它能显示真实的累积阶段,并给出方向和目标。 该系统无论在趋势中还是在修正中都能发挥作用。 它是如何运行的? ENIGMERA 由三条线组成:支撑/阻力线、目标线和偏离线。与一般市场指标将过去的数据推断为现在和未来的情况不同,该系统能提供当前的完整情况。如果你处于支撑位,这意味着真正的支撑;如果你处于阻力位,这意味着真正的阻力。如果突破某一水平,则表示趋势发生变化。没有重绘。 由于市场在不断变化,ENIGMERA 不断调整其评估工具,定期修改策略。  这保证了每种情况都能得到全面评估。这一市场指标的独特性显而易见,其能力不言而喻。  ENIGMERA 为金融分析师和咨询师提供服务,他们需要可靠的见解与客户分享,也为投资者提供服务,他们需要最精确和最可靠的保证。 该系统能够达到最佳精度,使交易者能够自信、清晰地评估他们的选择。 ENIGMERA 将 20 年的交易专长和知识整合到一个综合软件
GOLD Impulse with Alert
Bernhard Schweigert
4.56 (9)
这个指标是我们2个产品 Advanced Currency IMPULSE with ALERT  +   Currency Strength Exotics 的一个超级组合。 它适用于所有时间框架,并以图形方式显示8种主要货币和一种符号的强势或弱势冲动! 该指标专门用于显示任何符号的货币强度加速,如黄金、异国货币对、商品、指数或期货。这是它的第一个指标,任何符号都可以被添加到第9行,以显示黄金、白银、石油、DAX、US30、MXN、TRY、CNH等的真实货币强度加速(冲动或速度)。 建立在新的基础算法上,它使识别和确认潜在的交易更加容易。这是因为它以图形方式显示了一种货币的强势或弱势是否正在加速,并测量了这种加速的速度--把它想象成你汽车中的速度表。当你加速时,事情显然会发生得更快,这在外汇市场上也是一样的,即如果你配对的货币正在向相反的方向加速,你就会发现一个潜在的有利可图的交易。 动态市场斐波那契28水平被用作警报触发器,将适应市场活动。如果冲动击中黄色触发线,你将收到警报。然后你就知道作为一个交易员应该做什么。货币对和方向已经给出。只需点击警报按钮,就可以
ON Trade Optuma Astro
Abdullah Alrai
5 (4)
当然可以!以下是您提供的文本的中文翻译: 引入 MT4 天文指标:您的终极天体交易伙伴 您准备好将交易体验提升到天文高度了吗?不用再寻找,就在我们的革命性 MT4 天文指标中。这个创新工具超越了传统的交易指标,利用复杂的算法提供无与伦比的天文洞察力和精确计算。 指尖上的宇宙信息: 瞻仰一个详尽的面板,展示了一宝藏般的天文数据。了解行星的地理/太阳心坐标,太阳/地球距离,亮度,伸长度,星座,黄道和赤道坐标,甚至是水平坐标——每个细节都经过精心计算并呈现得美轮美奂。指标生成的垂直线对应于时间值,为您的交易旅程提供了宇宙的视角。 行星线条与关系: 在您的图表上欣赏行星线条的魔力,具有可自定义的比例和角度。通过直观的控制面板轻松切换每个行星线条的可见性。通过连结、六分、四分、三分、对冲和逆行等指标,发现行星关系的艺术。在您选择的时间范围内探索这些宇宙构造,使您能够识别重要的交易机会。 揭示甘恩的智慧: 通过受甘恩启发的平方垂直线揭示潜在的反转时机。这种创新修改将甘恩历经考验的原则带入现实,帮助您提前了解市场的转向和趋势。 月亮引导: 在您的图表上优雅地导航月相,因为新月和满月点缀其间。月亮周期
Please send me Direct message on MQL5 CHAT after purchasing the Indicator for Training and Installation Support There are some additional files that is important to use with the Indicator . So be sure to contact me after purchasing the Indicator So that I can add you for training and support . If you find any difficulty with installation then send me Direct message here So that I can connect with you via Anydesk or Teamview for the product installation. " Smart Order Block Indicator " to find
Currency Strength Exotics
Bernhard Schweigert
4.88 (33)
目前8折优惠! 对任何新手或专家交易者来说都是最好的解决方案! 这个指标是专门用来显示任何符号的货币强度,如异国货币对、商品、指数或期货。它是同类产品中的第一个,任何符号都可以添加到第9行,以显示黄金、白银、石油、DAX、US30、MXN、TRY、CNH等的真实货币强度。这是一个独特的、高质量的、负担得起的交易工具,因为我们已经纳入了一些专有的功能和一个新的公式。想象一下,你的交易将如何改善,因为你能够准确地确定新趋势或剥头皮机会的触发点? 用户手册:点击这里   https://www.mql5.com/en/blogs/post/708876 它适用于所有时间框架。你将很快能够看到TREND! 根据新的基础算法设计,它使识别和确认潜在交易变得更加容易。这是因为它以图形方式显示了8种主要货币和一种符号的强弱。 该指标显示了8种主要货币(澳元加元瑞士法郎欧元英镑日元新西兰美元)的强弱线,再加上一个符号! 该指标显示了符号的真实价值。例如:对于XAUUSD(黄金):价格以美元报价。如果黄金在上涨,你怎么能知道是黄金的强势还是美元的弱势?只有当黄金走强时,我们才会进行
ECM Channel MT4
Paulo Rocha
5 (1)
ECM Elite Channel is a volatility-based indicator, developed with a specific time algorithm, which consists of finding possible corrections in the market. This indicator shows two outer lines, an inner line (retracement line) and an arrow sign, where the channel theory is to help identify overbought and oversold conditions in the market. The market price will generally fall between the boundaries of the channel. If prices touch or move outside the channel, it's a trading opportunity. The
Indicator : RealValueIndicator Description : RealValueIndicator is a powerful tool designed specifically for trading on the EURUSD pair. This indicator analyzes all EUR and USD pairs, calculates their real currency strength values, and displays them as a single realistic value to give you a head start on price. This indicator will tell you moves before they happen if you use it right. RealValueIndicator allows you to get a quick and accurate overview of the EURUSD currency pair tops and bottoms,
Up down v6T
Guner Koca
5 (1)
Thise indicator is up down v6  comes with tradingwiev pinescript. purchased people, after installed on terminal ,contact me on mql5  to get BONUS  TradingView pinescript. up-down indicator is no repaint and works all pairs and lower than weekly time frames charts. it is suitable also 1 m charts for all pairs. and hold long way to signal. dont gives too many signals. when red histogram cross trigger line that is up signal.and price probably will down when blue histogram cross trigger line that
Introduction to X3 Chart Pattern Scanner X3 Cherart Pattern Scanner is the non-repainting and non-lagging indicator detecting X3 chart patterns including Harmonic pattern, Elliott Wave pattern, X3 patterns, and Japanese Candlestick patterns. Historical patterns match with signal patterns. Hence, you can readily develop the solid trading strategy in your chart. More importantly, this superb pattern scanner can detect the optimal pattern of its kind. In addition, you can switch on and off individu
TrendMaestro
Stefano Frisetti
5 (3)
note: this indicator is for METATRADER4, if you want the version for METATRADER5 this is the link:  https://www.mql5.com/it/market/product/108106 TRENDMAESTRO ver 2.4 TRENDMAESTRO recognizes a new TREND in the bud, he never makes mistakes. The certainty of identifying a new TREND is priceless. DESCRIPTION TRENDMAESTRO identifies a new TREND in the bud, this indicator examines the volatility, volumes and momentum to identify the moment in which there is an explosion of one or more of these data a
XQ Indicator MetaTrader 4
Marzena Maria Szmit
3.67 (3)
Step into the realm of Forex trading with confidence and precision using XQ, a cutting-edge Forex indicator designed to elevate your trading game to unprecedented heights. Whether you're a seasoned trader or just stepping into the world of currency exchange,   XQ Forex Indicator   empowers you with the insights and signals needed to make informed trading decisions. The signal conditions are a combination of three indicators, and XQ Forex Indicator only display  medium and long-term trends . The
Quantum Trend Sniper Indicator MT4
Bogdan Ion Puscasu
4.6 (40)
介绍   量子趋势狙击指标 ,突破性的 MQL5 指标,正在改变您识别和交易趋势反转的方式!由拥有超过13年交易经验的资深交易员团队开发,     量子趋势狙击指标   旨在通过其创新的方式以极高的准确度识别趋势反转,将您的交易之旅推向新的高度。 ***购买量子趋势狙击指标,即可免费获得量子突破指标!*** 当量子突破指标识别出趋势反转时,它会向您发出警报和信号箭头,并建议您三个止盈水平。 它既适合新手交易者,也适合专业交易者。 量子 EA 通道:       点击这里 MT5版本:       点击这里 建议: 时间范围:  所有时间范围。为了获得最佳结果,我们建议在 M15、M30 和 H1 时间范围内使用它。 货币对:欧元兑美元、英镑兑美元、澳元兑美元、欧元兑英镑, EURAUD, XAUUSD 账户类型:ECN、Raw 或 Razor,点差极低 经纪时间:任意 经纪商:IC Markets、Pepperstone with Raw 和 Razor 的点差最低 建议止损:50 点 建议止盈水平:20 点、50 点和 1
Max Paynex
Abdulkarim Karazon
Max Payne 是一个反转/趋势信号指标,以箭头的形式给出信号,该指标在同一柱收盘时给出信号,该指标可以在图表上以不同周期多次下降,以获得信号的双重/三重确认 该指标具有高度可调性,可以适应任何交易风格,同时它不会重新绘制或背面绘制,购买后您将获得屏幕截图中显示的完整系统以及使用的模板。 ----------------- 如何交易: 等到您在同一柱上获得三次确认,同时趋势过滤器(购买后您将获得的佩恩趋势)与方向一致 开仓并将止损设置为买入交易的黄金箭头(模板)下方和卖出交易的黄金箭头(模板)上方,您的退出信号是第一个相反的白点信号(模板)。 ----------------- 参数 : 信号周期:箭头周期 滤波器:信号滤波器 距离:箭头距蜡烛的距离 计数柱:显示多少历史信号 警报 --------------------------------------
Gold Channel XAUUSD
Paulo Rocha
5 (2)
Gold Channel is a volatility-based indicator, developed with a specific timing algorithm for the XAUUSD pair, which consists of finding possible corrections in the market. This indicator shows two outer lines, an inner line (retracement line) and an arrow sign, where the theory of the channel is to help identify overbought and oversold conditions in the market. The market price will generally fall between the boundaries of the channel. If prices touch or move outside the channel it is a tra
SNR LEVEL INDICATOR Accurate Snr level indicator will only display Fresh Levels that are close to the Current Market Price. This indicator is very accurate in mapping Support & resistance levels. there is an alert feature when the price TOUCHES the SNR LEVEL, WHEN CLOSE CANDLE BREAK/REJECT SNR LEVEL. INDICATOR MARKING :: - SUPPORT LEVEL == V SHAPE - RESISTANCE LEVEL == APEX LEVEL - GAP RESISTANCE & GAP SUPPORT == OPEN CLOSE CANDLE - SUPPORT BECAME RESISTANCE & RESISTANCE BECAME SUPPORT INDIC
All in One Trade
Alexey Minkov
4.48 (27)
The All-in-One Trade Indicator (AOTI) determines daily targets for EURUSD, EURJPY, GBPUSD, USDCHF, EURGBP, EURCAD, EURAUD, AUDJPY, GBPAUD, GBPCAD, GBPCHF, GBPJPY, AUDUSD, and USDJPY. All other modules work with any trading instruments. The indicator includes various features, such as Double Channel trend direction, Price channel, MA Bands, Fibo levels, Climax Bar detection, and others. The AOTI indicator is based on several trading strategies, and created to simplify market analysis. All-in-One
Volatility Trend System - a trading system that gives signals for entries. The volatility system gives linear and point signals in the direction of the trend, as well as signals to exit it, without redrawing and delays. The trend indicator monitors the direction of the medium-term trend, shows the direction and its change. The signal indicator is based on changes in volatility and shows market entries. The indicator is equipped with several types of alerts. Can be applied to various trading
NAM Order Blocks
NAM TECH GROUP, CORP.
5 (1)
MT4多時限訂單塊檢測指示器。 特徵 -在圖表控制面板上完全可自定義,提供完整的交互。 -隨時隨地隱藏和顯示控制面板。 -在多個時間範圍內檢測OB。 -選擇要顯示的OB數量。 -不同的OB用戶界面。 -OB上的不同過濾器。 -OB接近警報。 -ADR高低線。 -通知服務(屏幕警報|推送通知)。 概括 訂單塊是一種市場行為,它指示從金融機構和銀行收取訂單。著名的金融機構和中央銀行帶動了外匯市場。因此,交易者必須知道他們在市場上正在做什麼。當市場建立訂單塊時,它會像發生大多數投資決策的範圍一樣移動。 訂單建立完成後,市場將朝著上升和縮小的方向發展。訂單大宗交易策略的關鍵術語是它包括機構交易者正在做的事情。由於它們是主要的價格驅動因素,因此包括機構交易在內的任何策略都可以。 您將在任何時間範圍內實時看到訂單塊,使用我們的控制面板,您將能夠在所選的歷史記錄週期內檢測常規,拒收和未大寫的訂單塊。 現在您可以接收到訂單塊接近警報,我們在MT4上顯示屏幕通知,並將通知推送到您的手機!
"The Squeeze indicator attempts to identify periods of consolidation in a market. In general the market is either in a period of quiet consolidation or vertical price discovery. By identifying these calm periods, we have a better opportunity of getting into trades with the potential for larger moves. Once a market enters into a "squeeze," we watch the overall market momentum to help forecast the market direction and await a release of market energy." Modified TTM Squeeze Indicator is a modifica
Entry Points Pro
Yury Orlov
4.7 (225)
这是一款 MT4 的趋势指标,可提供准确的入场交易信号,且无重绘或延迟。 它可应用在任何金融资产:外汇、加密货币、贵金属、股票、指数。 最好的结果出现在 M15+ 的时间帧内。 指标的 MT5 版本 重要! 购买后请联系我,以便获取详细指南和奖励。 视频 (6:22) - 一个信号赢取的利润等于指标价格的三倍。 视频 (4:44) - 它如何在测试器中工作,我的提示和技巧。 视频 (1:44) - 有关它如何处理加密货币和指数的几句话。 大多数交易者在 Entry Points Pro 指标的帮助下,在第一个交易周内就改善了他们的交易结果。 Entry Points Pro 指标的益处 入场信号无重绘或延迟 如果信号出现,并得到确认(如果信号所在烛条已收盘),则它不会再消失;不像是重绘指标,它会导致重大的财产损失,因为它们可以在显示信号后再将其删除。 无差错开仓 指标算法可令您找到入场交易(买入或卖出资产)的理想时机,从而提高每位交易者的成功率。 Entry Points Pro 可操作任何资产 它允许您在 MT4 平台上交易任何经纪商提供的加密货币、股票、
Gann Swing Structure
Kirill Borovskii
5 (1)
This indicator is based on the mathematics of the great trader W.D. Ganna. With its help, you can easily find strong levels by analyzing swings to find the optimal entry point. The indicator works on all instruments and all timeframes. The indicator is fully manual and has control buttons. All you need to do is press the NEW button, a segment will appear, which you can place on any movement, swing or even 1 candle that you want to analyze. By placing the segment, press the OK button. A grid (th
This indicator scans for you up to 30 trading instruments and up to 8 timeframes for occurrences of the high probability reversal patterns: Double Tops/Bottoms with fake breakouts . Please read also the blog post " Professional Trading With Double Tops/Bottoms And Divergences! " which explains the concepts behind the ULTIMATE Double Top/Bottom indicator and how you can use a professional top-down approach. You can get alerts via MetaTrader 4, email and push notifications at the moment when a sig
Quantum Breakout Indicator PRO
Bogdan Ion Puscasu
4.96 (26)
介绍     Quantum Breakout PRO   ,突破性的 MQL5 指标,正在改变您交易突破区域的方式!   Quantum Breakout PRO 由拥有超过 13 年交易经验的经验丰富的交易者团队开发,旨在通过其创新和动态的突破区域策略将您的交易之旅推向新的高度。 量子突破指标将为您提供带有 5 个利润目标区域的突破区域的信号箭头,以及基于突破框的止损建议。 它既适合新手交易者,也适合专业交易者。 量子 EA 通道:       点击这里 MT5版本:   点击这里 重要的!购买后请私信我领取安装手册。 建议: 时间范围:M15 货币对:GBPJPY、EURJPY、USDJPY、NZDUSD、XAUUSD 账户类型:ECN、Raw 或 Razor,点差极低 经纪商时间:GMT +3 经纪商:IC Markets、Pepperstone with Raw 和 Razor 的点差最低 规格: 不重漆! 最多 5 个建议利润目标区域 建议止损水平 可定制的盒子。您可以设置自己的 Box Time Start 和 Box Time E
PZ Trend Trading
PZ TRADING SLU
4.8 (5)
许多盈利交易者不仅知道如何识别市场趋势,而且也能把握趋势建立后的交易机会。 Pz 趋势交易 指标设计用来在趋势行情中尽可能的赚取利润。 已建立的趋势提供了一揽子交易机会,但大多数趋势交易指标完全忽视了它们,让交易者在趋势行情时完全不知道该如何做!一般趋势指标只通知有关的趋势变化,但根本不足以得到卓越的回报. Pz 趋势交易 指标比一般趋势指标显示多达 20 倍的交易 , 因为它注重所谓的市场时机。它不仅显示当前的市场趋势,也有回调,内柱线的突破和调整。它令您在趋势回调之后介入,安全的柱线内突破金字塔加仓,以及发现潜在的反转,和已知的调整。 趋势改变 一个趋势改变在市场方向变化时发生。趋势变化在图表上用带数字的彩色圆圈显示。蓝色 (1) 信号为上涨开始, 而红色 (1) 信号为下跌开始。趋势变化并非评估当前价格动作的结果, 它意味着交易设置是不定时地。如果您正确使用本指标, 在趋势变化时, 您将将已经入场 (参看下面的调整)。 回调 但凡趋势在运动中,行情上下抖动,盈利者收割利润,且其它参与者入场。趋势回调代表好的买入机会,通常是由主力获利离场导致。如果行情在回调后回归上行, 指
作者的更多信息
ReT
Ivan Simonika
Introducing the trend indicator! Ready trading system. The principle of the indicator is to automatically determine the current state of the market when placed on a chart. The indicator analyzes market dynamics for pivot points. Shows the favorable moments of entering the market with stripes. Can be used as a channel indicator or level indicator! This indicator allows you to analyze historical data, and on their basis display instructions to the trader on further actions. To find out how to dete
TrendColor
Ivan Simonika
The indicator monitors the market trend with very high reliability. Sharp price fluctuations, as well as noise around averaged prices, are ignored. All intersection points will be ideal points at which the direction of the trend changes. Signal points, places where color changes, can be used as points of potential market reversal. This development can be used both for long-term trading, and for piping on small periods. The indiuctor algorithm implements a kind of technical analysis based on the
MarketTrend
Ivan Simonika
This indicator will provide you with everything you need in order to overcome losses due to human emotions. The indicator determines the moments of a trend reversal and the direction of its movements. This development is equipped with the most modern, adaptable trading algorithms. The main secret of short-term trading is to have information on when to enter a deal. The indicator works great on all timeframes and informs the trader about the most successful moments of buying or selling a currency
Correlators
Ivan Simonika
It can be used as an independent trading system. It is based on the idea that some currency pairs follow one another. The indicator allows you to simultaneously display several other charts on the chart of one currency pair, which allows you to anticipate some movements and fairly accurately determine the beginning of trends. The principle of trading according to indicator signals is also simple: you need to sell a currency pair whose chart is higher, and buy the lower one.
MarketPoints
Ivan Simonika
This indicator gives signals about a trend change, shows successful signals. High probability of a successful trend, it can be used with an optimal risk to profit ratio. The indicator does not redraw and is not late; it can be used both for piping on small periods and for long-term trading. The indicator algorithm works using open prices, and you can work with a zero bar. It works on all currency pairs and on all timeframes.
IdealMaster
Ivan Simonika
This indicator will provide you with everything you need in order to overcome losses due to human emotions. The indicator determines the moments of a trend reversal and the direction of its movements. This development is equipped with the most modern, adaptable trading algorithms. The main secret of short-term trading is to have information on when to enter a deal. The indicator works great on all timeframes and informs the trader about the most successful moments of buying or selling a currency
Trend Star
Ivan Simonika
5 (1)
The indicator ignores sharp fluctuations and market noise and tracks market trends with absolute reliability. It is suitable for trading on small timeframes and on large ones, it ignores sudden price spikes or price movement corrections due to the reduction of market noise around the average price value. For calculations, the indicator uses indicators: iLow, iHigh, iMA, iATR. Since the output signal relies on reliable indicators, it is also reliable. You can configure both a sound signal and se
Turbo Pro
Ivan Simonika
Turbo Pro - Advisor uses a number of indicators to search for signals for entry. It works in fully automatic mode! Use default settings. Unlike alternative developments, this bot can simultaneously trade on both buy and sell. This is a significant advantage in real work because it makes it possible to achieve significantly better results due to increased capitalization. The bot works like a scalpel with sharp price movements, or uses series closures by averaging the overall position. Turbo Pro
Standard Trend
Ivan Simonika
This is a convenient tool if you are used to trading on a clean chart, but sometimes you need to look at this indicator. If you are not sure how to determine the inflection point of a trend and are concerned about how to draw trend lines, then this indicator is for you. From now on, you do not need to sit near the computer and analyze the price, use this indicator carefully.
Legacy
Ivan Simonika
This is a hybrid trend indicator, as it is based on the signals of elementary indicators and a special algorithm for analysis. The smart algorithm of the indicator determines the trend, filters out market noise and generates input signals. The indicator uses a color alarm: blue - when changing from descending to ascending, and red - on the contrary, to descending. You can use the indicator as the main indicator for determining the trend. The indicator can work both for entry points and as a filt
Special Volume
Ivan Simonika
Special Volume - Volume indicator, in the Forex market volumes are peculiar (teak). Why is Forex not possible to track normal volumes? The fact is that it is an OTC market. Therefore, it is practically not realistic to calculate the volume of purchases and sales by one instrument. Many Forex traders completely abandon volume indicators in their work. But for those who want to use them, there are some interesting tools, and one of them is Special Volume. The Special Volume indicator shows the ave
Direction Trend indicator. Shows the direction of the current trend. Colors bars in red and blue. It works on all currency pairs and on all timeframes. Do not forget that the approach should be comprehensive, indicator signals require additional information to enter the market. The principle of the indicator is that when placed on a chart, it automatically determines the current state of the market, analyzes historical data, based on historical data.
Special Trend
Ivan Simonika
This indicator is a professional indicator for Forex trading. Shows points for entering the market, points of potential market reversal. Uses one parameter for settings. Ready trading system. The indicator combines several progressive algorithms. Combined systems for analyzing historical data are projected onto lines in the form of straight lines connecting extremes. That is the pivot point of the market. These extremes or pivot points of the market can be used as line levels! Which is very conv
Trend Step
Ivan Simonika
A trend indicator, and not the first view, is a regular indicator, but it can be used with an optimal risk coefficient. The principle of work is simple - the indicator shows the moments for entering the market with arrows, which is very easily perceived visually. It is recommended to use an oscillator with an additional indicator, for example, standard RSI. You need to respond to level 50. Or use some other confirmation system. The indicator can be used both for piping for small periods and
Turbo Fix
Ivan Simonika
Turbo Fix - the adviser uses a number of indicators to search for signals to enter. It works in fully automatic mode! Use default settings. Unlike alternative developments, this bot can simultaneously trade on both buy and sell. This is a significant advantage in real work because it makes it possible to achieve significantly better results due to increased capitalization. The bot works like a scalpel with sharp price movements, or uses series closures by averaging the overall position. Turbo F
Pred Trend
Ivan Simonika
The indicator shows the direction of the trend, signaling this using pivot points. It can be used with an optimal risk ratio. The arrows indicate favorable moments and directions for entering the market. Uses one parameter to adjust (adjust from 1 to 3). It works on all currency pairs and on all timeframes. The indicator can be used both for piping for small periods and for long-term trading. It works on all currency pairs and on all timeframes. When using, it is recommended to look at an add
HighScalpel
Ivan Simonika
5 (1)
Introducing the HighScalpel scalping system. It is enough to optimize once, for example, per month. After that, he shows excellent results on the forward period (several times larger), which can be seen in the screenshots. Be attentive to the spread indicators of your broker! The higher the spread, the less often the market entries. If the spread is above 20 pips, then the number of inputs falls by two orders of magnitude. It is ideal to use a broker with a floating spread of 6 pips. Such b
Revers Line
Ivan Simonika
The Revers Line signals a change in the angle of the moving average, the LevelZero parameter sets the circle of the zero point, there are limits from -LevelZero to LevelZero including those that will be considered a zero point, this can be indicated in red on histograms.   Options:   LevelZero - zero point [-LevelZero, LevelZero];   Length - length of the moving average;   Start - the starting point for calculating the angle;   End - the end point for calculating the angle;   MetodMA - averagin
Micron
Ivan Simonika
We present to you a fully automated Expert Advisor designed for trading major currency pairs. The bot uses a set of its own trading algorithms and has protection against crashes. Attention! The bot only works correctly when the spread is less than 6 pips! I ask you to weigh this fact, and if you do not have the appropriate conditions for trading, this bot will not work for you! The robot controls the volume of trading positions, slippage, spread, maintains and protects open orders, can work wit
Trend Advanced
Ivan Simonika
A new trend determination algorithm has been developed for this indicator. The algorithm with acceptable accuracy generates input signals and output levels. Strategy for trend trading, filtering and all the necessary functions built into one tool! The principle of the indicator’s operation is to automatically determine the current state of the market when placing it on a chart, analyze historical data based on historical data and display instructions for further actions on the screen to the trad
X Forex
Ivan Simonika
This development is a scalping system. The bot shows excellent results, which can be seen in the screenshots. You can shamelessly start the protest and bot with such a rite, self-confidently chucking in yogo abilities. The bot can be tested on high currency pairs and high periods. In order to install the test tester so it is indicated on the screenshots, for correct test. You need to trade on timeframes M1-M15. An expert created to trade on any instrument. It is preferable to test the adviser w
Traders can use the Trends Histogram indicator to identify potential areas of profit taking in the next section of an uptrend or downtrend. So it is for direct entry into the market. The indicator is used in the same way as any of these indicators individually or in combination with other indicators. This indicator shows an uptrend and a downtrend (green histogram). Only one input parameter is available: Length. It affects the scale of indicator price coverage. Installed input parameters ca
Forex Go
Ivan Simonika
This development is a scalping system. The Forex Go bot shows excellent results, which can be seen in the screenshots. You can shamelessly start the protest and the bot with such a rite, self-confidently churning in your abilities. The bot can be tested on high currency pairs and high periods. In order to install the test tester so it is indicated on the screenshots, for correct test. You need to trade on timeframes M1-M15. Expert Advisor is designed to trade on any instrument. It is preferable
Stable Pulse
Ivan Simonika
The work of the Stable Pulse bot is displayed in the form of several key mmoments, which can be seen in the screenshots. This development is a scalping system. You can download and test the bot for free this way by yourself making sure of its capabilities. The bot can be tested on different currency pairs and different periods. The main thing is to set the tester settings as shown in the screenshot, for correct testing. You need to trade on timeframes M1-M15. Expert Advisor is designed to trade
Universal scalper with averaged algorithm to exit the drawdown. The Protected Article advisor uses an author's scalping strategy. More than a year of work on a demo and on real accounts. The adviser will be a good assistant when scalping, trading on the news, as well as when opening many transactions on different currency pairs. It must be run on the chart of each pair that you want to trade. The parameters of the adviser are clear and easy to configure. Advisor Goal Scalping results in small
Trend Agile
Ivan Simonika
The Trend Agil e indicator tracks the market trend with very high reliability. Sharp price fluctuations, as well as noise around averaged prices, are ignored. All intersection points will be ideal points at which the direction of the trend changes. Signal points, places where color changes, can be used as points of potential market reversal. This development can be used both for long-term trading, and for piping on small periods. The indiuctor algorithm implements a variety of technical analysis
Balanced Bot
Ivan Simonika
Balanced Bot - the adviser uses a number of indicators to search for signals for entry. It works in fully automatic mode! Use default settings. Unlike alternative developments, this bot can simultaneously trade on both buy and sell. This is a significant advantage in real work because it makes it possible to achieve significantly better results due to increased capitalization. The bot works like a scalpel with sharp price movements, or uses series closures by averaging the overall position. Tur
Action Points
Ivan Simonika
This indicator gives signals about a trend change, shows successful signals. High probability of a successful trend, it can be used with an optimal risk to profit ratio. The indicator does not redraw and does not lag, it can be used both for pipsing in small periods and for long-term trading. The indicator algorithm works using open prices, and you can work with a zero bar. It works on all currency pairs and on all timeframes.
Distinct
Ivan Simonika
Introducing the trend indicator! Ready trading system. The principle of the indicator is to automatically determine the current state of the market when placed on a chart. The indicator analyzes market dynamics for pivot points. Shows the favorable moments of entering the market in stripes. It can be used as a channel indicator or level indicator! This indicator allows you to analyze historical data, and on their basis display instructions to the trader on further actions. To find out how to det
Analyst Bot
Ivan Simonika
Analyst Bot - the adviser uses many moving average indicators to search for signals to enter. Works in fully automatic mode! You do not need any settings, you can use the default settings. The bot passes the historical gap for the 19-year period from 2000 to 2019. Unlike alternative developments, this bot can simultaneously trade both on buy and on sell. That is, it has two independent systems of analysis. This is a significant advantage in real life because it gives the opportunity to achieve
筛选:
无评论
回复评论