ADR Scalping Indicator MT5
- 指标
- Robert Mathias Bernt Larsson
- 版本: 1.30
- 更新: 4 七月 2022
- 激活: 10
这很容易成为最容易被忽视的指标,它可以为您提供对价格行为的最大洞察力。这是我自己使用的唯一指标。
该指标可让您深入了解今天的价格走势,以及最有可能朝哪个方向移动。
ADR 代表平均每日范围。如果您在盘中交易或剥头皮,您必须知道价格将移动多少的范围。
假设价格已经移动了当天正常水平的一半,并且处于价格行动的底部,价格更有可能继续下跌,而不是再次一路上涨以达到平均每日范围。价格总是寻求在平均每日范围内移动。
您还将获得动态支撑和阻力。当价格移动到平均范围时,您可以向中间交易。
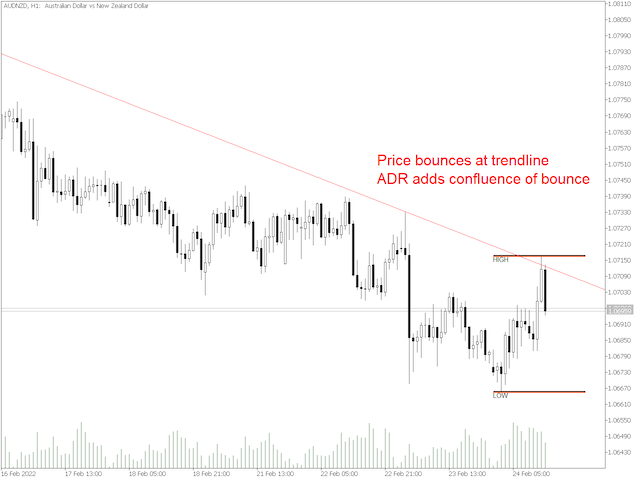
该指标还将让您知道价格是否可能从趋势线反弹。因此,如果您喜欢使用趋势线进行交易,这就是您的指标!
你会得到 3 种类型的范围。
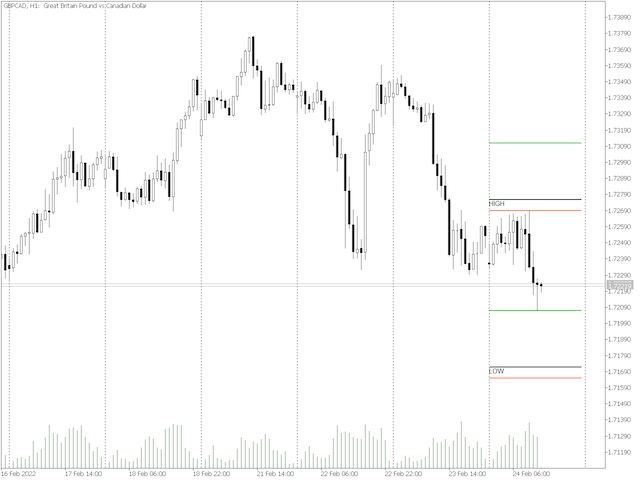
1. 黑色区间 - 基于当前价格的当前区间,但如果价格波动超过平均水平,则会吸引顶部或底部。当价格移动超过 ADR 的 50% 时,该范围最终将与其他两个范围之一保持一致。
2. 绿色区间 - 如果我们从今天的低点计算,价格平均会移动多远?
3. 红色范围 - 如果我们从今天的高点计算,价格平均会移动多远?


It is an awesome indicator. I love it!