• 概述
  • 评论 (1)
  • 评论 (2)

Investment Castle News

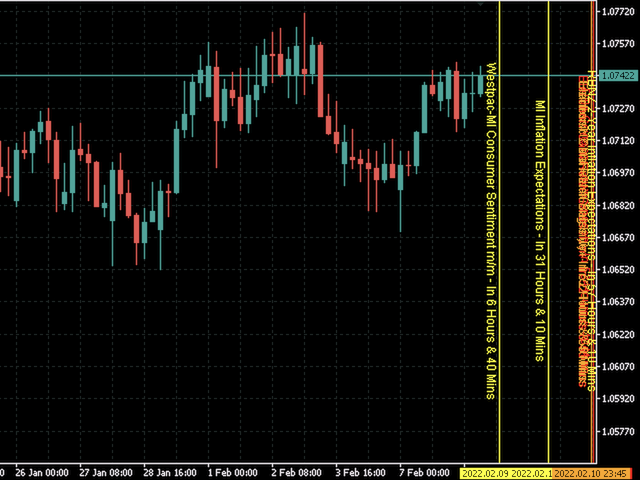
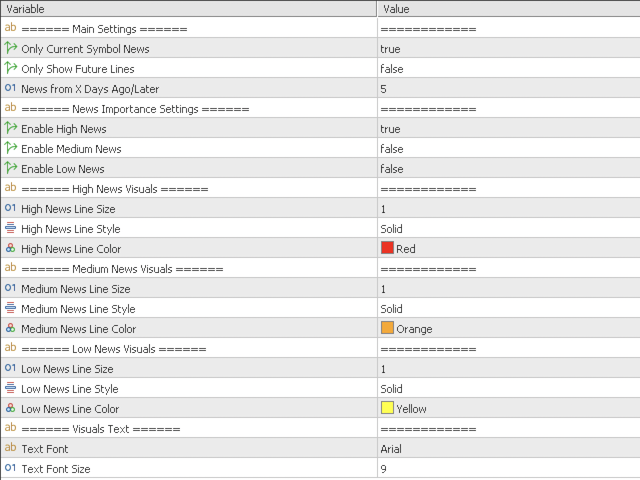
Investment Castle News Indicator will plot vertical lines before the news on the chart and categorized in three different colors in accordance with the news importance. You can choose to limit the news to the current chosen symbol or show all future news on the same chart.

High impact news is marked in Red lines be default.

Medium impact news is marked in Orange lines be default.

Low impact news is marked in Yellow lines be default.
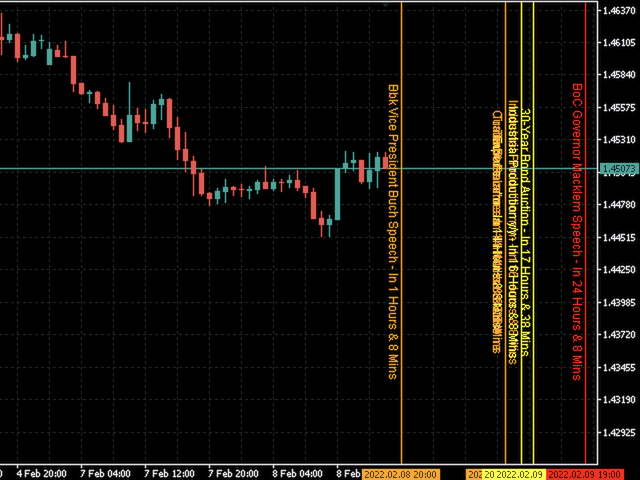

推荐产品
Rainbow MT5
Jamal El Alama
4.33 (3)
Description : Rainbow MT5 is a technical indicator based on Moving Average with period 34 and very easy to use. When price crosses above MA and MA changes color to green, then this is a signal to buy. When price crosses below MA and MA changes color to red, then this is a signal to sell. The Expert advisor ( Rainbow EA MT5 ) based on Rainbow MT5 indicator is now available here . MT4 version is available here .
FREE
Show Pips for MT5
Roman Podpora
4.63 (19)
This information indicator will be useful for those who always want to be aware of the current situation on the account. - More useful indicators The indicator displays data such as profit in points, percentage and currency, as well as the spread for the current pair and the time until the bar closes on the current timeframe. There are several options for placing the information line on the chart: - To the right of the price (runs behind the price); - As a comment (in the upper left corner
FREE
This indicator is a zero-lag indicator and displays  strength of trend change . True Trend  Oscillator Pro works best in combination with True Trend Moving Average Pro that displays exact trend as is. Oscillator value is exact price change in given direction of the trend. True Trend Moving Average Pro: https://www.mql5.com/en/market/product/103586 If you set PERIOD input parameter to 1 this indicator becomes a sharpshooter for binary options. Developers can use True Trend Oscillator in E
FREE
This Mt5 Indicator Signals when there is two opposite direction bars engulfed by current bar.  has a recent Exponential Moving Average Cross and past bar was oversold/bought Expert Advisor Available in Comments  Free Version Here : https://www.mql5.com/en/market/product/110114?source=Site&nbsp ; Full Alerts for mt5 terminal , phone , email, print to file, print to journal  Buy Signal ( blue line ) Past ema cross ( set at 30 bars back ) Past bar rsi is oversold ( level 40  ) Engulfing bar closes
FREE
Multi-timeframe trend indicator based on the ADX / ADXWilder indicator with Fibonacci levels The indicator shows trend areas using ADX or ADXWilder indicator data from multiple timeframes. The impulse mode of the indicator allows you to catch the beginning of a trend, and several "Screens" with different timeframes allow you to filter out market noise. Fibonacci levels are added to the price chart, which have flexible settings. How the indicator works: if PDI is greater than NDI, then   it`
FREE
This indicator can send alerts when a Heiken Ashi Smoothed color change occurs. Combined with your own rules and techniques, this indicator will allow you to create (or enhance) your own powerful system. Features Can send all types of alerts. Option to delay the alert one or more bars in order to confirm the color (trend) change. Input parameters Candle shift for alert: Default is 1. Setting it to 0 will alert you on color change on the current candle. This should be regarded as a pending (uncon
FREE
Projected Volume
Fernando Lahude Ritter
Volume Projection Indicator The Volume Projection Indicator is a specialized tool designed for traders who focus on the relationship between volume and price action. This intuitive indicator projects the expected volume for the ongoing candle, aiding in decision-making during live market conditions. The indicator presents volume data in a histogram format directly on the chart for quick analysis. Features: Bullish Volume Representation : Each green bar in the histogram signifies the volume for a
FREE
Automatic Trendlines
Pasi Hakamaki
4.65 (51)
该指标在图表上绘制趋势线。该指标有六个输入。用户可以为这两行指定替代标签。如果使用了指标的多个实例,则标签必须不同。用户可以设置线条的宽度和颜色以及深度,以指定应使用哪些显着的峰。例如,“深度= 10”使用当前的峰和谷设置趋势线,这些峰和谷在右侧和左侧至少有10条,并且高/低比峰值的高/低小/大。指标还绘制以前的高峰和低谷。指示器还具有警报功能,当价格与支撑线/阻力线相距预设距离时,可用于通知用户。警报距离以点为单位设置。.............................................................................................
FREE
ThreePointsChannelFree
Dimitr Trifonov
5 (2)
This is a free version of the indicator, the period between the vertical lines is always 30 bars. In the paid version the period can be set by user, so a configuration with many ThreePointsChannel indicators with different periods is possible. The principle of construction - on top of any number of bars set by the user, a channel is constructed with maximum and minimum lines so that the bars touch the maximum and minimum of the channel at exactly three points. The name of the indicator follows
FREE
Shape Pack MT5
John Louis Fernando Diamante
This indicator provides common shapes as drawing object options. The shapes are rotatable, resizable, draggable, and will keep their proportions (according to their handle trendline) across different chart scales. Multiple drawings are supported. Shapes: Square Rhombus Triangle (quadrilateral & isosceles) Circle (grid, overlapped grid, flexi grid, rotatable grid, concentric circles) Features: rays (all object edges will be rays) show/hide each individual drawing type, or all delete last drawn
FREE
LT Nrtr
Sie Samuel Roland Youl
介绍强大的NRTR(Nick Rypock Trailing Reverse)指标 - 这是一个必备的技术工具,用于帮助交易员识别趋势反转并设置有效的跟踪止损水平。由Nick Rypock开发,该指标采用独特的算法,可以适应不断变化的市场条件,成为任何交易者工具箱中不可或缺的一部分。 以下是交易员使用该指标的两种常见方式: 1. 趋势反转:NRTR指标在趋势即将反转时生成清晰的信号。留意指标线穿过价格图表,这是潜在趋势方向转变的信号。 2. 跟踪止损:NRTR还可作为可靠的跟踪止损工具,可在趋势市场中保护利润。当价格朝着预期方向移动时,NRTR线会动态地跟随价格,提供灵活的止损水平。 可自定义参数:通过调整指标的参数,将NRTR指标调整为适合您的交易偏好和时间框架。尝试不同的设置,找到最适合您独特交易风格的配置。为了提升交易策略,考虑将NRTR指标与其他技术指标结合使用。使用多个指标可以验证信号,并提高整体交易准确性。 总之,NRTR指标对于希望识别趋势反转并实施有效的跟踪止损的交易员来说是一个宝贵的资产。其适应性和用户友好的设计使其成为交易者中受欢迎的选择,有助
FREE
Trendline mt5 indicator
David Muriithi
3 (1)
Are you tired of drawing trendlines every time you're analyzing charts? Or perhaps you would like more consistency in your technical analysis. Then this is for you. This indicator will draw trend lines automatically when dropped on a chart. How it works Works similar to standard deviation channel found on mt4 and mt5. It has 2 parameters: 1. Starting Bar 2. Number of bars for calculation The   starting bar   is the bar which drawing of the trend lines will begin, while the   number of bars for c
FREE
Follow The Line MT5
Oliver Gideon Amofa Appiah
4.42 (31)
This indicator obeys the popular maxim that: "THE TREND IS YOUR FRIEND" It paints a GREEN line for BUY and also paints a RED line for SELL. (you can change the colors). It gives alarms and alerts of all kinds. IT DOES NOT REPAINT and can be used for all currency pairs and timeframes. Yes, as easy and simple as that. Even a newbie can use it to make great and reliable trades. NB: For best results, get my other premium indicators for more powerful and reliable signals. Get them here: https://www.m
FREE
ADXW Cloud
Shahabeddin Baset
4.6 (5)
This is Wilder's ADX with cloud presentation of DI+ & DI- lines. Features 4 standard lines of the ADX indicator: DI+, DI-, ADX, ADXR cloud presentation of DI+/DI- lines with transparent colors applicable to all time-frames and all markets What Is ADX J. Welles Wilder Jr., the developer of well-known indicators such as RSI, ATR, and Parabolic SAR, believed that the Directional Movement System, which is partially implemented in ADX indicator, was his most satisfying achievement. In his 1978 boo
FREE
Stat Monitor 5
Sergei Linskii
5 (1)
Stat Monitor is a good information indicator. Benefits of the indicator: The indicator provides useful information - the current spread, the cost of one lot of the symbol, trading leverage and the recommended lot size for trading. You can use the indicator on the MetaTrader 5 trading platform of any broker. The indicator provides useful information. Version of the Stat Monitor indicator for MetaTrader 4 I wish you all good luck in trading and stable profit!
FREE
QuantumAlert Stoch Navigator is a free indicator available for MT4/MT5 platforms, its work is to provide "alerts" when the market is inside "overbought and oversold" regions in the form of "buy or sell" signals. This indicator comes with many customization options mentioned in the parameter section below, user can customise these parameters as needful. Join our   MQL5 group , where we share important news and updates. You are also welcome to join our private channel as well, contact me for the p
FREE
Virtual Targets MT5
Hoang Van Dien
4.75 (8)
This indicator is very useful for day traders or short term traders. (MT5 version) No need to calculate the number of pips manually, just look at the chart and you will see the Virtual Take Profit / Virtual Stop Loss target line and evaluate whether the entry point is feasible to reach the intended target or not. Enter the intended   Take Profit / Stop Loss   pips for your trade. The indicator will display   Virtual Take Profit / Virtual Stop Loss   lines for you to easily see if the target i
FREE
Dual Onset MT5
Dariel Iserne Carrera
4.8 (5)
This is the MT5 version. Get Dual Onset MT4 here   It is an algorithm to detect trend changes early. You should try multiple values for the Multiplier parameter (1 <value <10 recommended). At first glance you can see effective entries. This is, in fact, one of the rows that Geleg Faktor initially had. But it was removed because it was no longer needed. The other rows were sufficient for G.Faktor's effectiveness, but I still wanted to share this one. Always test before using it on your live
FREE
Donchian Pro
Paulo Henrique Faquineli Garcia
5 (2)
The Donchian Channel Channels are among the most popular tools of technical analysis, as they visually convey to the analyst the limits within which most price movement tends to occur. Channel users know that valuable information can be obtained at any time, whether prices are in the central region of a band or close to one of the border lines. One of the best known techniques to explore these concepts is Bollinger Bands. However, John Bollinger was not the only one to research the applicatio
FREE
Basic Supply Demand MT5
Mehran Sepah Mansoor
4.86 (14)
基本供求指标是 一款功能强大的工具,旨在加强您的市场分析,帮助您在任何图表上识别关键机会区域。这款免费的 Metatrader 指标拥有直观易用的界面,能让您清楚地了解供需区域,从而做出更明智、更准确的交易决策/ 免费 MT4 版本 该指标的仪表盘扫描器: ( Basic Supply Demand Dashboard ) 功能特点 该指标可自动扫描图表中的供需区,无需进行繁琐的手动分析 图形显示距离最近的供应区和需求区的剩余距离 供应区以一种独特的颜色突出显示,而需求区则以另一种颜色显示,便于快速准确地进行解读 该指标会自动计算最近的供应区或需求区与图表上当前价格之间的距离(以点为单位),为您提供清晰、可量化的参考。以点数为单位的距离会清晰地显示在图表上,让您可以快速识别与当前价格有较大或较小距离的区域 在接近或突破供需区时发出警报 适用于任何时间框架 可选择深色或浅色主题,自定义图表显示效果 如何使用 建议使用   M1   和   M5   时间框架。观看下面的视频,了解其工作原理。
FREE
Symobol Tabs
Mitchell Dean Ede
Displays symbol tabs for easy access when trading, symbols that are coloured are symbols you have trades running on. The indicator immediately shows the specified currency pair in the open window after clicking it. You no longer need to open a new window to view each chart thanks to the indicator. Additionally, it enables traders to concentrate on their trading approach by just keeping a small number of charts displayed.  
FREE
Free automatic Fibonacci is an indicator that automatically plots a Fibonacci retracement based on the number of bars you select on the BarsToScan setting in the indicator. The Fibonacci is automatically updated in real time as new highest and lowest values appears amongst the selected bars. You can select which level values to be displayed in the indicator settings. You can also select the color of the levels thus enabling the trader to be able to attach the indicator several times with differe
FREE
Important Lines
Terence Gronowski
4.88 (26)
This indicator displays Pivot-Lines, preday high and low, preday close and the minimum and maximum of the previous hour. You just have to put this single indicator to the chart to have all these important lines, no need to setup many single indicators. Why certain lines are important Preday high and low : These are watched by traders who trade in a daily chart. Very often, if price climbs over or falls under a preday low/high there is an acceleration in buying/selling. It is a breakout out of
FREE
Pivot Points Daily
Davide Zunino
4.67 (3)
The Indicator show Daily Pivot Points. It is possible to specify the number of days to display. For forex it doesn't consider the sunday session data. It is possibile to modify the color, style and  width for every level. It is better to use this indicator with timeframe not higher than Н1. 4 Levels of support and resistance with also Intermediate Levels that is possible to hide.
FREE
Auto Fibonacci
Ali Gokay Duman
5 (2)
This indicator calculates fibonacci levels via moving averages trend and draw these lines. You can change fast and slow Moving Averages settings for customization. Inputs: Fast MA Time Period :  64 Fast MA Shift: 0 Fast MA Method: Smoothed Fast MA Apply To: Median Price Slow MA Time Period: 32 Slow MA Shift: 0 Slow MA Method: Smoothed Slow MA Apply To: Median Price ZigZag: False ZigZag Color: Red ZigZag Type: DashDot ZigZag Width: VeryThin Fibo Settings TrendFibonacci: True FiboTrendColor: Blac
FREE
Reversal Candles MT5
Nguyen Thanh Cong
5 (2)
Introduction Reversal Candles is a cutting-edge non-repainting   forex indicator designed to predict price reversals with remarkable accuracy through a sophisticated combination of signals. Signal Buy when the last closed candle has a darker color (customizable) and an up arrow is painted below it Sell when the last closed candle has a darker color (customizable) and a down arrow is painted above it
FREE
Cybertrade Keltner Channels
Emanuel Andriato
4.67 (3)
Cybertrade Keltner Channels - MT5 Created by Chester Keltner, this is a volatility indicator used by technical analysis. It is possible to follow the trend of financial asset prices and generate support and resistance patterns. In addition, envelopes are a way of tracking volatility in order to identify opportunities to buy and sell these assets. It works on periods longer than the period visible on the chart. All values ​​are available in the form of buffers to simplify possible automations.
FREE
This is a tick indicator which compares the current bid price with the previous bid directly before it, and draws candles based on a comparison of the current ticks. It does not use historical ticks. Everything happens in real time, data moves from right to left, and the newest data arrives at the right. A trend line can be added which points in the direction of the price shifts.
FREE
The selective pin bar is designed to identify reversals. To use the selective pin bar effectively, traders typically look for Strong Rejection: The tail of the pin bar should extend significantly beyond the surrounding price action. It indicates that there was a sharp rejection of higher or lower prices during the trading period. A strong rejection suggests that the market sentiment may be changing.
FREE
Dual RSI
Paul Conrad Carlson
Indicator alerts for Dual Relative strength index rsi. Large rsi preset at 14 is below 30 small rsi preset at 4 is below 10 for buy bullish signals . Large rsi preset are 14 is above 70 small rsi preset at 4 is above 90 for sell bearish signals . Includes mobile and terminal alerts. draws lines when alerts. This indicator can help identify extremes and then the tops or bottoms of those extremes .
FREE
该产品的买家也购买
Atomic Analyst MT5
Issam Kassas
5 (15)
首先值得强调的是,该交易指标是非重绘、非延迟的指标,这使其成为手动和机器人交易的理想选择。 用户手册:设置、输入和策略。 Atomic Analyst是一种PA价格行动指标,利用价格的力量和动量来寻找市场上更好的机会。配备了高级过滤器,可帮助去除噪音和假信号,并提高交易潜力。使用多层复杂的指标,Atomic Analyst扫描图表,并将复杂的数学计算转化为任何初学者都能理解并用来做出一致交易决策的简单信号和颜色。 “Atomic Analyst”是专为新手和经验丰富的交易者量身定制的综合交易解决方案。它将高级指标和一流功能融合为一体的交易策略,使其成为所有类型交易者的多功能选择。 日内交易和剥头皮策略:专为快速准确的日内交易和短期交易而设计。 日内和摆动交易策略:可用作追求价格大幅波动的日内和摆动交易者的可靠工具。 多货币和市场:凭借其可靠的精度,在不同的工具和市场上运作。 多个时间框架:可在多个时间框架上使用,性能良好。 稳定性:所有指标均不重绘、不重绘和不滞后,确保可靠的信号。 信号清晰度:提供箭头信号,用于清晰的入场和出场点。 实时警报:通过交易入场、SL和TP警报通知交
Quantum Trend Sniper
Bogdan Ion Puscasu
5 (46)
介绍   量子趋势狙击指标 ,突破性的 MQL5 指标,正在改变您识别和交易趋势反转的方式!由拥有超过13年交易经验的资深交易员团队开发,     量子趋势狙击指标   旨在通过其创新的方式以极高的准确度识别趋势反转,将您的交易之旅推向新的高度。 ***购买量子趋势狙击指标,即可免费获得量子突破指标!*** 当量子突破指标识别出趋势反转时,它会向您发出警报和信号箭头,并建议您三个止盈水平。 它既适合新手交易者,也适合专业交易者。 量子 EA 通道:       点击这里 MT4版本:       点击这里 建议: 时间范围: 所有时间范围。为了获得最佳结果,我们建议在 M15、M30 和 H1 时间范围内使用它。 货币对:欧元兑美元、英镑兑美元、澳元兑美元、欧元兑英镑、, EURAUD,  XAUUSD 账户类型:ECN、Raw 或 Razor,点差极低 经纪时间:任意 经纪商:IC Markets、Pepperstone with Raw 和 Razor 的点差最低 建议止损:50 点 建议止盈水平:20 点、50 点和
首先,值得强调的是,这个交易系统是一个非重绘、非重画和非滞后的指标,这使得它非常适合手动和机器人交易。 在线课程,手册和下载预设。 “智能趋势交易系统 MT5”是专为新手和经验丰富的交易者量身定制的综合交易解决方案。它结合了超过 10 个优质指标,具有 7 多个强大的交易策略,使其成为适用于各种市场条件的多功能选择。 趋势跟随策略:提供精确的入场和止损管理,以有效地跟随趋势。 反转策略:识别潜在的趋势反转,使交易者能够利用区域市场的机会。 剃头策略:专为快速准确的日内交易和短期交易而设计。 稳定性:所有指标都不会重绘、不会重画和不会滞后,确保可靠的信号。 定制:支持自定义策略,以满足个人交易偏好。超过 7 种策略和组合可帮助您找到最佳策略。 信号清晰度:提供箭头信号,以指示清晰的入场和退出点。 实时警报:通过交易进出警报使交易者保持了解。 深入分析:提供更高时间框架的趋势分析和实时交易监控。 自适应颜色编码:利用蜡烛颜色编码来显示成交量、趋势和反转蜡烛信号。通过蜡烛颜色分析市场方向。 “智能趋势交易系统 MT5”赋予交易者必要的工具,以便在各种市场条件下做出明智和战略性的交易决策。无论
Gold Stuff mt5
Vasiliy Strukov
4.9 (181)
Gold Stuff mt5 是专为黄金设计的趋势指标,也可用于任何金融工具。 该指标不会重绘,也不会滞后。 推荐时间框架 H1。 购买后立即联系我以获得设置和个人奖励!   你可以在我的个人资料中找到它。   重要! 购买后立即与我联系,以获得说明和奖金!   您可以免费收到我们的强力支持和趋势扫描指标的副本,请私信。大部头书!   设置 绘制箭头 - 打开关闭。 在图表上绘制箭头。 警报 - 打开关闭声音警报。 电子邮件通知 - 打开关闭。 电子邮件通知。 Puch-notification - 打开关闭。 推送通知。 接下来,调整色域。 Gold Stuff mt5 是专为黄金设计的趋势指标,也可用于任何金融工具。 该指标不会重绘,也不会滞后。 推荐时间框架 H1。 购买后立即联系我以获得设置和个人奖励!   设置 绘制箭头 - 打开关闭。 在图表上绘制箭头。 警报 - 打开关闭声音警报。 电子邮件通知 - 打开关闭。 电子邮件通知。 Puch-notification - 打开关闭。 推送通知。 接下来,调整色域。
Entry Points Pro for MT5
Yury Orlov
4.55 (160)
这款指标用于 MT5,可提供准确的入场交易信号,且无重绘。 它可应用在任何金融资产:外汇、加密货币、贵金属、股票、指数。 它将提供极其精准的评估,并告诉您何时开仓和平仓的最佳时机。 观看 视频 (6:22),其中包含一个仅处理单一信号的示例,该信号即可值回指标购价! 大多数交易者在 Entry Points Pro 指标的帮助下,在第一个交易周内即改善了他们的交易结果。 订阅我们的 Telegram 群 ! Entry Points Pro 指标的益处。 入场信号无重绘 如果信号出现,并得到确认,则它不会再消失;不像是重绘指标,它会导致重大的财产损失,因为它们可以在显示信号后再将其删除。 无差错开仓 指标算法可令您找到入场交易(买入或卖出资产)的理想时机,从而提高每位交易者的成功率。 Entry Points Pro 可操作任何资产 它允许您在 MT5 平台上交易任何经纪商的加密货币、股票、贵金属、指数、大宗商品和货币。 提供任何方向的信号 Entry Points Pro 指标提供针对任意价格走势的入场交易信号 - 上涨、下跌或横盘(横向)。
Trend Screener Pro MT5
STE S.S.COMPANY
4.88 (66)
使用趋势筛选指标释放趋势交易的力量:由模糊逻辑和多货币系统提供支持的终极趋势交易解决方案! 使用趋势筛选器(由模糊逻辑提供支持的革命性趋势指标)提升您的趋势交易。 它是一个强大的趋势跟踪指标,结合了超过 13 种高级工具和功能以及 3 种交易策略,使其成为使您的 Metatrader 成为趋势分析器的多功能选择。 限时优惠:趋势筛选指标终身仅需 50 美元。 ( 原价 125$ ) (优惠延长) 体验趋势筛选器 100% 无需重新绘制的准确性,确保您的交易决策不受过去价格变化的影响。 释放多时间框架和多货币功能的多功能性,使您能够以无与伦比的信心在外汇、商品、加密货币和指数领域进行交易。 利用 Trend Screener 的综合策略套件增强您的交易: - 趋势跟踪策略和趋势延续策略 :趋势筛选器的趋势跟踪策略提供清晰的趋势延续信号,让您有效捕捉趋势走势并管理风险。 - 反转策略和早期入场点策略 :趋势筛选器的反转策略可检测市场方向的潜在变化,使您能够预测趋势反转并利用疲弱的市场趋势。通过早期入场点,您可以在潜在的趋势变化之前定位自己 获取可观的利润。 - 倒卖策略: 趋势筛选器的倒卖
AT Forex Indicator MT5
Marzena Maria Szmit
5 (3)
The AT Forex Indicator MT5 is a sophisticated trading tool designed to provide traders with a comprehensive analysis of multiple currency pairs. This powerful indicator simplifies the complex nature of the forex market, making it accessible for both novice and experienced traders. AT Forex Indicator uses advanced algorithms to detect trends, patterns and is an essential tool for traders aiming to enhance their forex trading performance. With its robust features, ease of use, and reliable signal
TPA True Price Action indicator reveals the true price action of the market makers through 100% non-repainting signals strictly at the close of a candle! TPA shows entries and re-entries, every time the bulls are definitely stronger than the bears and vice versa. Not to confuse with red/green candles. The shift of power gets confirmed at the earliest stage and is ONE exit strategy of several. There are available now two free parts of the TPA User Guide for our customers. The first "The Basics"
TPSpro RFI Levels MT5
Roman Podpora
5 (8)
Reversal First Impulse levels (RFI)      INSTRUCTIONS        RUS       -       ENG              R ecommended to use with an indicator   -   TPSpro  TREND PRO -  Version MT4                 A key element in trading is zones or levels from which decisions to buy or sell a trading instrument are made. Despite attempts by major players to conceal their presence in the market, they inevitably leave traces. Our task was to learn how to identify these traces and interpret them correctly. Main functi
首先,值得强调的是,这个交易工具是非重绘、非重画和非滞后的指标,非常适合专业交易。 在线课程,用户手册和演示。 智能价格行动概念指标是一个非常强大的工具,既适用于新手,也适用于经验丰富的交易者。它将超过20个有用的指标合并到一个指标中,结合了高级交易思想,如内圈交易员分析和智能资金概念交易策略。该指标侧重于智能资金概念,提供有关大型机构交易方式的见解,帮助预测它们的动向。 它在流动性分析方面尤其擅长,有助于理解机构的交易方式。它擅长预测市场趋势,并仔细分析价格波动。通过将您的交易与机构策略对齐,您可以更准确地预测市场走向。该指标多才多艺,擅长分析市场结构,识别重要的订单区块,并识别各种模式。 它擅长识别BOS和CHoCH等模式,理解动量的转变,并突出显示供需强劲的关键区域。它还擅长发现强大的不平衡,并分析价格创造更高高点或更低低点的模式。如果您使用斐波那契回撤工具,该指标可以满足您的需求。它还可以识别相等的高点和低点,分析不同的时间框架,并通过仪表板显示数据。 对于使用更高级策略的交易者,该指标提供了工具,如公平价值差指标和优惠和折扣区域的识别。它特别关注高时间框架订单
FX Power MT5 NG
Daniel Stein
5 (5)
通过 mql5 和 Telegram 上 的晨间简报获取每日市场更新,包括详细信息和屏幕截图 ! FX Power MT5 NG 是我们长期以来非常受欢迎的货币强度计算器 FX Power 的下一代产品。 这款下一代强度计算器能提供什么?您所喜爱的原版 FX Power 的所有功能 附加功能 黄金/XAU 强度分析 更精确的计算结果 可单独配置的分析周期 可自定义计算限制,以获得更好的性能 为希望查看更多信息的用户提供特殊的多实例设置 无尽的图形设置,可在每个图表中设置您最喜欢的颜色 无数的通知选项,让您再也不会错过任何重要信息 采用 Windows 11 和 macOS 风格的全新圆角设计 神奇的移动指标面板 FX Power 主要功能 所有主要货币的完整强势历史 所有时间框架内的货币强弱历史 所有经纪商和图表的计算结果完全相同 100% 可靠的实时计算 -> 无重绘 可通过下拉列表选择分析时段 通过自定义模式单独配置分析时段 可在一个图表中使用多个实例 可移动 FX Power 显示屏(通过拖放) 适用于高分辨率 QHD、UHD 和 4K 显示器 自动终端配置 针对平板电脑
成為突破者,隨著價格反轉,市場結構會改變利潤。 訂單突破者指示器可以識別趨勢或價格走勢何時接近枯竭並準備好逆轉。它會提醒您市場結構的變化,通常會在發生逆轉或重大回調時發生。 該指標使用專有計算來確定突破和價格動能。每當在可能的耗盡點附近形成新的高點時,指標就會繪製最後一個生成該高點的順序塊。然後,它將隨價格移動隨價格跟隨定單。然後,當價格轉向相反方向並突破該訂單塊時,它會提醒您,從而創建新的市場結構並開始趨勢或重大回調的可能逆轉。 訂單塊是在創建高/低之前的最後一個相反的彩色蠟燭,並且當價格跌破這些關鍵區域以下時,這表明趨勢可能會發生短期或長期反轉。 特徵 提醒您關鍵耗盡點的市場結構變化 價格接近耗盡水平時自動提取訂單塊 在一個方向繼續移動時,在價格後面跟踪定單,以提醒您最佳的反轉輸入 將顏色更改為純色塊,以顯示何時發生市場結構中斷。 適用於所有交易品種和時間範圍 內置集成的彈出窗口和電子郵件警報 策略和如何與定單破壞者指標進行交易 當斷路器塊發生時,您有兩個選擇。 看左邊!我們正在尋求供應/需求或支撐/阻力位嗎?市場結構轉變(逆轉)通常發生在價格重新測試舊水平或
FX Volume MT5
Daniel Stein
4.94 (17)
通过 mql5 和 Telegram 上 的 " 晨间简报 "获取每日市场更新,包括详细信息和屏幕截图 ! 外汇交易量(FX Volume)是第一个也是唯一一个从经纪商角度真正洞察市场情绪的交易量指标。 直接在您的图表上看到这些信息是真正改变游戏规则和突破性的交易解决方案。 受益于独特的市场数据洞察,如 比率(Ratios )显示货币多头和空头头寸的比率(百分比 比率变化 显示所选时间段内的多头比率及其百分比变化 总交易量 显示货币的总交易量(多头和空头),以手为单位 多头 交易量显示货币所有多头头寸的交易量 空头 交易量显示所有货币空头头寸的交易量 净多头 显示净多头交易量,即所有多头头寸减去所有空头头寸(以手为单位)。 净多头百分比 显示货币净多头交易量的变化 请阅读我们的基本教程 -> "如何使用外汇交易量进行交易 " 获取更多信息,如常见问题、交易技巧和教程视频,请访问我们的 外汇交易量公共信息频道 请 安装并运行 SI Connect 以建立与我们数据中心的持续连接 背景信息 我们都知道,外汇是一个分散的市场。这就是为什么我们必须打破常规思维,开发一个独
Blahtech Market Profile MT5
Blahtech Limited
5 (8)
Was: $249  Now: $99   Market Profile defines a number of day types that can help the trader to determine market behaviour. A key feature is the Value Area, representing the range of price action where 70% of trading took place. Understanding the Value Area can give traders valuable insight into market direction and establish the higher odds trade. It is an excellent addition to any system you may be using. Inspired by Jim Dalton’s book “Mind Over Markets”, this indicator is designed to suit the
ICT, SMC, SMART MONEY CONCEPTS, SMART MONEY, Smart Money Concept, Support and Resistance, Trend Analysis, Price Action, Market Structure, Order Blocks, BOS/CHoCH,   Breaker Blocks ,  Momentum Shift,   Supply&Demand Zone/Order Blocks , Strong Imbalance,   HH/LL/HL/LH,    Fair Value Gap, FVG,  Premium  &   Discount   Zones, Fibonacci Retracement, OTE, Buy Side Liquidity, Sell Side Liquidity, BSL/SSL Taken, Equal Highs & Lows, MTF Dashboard, Multiple Time Frame, BigBar, HTF OB, HTF Market Structure
XQ Indicator MetaTrader 5
Marzena Maria Szmit
5 (1)
Step into the realm of Forex trading with confidence and precision using XQ, a cutting-edge Forex indicator designed to elevate your trading game to unprecedented heights. Whether you're a seasoned trader or just stepping into the world of currency exchange, XQ Forex Indicator empowers you with the insights and signals needed to make informed trading decisions. The signal conditions are a combination of three indicators, and XQ Forex Indicator only display  medium and long-term trends . The ind
Blahtech Supply Demand MT5
Blahtech Limited
4.54 (13)
Was: $299  Now: $99   Supply Demand uses previous price action to identify potential imbalances between buyers and sellers. The key is to identify the better odds zones, not just the untouched ones. Blahtech Supply Demand indicator delivers functionality previously unavailable on any trading platform. This 4-in-1 indicator not only highlights the higher probability zones using a multi-criteria strength engine, but also combines it with multi-timeframe trend analysis, previously confirmed swings
IX Power MT5
Daniel Stein
5 (3)
IX Power 终于将 FX Power 的无与伦比的精确性带到了非外汇交易符号中。 它能准确判断您喜爱的指数、股票、商品、ETF 甚至加密货币的短期、中期和长期趋势强度。 您可以 分析 终端提供的 一切 。试试吧,体验一下您在交易时如何把握 时机 。 IX Power 主要功能 100% 精确的非重绘计算结果 - 适用于您终端中的所有交易符号 下拉式选择预配置以及可单独配置的强度分析周期 通过电子邮件、消息和手机通知的无数种通知选项 可访问的 EA 请求缓冲区 可自定义计算限制,以获得更好的性能 为希望查看更多信息的用户提供特殊的多实例设置 无尽的图形设置,让您在每个图表中都能找到最喜欢的颜色 采用 Windows 11 和 macOS 风格的圆角新面板设计 神奇的移动指标面板,可在子窗口和主图表之间无缝移动 适用于高分辨率 QHD、UHD 和 4K 显示器,并针对平板电脑和触摸屏进行了优化 IX Power 参数 最重要的参数不言自明,但我们很快会在另一篇文章中为您提供所有 IX Power 参数的完整说明。 使用别名 "参数可为技术交易符号
Advanced Supply Demand MT5
Bernhard Schweigert
4.53 (15)
任何新手或专业交易者的最佳解决方案! 该指标是一款独特、高质量、且价格合理的交易工具,因为我们已经整合了许多专有功能和新公式。 依据此更新,您将能够显示双重时间帧区域。 您不仅可以显示一个较高的时间帧,还可以同时显示图表时间帧,加上更高的时间帧:显示嵌套时区。 供需双方所有交易者都会喜欢它。 :) 重要信息披露 高级供需的最大潜力,请访问 https://www.mql5.com/zh/blogs/post/720245   想象您的交易如何得以改善,是因为您能够精准定位入场或目标位吗? 构建于新的底层算法,它可以更轻松地识别出买卖双方之间的潜在失衡。 这是因为它以图形方式展示供需最强劲区域,及其过去的表现(显示旧区域)。 这些功能旨在帮助您更轻松地发现最佳入场区域和价位。 现在您可以针对您的交易品种和时间帧来优化和编辑区域强度! 高级供需指标适用于所有产品和时间帧。 它是一个新的公式,非常新的功能是两个区域强度函数可由用户输入进行调整! 这在交易中是一大优势。 当您学习如何使用专有功能,例如带有价格游离最小 X 因子的区域强度时,您能够判断该区域强劲与否。 供需区域用作警报触发器
Matrix Arrow Indicator MT5
Juvenille Emperor Limited
5 (14)
矩阵箭头指标 MT5   是一种独特的 10 合 1 趋势,遵循   100% 非重绘多时间框架指标 ,可用于所有符号/工具: 外汇 、 商品 、 加密货币 、 指数 、 股票 。 Matrix Arrow Indicator MT5 将在其早期阶段确定当前趋势,从多达 10 个标准指标中收集信息和数据,它们是: 平均定向运动指数 (ADX) 商品渠道指数 (CCI) 经典 Heiken Ashi 蜡烛 移动平均线 移动平均收敛散度 (MACD) 相对活力指数 (RVI) 相对强弱指数 (RSI) 抛物线SAR 随机振荡器 威廉姆斯的百分比范围 当所有指标给出有效的买入或卖出信号时,相应的箭头将打印在图表上,在下一根蜡烛/柱线开盘时,指示强劲的上升趋势/下降趋势。用户可以选择使用哪些指标,并可以单独调整每个指标的参数。 Matrix Arrow Indicator MT5 仅从选定的指标中收集信息,并仅根据其数据打印箭头。   Matrix Arrow Indicator MT5   还可以为所有新信号发送终端、推送通知或电子邮件警报。无论您是黄牛、日内交易者还是波段交易者, Mat
Legacy of Gann for MT5
Pavel Zamoshnikov
5 (6)
The indicator very accurately determines the levels of the possible end of the trend and profit fixing. The method of determining levels is based on the ideas of W.D.Gann, using an algorithm developed by his follower Kirill Borovsky. Extremely high reliability of reaching levels (according to K. Borovsky  - 80-90%) Indispensable for any trading strategy – every trader needs to determine the exit point from the market! Precisely determines targets on any timeframes and any instruments (forex, met
Bill Williams Advanced
Siarhei Vashchylka
5 (7)
Bill Williams Advanced is designed for automatic chart analysis using Bill Williams' "Profitunity" system. The indicator analyzes four timeframes at once. Manual (Be sure to read before purchasing) Advantages 1. Automatically analyzes the chart using the "Profitunity" system of Bill Williams. The found signals are placed in a table in the corner of the screen. 2. Equipped with a trend filter based on the Alligator indicator. Most of the system signals are recommended to be used only accordi
该仪表盘显示所选符号的最新可用谐波形态,因此您可以节省时间并提高效率 /  MT4 版本 。 免费指标:  Basic Harmonic Pattern 指标列 Symbol:   显示所选符号 Trend:     看涨或看跌 Pattern:    形态类型(Gartley、蝴蝶、蝙蝠、螃蟹、鲨鱼、Cypher 或 ABCD) Entry:     入口价格 SL: 止损价 TP1: 第一止盈价 TP2: 第二次获利价格 TP3: 第三次获利价格 Current price:    当前价格 Age (in bars):   最后绘制的模式的年龄 主要输入 Symbols :   从 "28 种主要货币对 "或 "选定符号 "中选择。 Selected Symbols :   希望监控的符号,用逗号分隔("EURUSD,GBPUSD,XAUUSD")。如果您的经纪商为货币对设置了后缀或前缀,您必须在以下两个参数中添加(货币对前缀或货币对后缀)。 Max Iteration:   调整模式的最大迭代次数(如果该值越小,则模式越少,性能越快;如果该值越大,则模式越多,性能
Easy Buy Sell Signal Alert
Franck Martin
4.86 (7)
Easy By Sell is a market indicator for opening and closing positions. It becomes easy to track market entries with alerts. It indicates trend reversal points when a price reaches extreme values ​​and the most favorable time to enter the market. it is as effective as a Fibonacci to find a level but it uses different tools such as an algorithm based on ATR indicators and Stochastic Oscillator. You can modify these two parameters as you wish to adapt the settings to the desired period. My othe
介绍     Quantum Breakout PRO   ,突破性的 MQL5 指标,正在改变您交易突破区域的方式!由拥有超过13年交易经验的资深交易员团队开发,     量子突破 PRO     旨在通过其创新和动态的突破区域策略将您的交易之旅推向新的高度。 量子突破指标将为您提供带有 5 个利润目标区域的突破区域的信号箭头,以及基于突破框的止损建议。 它既适合新手交易者,也适合专业交易者。 量子 EA 通道:       点击这里 重要的!购买后请私信我领取安装手册。 建议: 时间范围:M15 货币对:GBPJPY、EURJPY、USDJPY、NZDUSD、XAUUSD 账户类型:ECN、Raw 或 Razor,点差极低 经纪商时间:GMT +3 经纪商:IC Markets、Pepperstone with Raw 和 Razor 的点差最低 规格: 不重漆! 最多 5 个建议利润目标区域 建议止损水平 可定制的盒子。您可以设置自己的 Box Time Start 和 Box Time End。 接触 如果您有任何疑问或需要帮
Volume by Price MT5
Brian Collard
5 (4)
The Volumebyprice.com  technical indicator for MetaTrader 5 features Volume Profile and Market Profile TPO (Time Price Opportunity). Volume and TPO histogram bar and line charts. Volume Footprint charts. TPO letter and block marker collapsed and split structure charts. Session filtering and grouping. Static, dynamic and flexible range segmentation and compositing methods with relative and absolute visualizations. Graphical layering, positioning and styling options to suit the user's analytic an
Dark Absolute Trend MT5
Marco Solito
5 (11)
Dark Absolute Trend   is an Indicator for intraday trading. This Indicator is based on   Trend Following  strategy but use also candlestick patterns and Volatility. We can enter in good price with this Indicator, in order to follow the main trend on the current instrument. It is advised to use low spread ECN brokers. This Indicator does   Not repaint   and   N ot lag . Recommended timeframes are M5, M15 and H1. Recommended working pairs: All. I nstallation and  Update Guide   -  Troubleshooting
Gartley Hunter Multi
Siarhei Vashchylka
5 (7)
Gartley Hunter Multi - An indicator for searching for harmonic patterns simultaneously on dozens of trading instruments and on all possible timeframes. Manual (Be sure to read before purchasing) | Version for MT4 Advantages 1. Patterns: Gartley, Butterfly, Shark, Crab. Bat, Alternate Bat, Deep Crab, Cypher 2. Simultaneous search for patterns on dozens of trading instruments and on all possible timeframes 3. Search for patterns of all possible sizes. From the smallest to the largest 4. A
Auto Order Block with break of structure based on ICT and Smart Money Concepts (SMC) Futures Break of Structure ( BoS )             Order block ( OB )            Higher time frame Order block / Point of Interest ( POI )    shown on current chart           Fair value Gap ( FVG ) / Imbalance   -  MTF      ( Multi Time Frame )    HH/LL/HL/LH  -  MTF      ( Multi Time Frame )  Choch  MTF      ( Multi Time Frame )  Volume Imbalance     ,  MTF          vIMB Gap’s Power of 3 Equal High
作者的更多信息
Spots EA
Ahmed Alaaeldin Abdulrahman Ahmed Elherzawi
4 (1)
The Spots Expert Advisor is the automated trading bot was created using the Spots indicator based on the common candlestick patterns such as: engulfing, hanging man, doji etc. The main objective for creating this EA is to have a fully automated and low drawdown bot. I'm sharing the first set file on the website, please feel free to optimize it for other pairs and with your forex broker using the preset parameters.
Investment Castle Supply and Demand
Ahmed Alaaeldin Abdulrahman Ahmed Elherzawi
5 (4)
Supply and Demand indicator does not repaint as it counts the number of tests/retests occurred in the past x number of times. As a trader you need a path to be able to place your buy and sell trades such as: Supply and Demand, Falling & raising channels . Experienced trades will draw the key levels and channels around the timeframes. But, they will not be able to draw them on the small time frames as the price changes too frequent. This indicator is based on Shved supply and demand indicator, b
FREE
Investment Castle EA MT4
Ahmed Alaaeldin Abdulrahman Ahmed Elherzawi
4.5 (2)
Introducing the Investment Castle Expert Advisor - the ultimate trend-based trading tool that comes with built-in Investment Castle and Psychological Key Levels indicators. Whether you're a novice or a seasoned trader, this powerful tool will help you make informed decisions and maximize profits. Features: Automated Support and Resistance Key Levels: Say goodbye to manual chart analysis! Our AI-driven software automatically identifies key levels of support and resistance, allowing you to make s
Chances
Ahmed Alaaeldin Abdulrahman Ahmed Elherzawi
5 (6)
The Investment Castle Chances indicator will show signals on the chart for entering a buy or sell trade. There are 2 types of signals for each direction as follows: Buy / Sell (Orange colored candlesticks) Strong Buy   (Green colored candlesticks)  / Strong Sell  (Red colored candlesticks) You may place a buy trade once you see the Buy arrow or vise versa, or you might prefer to wait for a further confirmation “Strong Buy” / “Strong Sell”. This indicator works best with the high time frames H1,
FREE
Gold Indicator
Ahmed Alaaeldin Abdulrahman Ahmed Elherzawi
5 (1)
This indicator uses horizontal lines to identify support and resistance levels based on Zigzag legs and On-Balance Volume (OBV) analysis. Here is a summary of how the indicator works: Resistance and Support Lines : A horizontal line above the current price level indicates resistance. A horizontal line below the current price level indicates support. Drawing Horizontal Lines : Draw horizontal lines on every Zigzag leg within the last X legs, where X is a specified number (e.g., 10). Only the most
FREE
Channels Indicator MT5
Ahmed Alaaeldin Abdulrahman Ahmed Elherzawi
4.8 (5)
Channels indicator does not repaint as its based on projecting the falling and raising channels. As a trader you need a path to be able to place your buy and sell trades such as: Supply and Demand , Falling & raising channels. Falling and raising channels can be in any time frame and also can be in all time frames at the same time and the price always flows within these channels. Experienced trades will draw the key levels and channels around the time frames. But, they will not be able to draw
FREE
Investment Castle RSI Divergence MT5
Ahmed Alaaeldin Abdulrahman Ahmed Elherzawi
The RSI Divergence Indicator is a powerful tool designed to identify potential reversals in the market by spotting discrepancies between the Relative Strength Index (RSI) and price movement. Divergences can be a significant indication of an impending trend change, either from bullish to bearish or vice versa. This indicator is built for making the task of identifying potential trade opportunities more straightforward and efficient. Features: Automatic Detection:   The indicator scans the cha
FREE
Investment Castle Trend Lines
Ahmed Alaaeldin Abdulrahman Ahmed Elherzawi
5 (5)
All traders should know the trend before making their decision when placing the buy or sell orders. The first step always starts with  supply and demand ,   rising and falling channels , trend lines, engulfing candles etc. All the above contribute to what is called “Price Action” and that is the best and most reliable way in trading and catching the trend and making profits, without stress. The  Investment Castle Trend Line Indicator  will automatically draw the trend lines on the MT5 for you.
FREE
Investment Castle Indicator
Ahmed Alaaeldin Abdulrahman Ahmed Elherzawi
4.8 (5)
介紹 旨在解決以下問題的投資城堡指標創建: 1.在不同的時間範圍內確定趨勢的正確方向。 2.在圖表上顯示命中率,獲勝率。 3.該指標不會重新繪製圖表。 4.該指標內置在 Investment Castle EA 中。 *在網站上查看設置的文件,更新和更多信息: https://www.investmentcastle.com 免責聲明 應該清楚地將“ Investment Castle Indicator”和所有帶有其名稱的產品視為交易者可以用來支持其交易的工具。牢記這一點,該工具的效果或有效性完全取決於交易者的投入和/或優化。 強烈建議您,作為交易者,首先要完全熟悉投資城堡指標產品,首先要對模擬或試用帳戶中各種參數的輸入設置進行全面回測,然後再使用投資城堡指標。一個真實賬戶,以便體驗和理解每個參數集如何相互對應,以使投資城堡指標如交易員所設定的那樣起作用。 因此,無論是好是壞,交易者交易經驗的結果,都只是對交易者理解的純粹而直接的反映,並且具有優化和利用投資城堡指標所提供的廣泛功能的能力。
FREE
Spots
Ahmed Alaaeldin Abdulrahman Ahmed Elherzawi
The Spots Indicator can be used for Entering and Exiting your trades based on the common candlestick patterns such as: engulfing, hanging man, doji etc. It is designed to publish desktop and mobile notification every time a signal is triggered. However, it is worth noting that this indicator is recommended to be used with other indicator for confirming the entries. It is best to use it with the Investment Castle Trend Lines indicator  and the Supply and Demand indicator .
FREE
Investment Castle Support and Resistance
Ahmed Alaaeldin Abdulrahman Ahmed Elherzawi
5 (5)
Investment Castle Support and Resistance Indicator has the following features: 1.  Dictates the direction of Buy or Sell trades based on Support and Resistance Levels automatically . 2.  Candles stick colors will change to Red for Sell and Blue for Buy (Default settings, user can change from the inputs). 3. This indicator is built-in the Support & Resistance based Investment Castle EA which works with Psychological Key Levels "Support & Resistance".
FREE
Investment Castle RSI Divergence
Ahmed Alaaeldin Abdulrahman Ahmed Elherzawi
RSI 差异指标是一个强大的工具,设计用于通过发现相对强度指数(RSI)和价格运动之间的差异来识别市场中的潜在反转。差异可能是即将发生的趋势变化的重要指示,从看涨转为看跌或反之亦然。此指标的目的是使识别潜在交易机会的任务变得更简单和高效。 特点: 自动检测:指标扫描图表查找RSI差异并自动绘制箭头以指示潜在的交易机会。 买卖信号: 绿色向上箭头:基于看涨的RSI差异建议潜在的购买机会。 红色向下箭头:基于看跌的RSI差异建议潜在的销售机会。 差异强度识别:指标区分弱和强的差异,为交易者提供更细微的见解。 强烈的差异:由粗箭头表示。 微弱的差异:由更淡的箭头表示。 移动通知:内置的移动通知功能确保您即使在移动时也永远不会错过潜在的交易信号。一旦发现差异,指标会向您的移动设备发送推送通知。 自定义设置:用户可以调整RSI期间、超买和超卖水平以及其他设置,以根据其交易风格和偏好调整指标。 工作原理: 看涨差异(购买信号):当价格形成一个新的更低的低点,但RSI形成一个更高的低点时发生。这种差异可能表明潜在的上行反转。 看跌差异(卖出信号):当价格形成一个新的更高的高点,但RSI形成一个较低的
FREE
Chances MT4
Ahmed Alaaeldin Abdulrahman Ahmed Elherzawi
5 (2)
The Investment Castle Chances indicator will show signals on the chart for entering a buy or sell trade. There are 2 types of signals for each direction as follows: Buy / Sell (Orange colored candlesticks) Strong Buy (Green colored candlesticks)  / Strong Sell  (Red colored candlesticks) You may place a buy trade once you see the Buy arrow or vise versa, or you might prefer to wait for a further confirmation “Strong Buy” / “Strong Sell”. This indicator works best with the high time frames H1, H
FREE
Investment Castle Engulfing
Ahmed Alaaeldin Abdulrahman Ahmed Elherzawi
4.5 (2)
Whether you are a scalper or daily trader, you will always look for bullish / bearish engulfing candles. This can be a bit tricky and stressful when you try to visually identify the engulfing candles on the chart. Not only that, you might be trading on the M15 time frame but the engulfing candle is forming or has already formed in the H4 time frame. This indicator is made to do that on your behalf. You can trade on any time frame and see Engulfing candles of another time frame, this means that
FREE
Investment Castle II MT4
Ahmed Alaaeldin Abdulrahman Ahmed Elherzawi
5 (1)
The Investment castle II ea trading robot has a variety of features, including: The ability to remember open positions, their take profit and stop loss levels if the VPS or terminal is restarted. The ability to remember trade buttons and their setup if the VPS or terminal is restarted. The ability to plot profit/loss on a chart, but only when the user runs the visualizer and on live charts. It automatically disables this feature when backtesting or optimizing settings for improved speed and perf
Spots MT4
Ahmed Alaaeldin Abdulrahman Ahmed Elherzawi
The Spots Indicator can be used for Entering and Exiting your trades based on the common candlestick patterns such as: engulfing, hanging man, doji etc. It is designed to publish desktop and mobile notification every time a signal is triggered. However, it is worth noting that this indicator is recommended to be used with other indicator for confirming the entries. It is best to use it with the   Investment Castle Trend Lines indicator  and the   Supply and Demand indicator
FREE
Investment Castle Trend Lines MT4
Ahmed Alaaeldin Abdulrahman Ahmed Elherzawi
5 (3)
All traders should know the trend before making their decision when placing the buy or sell orders. The first step always starts with  supply and demand , rising and falling channels , trend lines, engulfing candles etc. All the above contribute to what is called “Price Action” and that is the best and most reliable way in trading and catching the trend and making profits, without stress. The  Investment Castle Trend Line Indicator  will automatically draw the trend lines on the MT4 for you. An
FREE
Investment Castle Indicator MT4
Ahmed Alaaeldin Abdulrahman Ahmed Elherzawi
4.89 (9)
Investment Castle Indicator has the following features: 1.  Dictates the direction of the trend in different Timeframes . 2.   Shows the hit rate and winning rate on the chart. 3. This indicator does not repaint the chart. 4. This indicator is built-in the Support & Resistance based Investment Castle EA which works with   Psychological Key Levels "Support & Resistance" Indicator.
FREE
Investment Castle Support and Resistance MT4
Ahmed Alaaeldin Abdulrahman Ahmed Elherzawi
4.71 (7)
Investment Castle Support and Resistance Indicator has the following features: 1.  Dictates the direction of Buy or Sell trades based on Support and Resistance Levels automatically . 2.  Candles stick colors will change to Red for Sell and Blue for Buy (Default settings, user can change from the inputs). 3. This indicator is built-in the Support & Resistance based Investment Castle EA which works with Psychological Key Levels "Support & Resistance".
FREE
Channels Indicator
Ahmed Alaaeldin Abdulrahman Ahmed Elherzawi
4 (1)
Channels indicator does not repaint as its based on projecting the falling and raising channels. As a trader you need a path to be able to place your buy and sell trades such as: Supply  and Demand , Falling & raising channels. Falling and raising channels can be in any time frame and also can be in all time frames at the same time and the price always flows within these channels. Experienced trades will draw the key levels and channels around the timeframes. But, they will not be able to draw
FREE
Investment Castle Supply and Demand MT4
Ahmed Alaaeldin Abdulrahman Ahmed Elherzawi
Supply and Demand indicator does not repaint as it counts the number of tests/retests occurred in the past x number of times. As a trader you need a path to be able to place your buy and sell trades such as: Supply and Demand, Falling & raising channels . Experienced trades will draw the key levels and channels around the timeframes. But, they will not be able to draw them on the small time frames as the price changes too frequent. This indicator is based on Shved supply and demand indicator, b
FREE
Investment Castle Volatility Index
Ahmed Alaaeldin Abdulrahman Ahmed Elherzawi
5 (2)
Investment Castle Volatility Index has the following features: 1. This indicator shows the volumes of the current symbol and the market volatility. 2. This indicator is built-in in the Investment Castle EA which works as volatility index for the EA dynamic distance and opposite start. 3. Parameters available for optimization for each pairs. 4. Works with any chart.
FREE
Layering MT4
Ahmed Alaaeldin Abdulrahman Ahmed Elherzawi
This tool is very helpful when trading and increasing the profits by placing certain trades (defined in the settings) with equal distances when you place Buy / Sell orders. It helps in securing the account by using the layering method. Once the price hits the first TP, the EA will move the SL to the entry level, then once the price hits the 2nd TP, the EA will move the price to the first TP level. All the TP and SL generated by the EA can be manually adjusted on the chart itself. It works on any
Combined
Ahmed Alaaeldin Abdulrahman Ahmed Elherzawi
5 (1)
Welcome to Investment Castle products This product is exclusively available in the MQL5 market and is not available and will not be available anywehere else. The Combined indicator is a multi-time frame indicator and it is built using 3 indicators: Bands indicator which draws the support and resistance key levels using up to 5 different time frames Patterns indicator which draws the chart patterns using up to 6 different time frames Spots indicator which shows the common candlestick patterns Yo
Ultimate MT4
Ahmed Alaaeldin Abdulrahman Ahmed Elherzawi
5 (1)
Dashboard, TP line and Profit/Loss labels are set to false by default for speeding up the optimization. Switch them to True before you start. There are many strategies inside this EA as follows: - Entry based on indicator signal "as shown on the   trend indicator " - Opposite to trade entry with opposite martingale - Entries based on " support and resistance indicator ". - Normal martingale - Normal martingale with distance multiplier - Normal martingale with volatility index - Opposite marting
Ultimate
Ahmed Alaaeldin Abdulrahman Ahmed Elherzawi
4 (1)
Dashboard, TP line and Profit/Loss labels are set to false by default for speeding up the optimization. Switch them to True before you start. There are many strategies inside this EA as follows: - Entry based on indicator signal "as shown on the trend indicator " - Opposite to trade entry with opposite martingale - Entries based on " support and resistance indicator ". - Normal martingale - Normal martingale with distance multiplier - Normal martingale with volatility index - Opposite martingal
The Panel MT4
Ahmed Alaaeldin Abdulrahman Ahmed Elherzawi
The Panel will read the floating profit/loss for the symbol of your chart and will plot the profit/loss numbers on the chart. It will work with manual trades or trades made by any expert advisor. The Panel shows the Max Drawdown in the base currency, floating profit/loss for both buy and sell orders. It will also show the same in Pips. The Panel is movable on the chart, so you can drag it using the mouse cursor.
FREE
Investment Castle Engulfing MT4
Ahmed Alaaeldin Abdulrahman Ahmed Elherzawi
Whether you are a scalper or daily trader, you will always look for bullish / bearish engulfing candles. This can be a bit tricky and stressful when you try to visually identify the engulfing candles on the chart. Not only that, you might be trading on the M15 time frame but the engulfing candle is forming or has already formed in the H4 time frame. This indicator is made to do that on your behalf. You can trade on any time frame and see Engulfing candles of another time frame, this means that y
FREE
The Panel
Ahmed Alaaeldin Abdulrahman Ahmed Elherzawi
The Panel will read the floating profit/loss for the symbol of your chart and will plot the profit/loss numbers on the chart. It will work with manual trades or trades made by any expert advisor. The Panel shows the Max Drawdown in the base currency, floating profit/loss for both buy and sell orders. It will also show the same in Pips. The Panel is movable on the chart, so you can drag it using the mouse cursor.
FREE
Investment Castle Volatility Index MT4
Ahmed Alaaeldin Abdulrahman Ahmed Elherzawi
3.67 (3)
Investment Castle Volatility Index has the following features: 1. This indicator shows the volumes of the current symbol and the market volatility. 2. This indicator is built-in in the Investment Castle EA which works as volatility index for the EA dynamic distance and opposite start. 3. Parameters available for optimization for each pairs. 4. Works with any chart.
FREE
筛选:
Alex Candela
530
Alex Candela 2022.02.23 12:27 
 

用户没有留下任何评级信息

回复评论