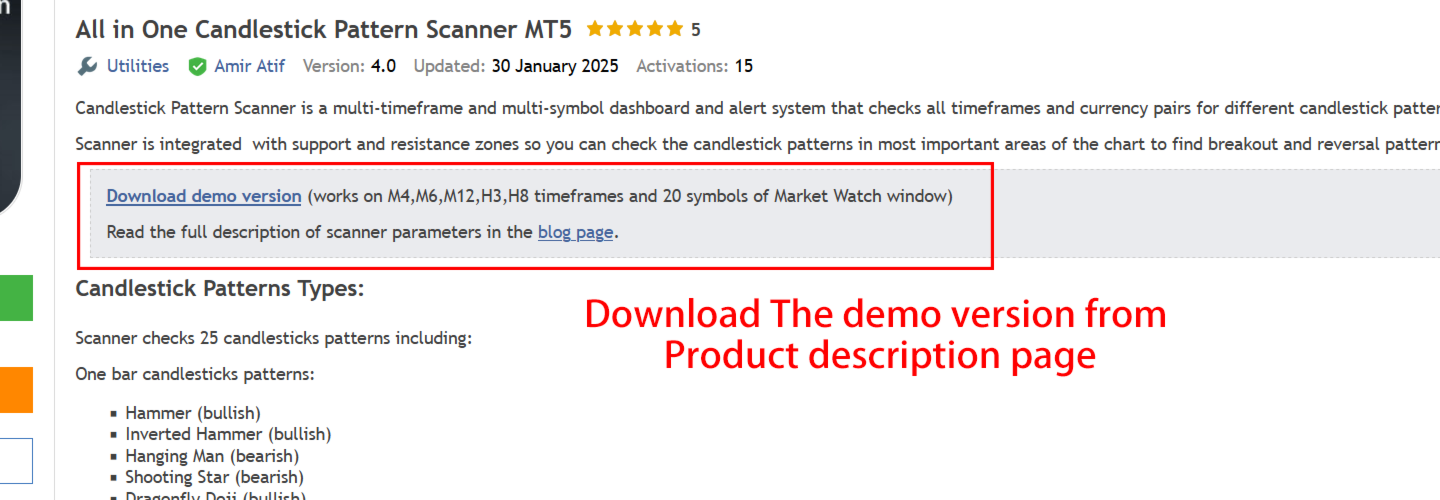
All in One Candlestick Pattern Scanner MT5
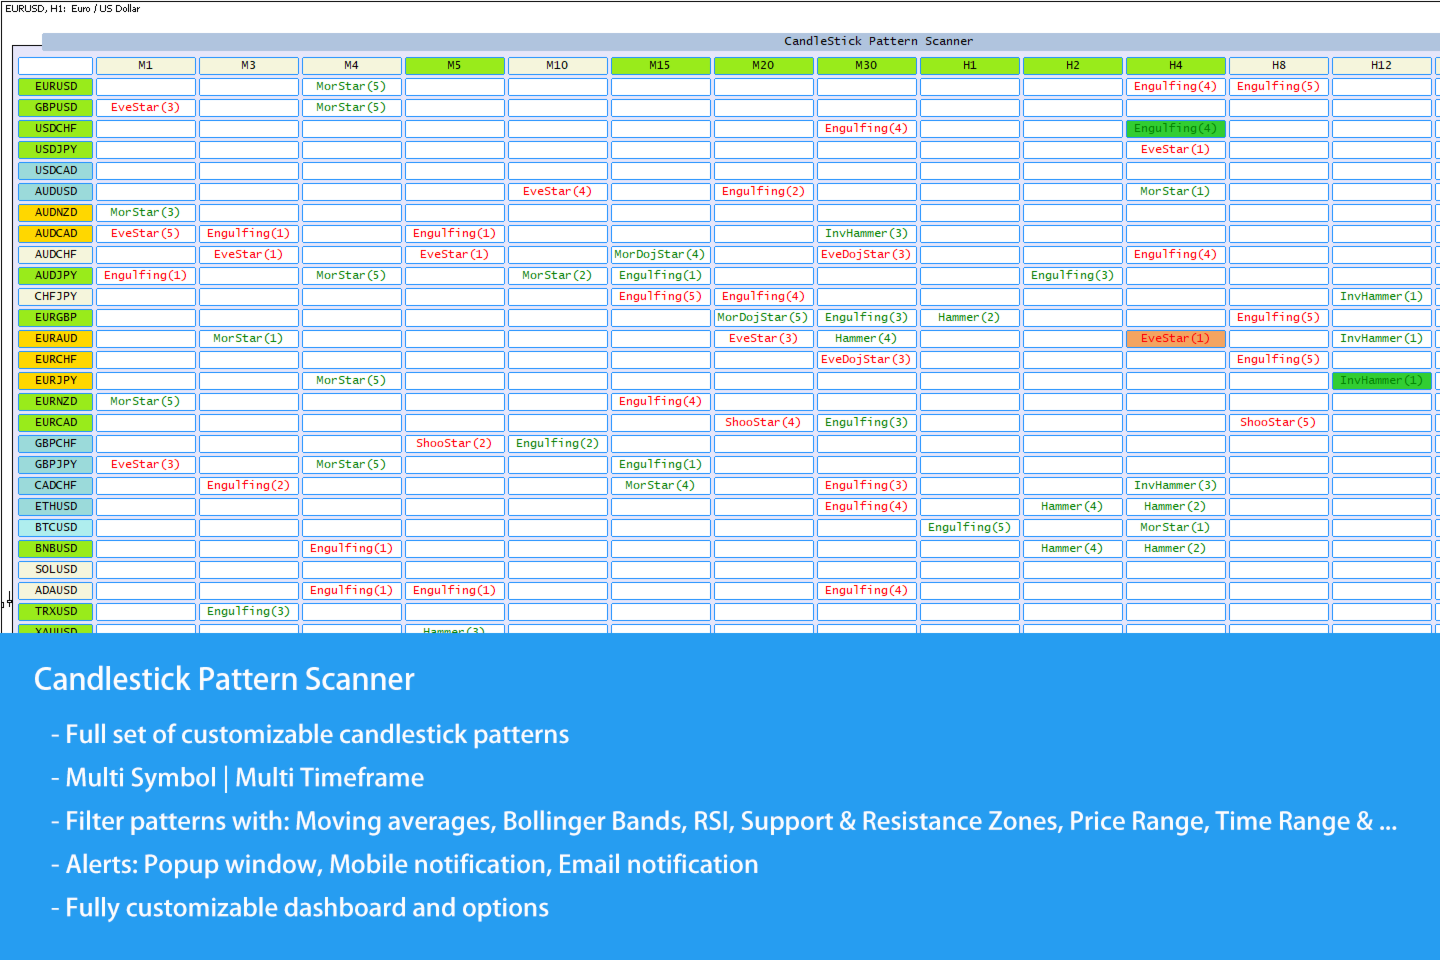
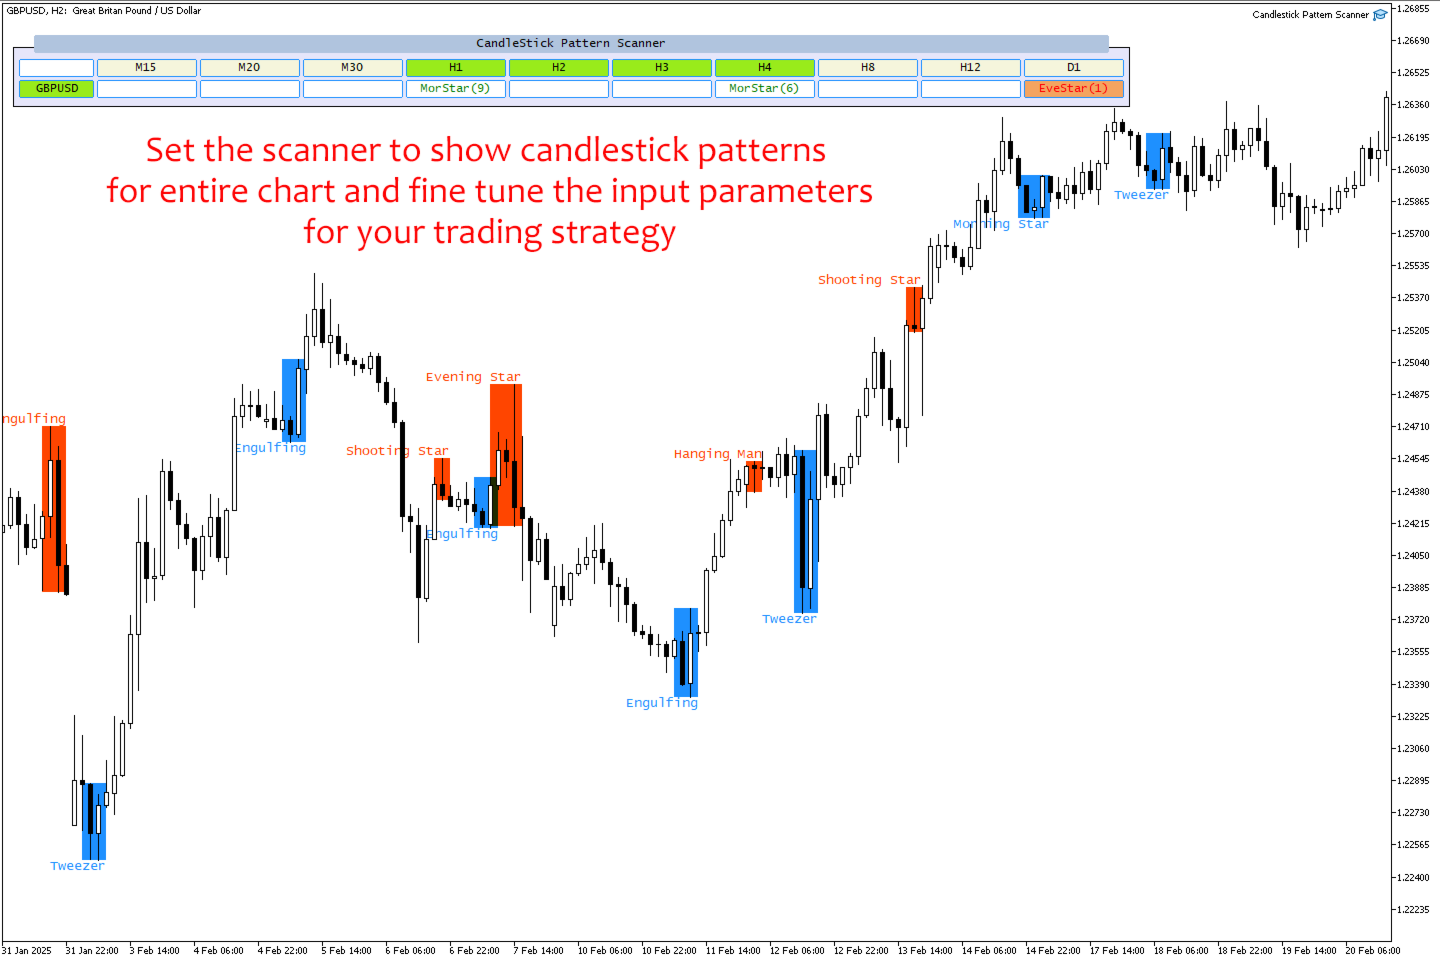
Candlestick Pattern Scanner is a multi-timeframe and multi-symbol dashboard and alert system that checks all timeframes and currency pairs for different candlestick patterns that are formed in them.
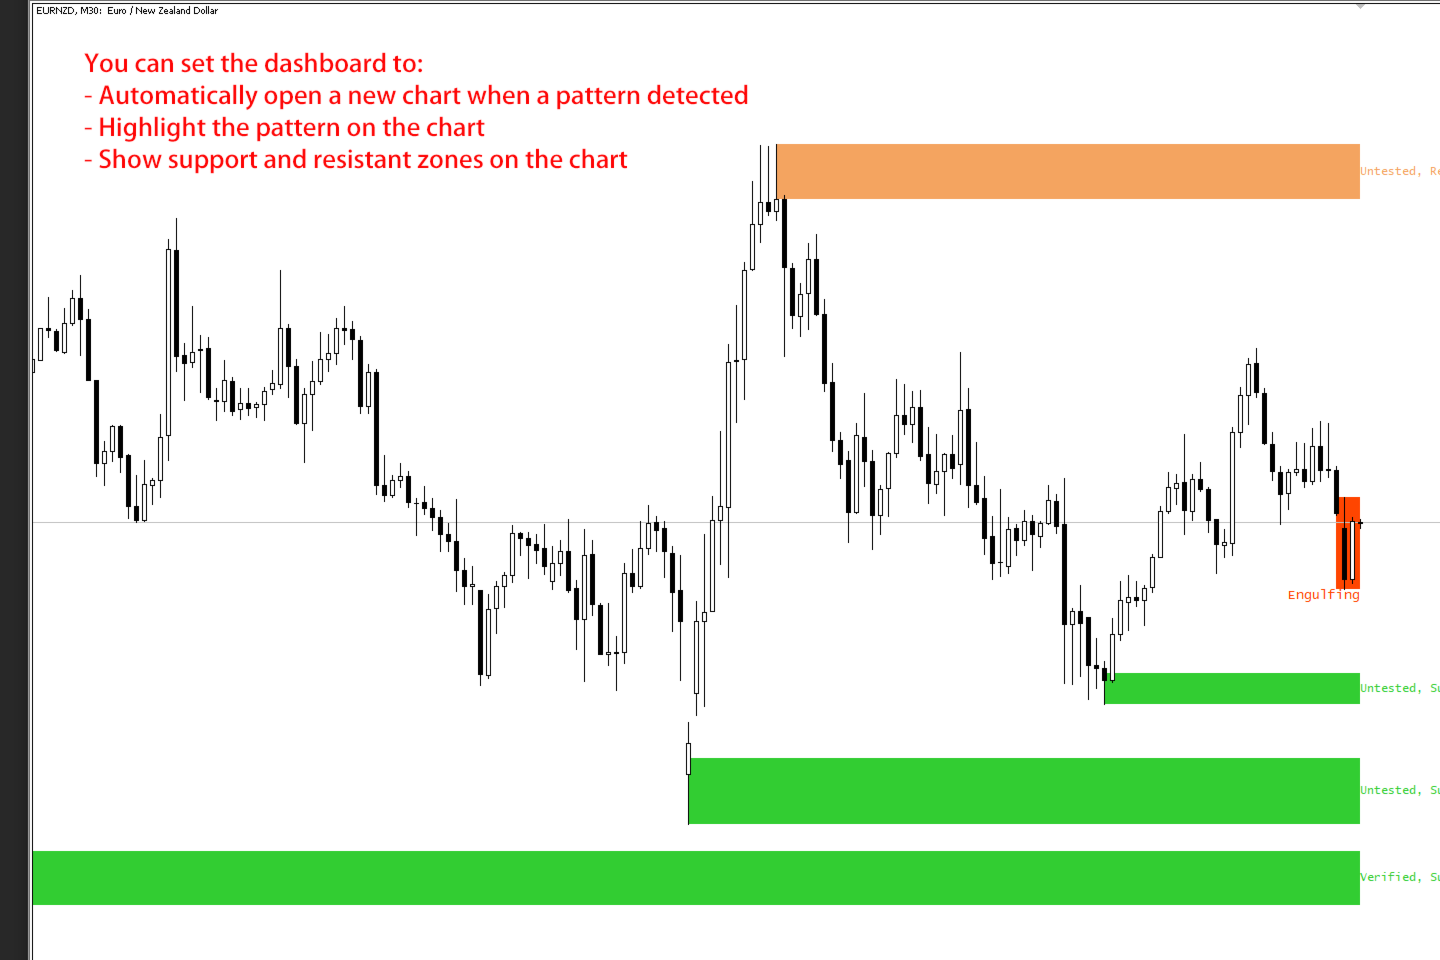
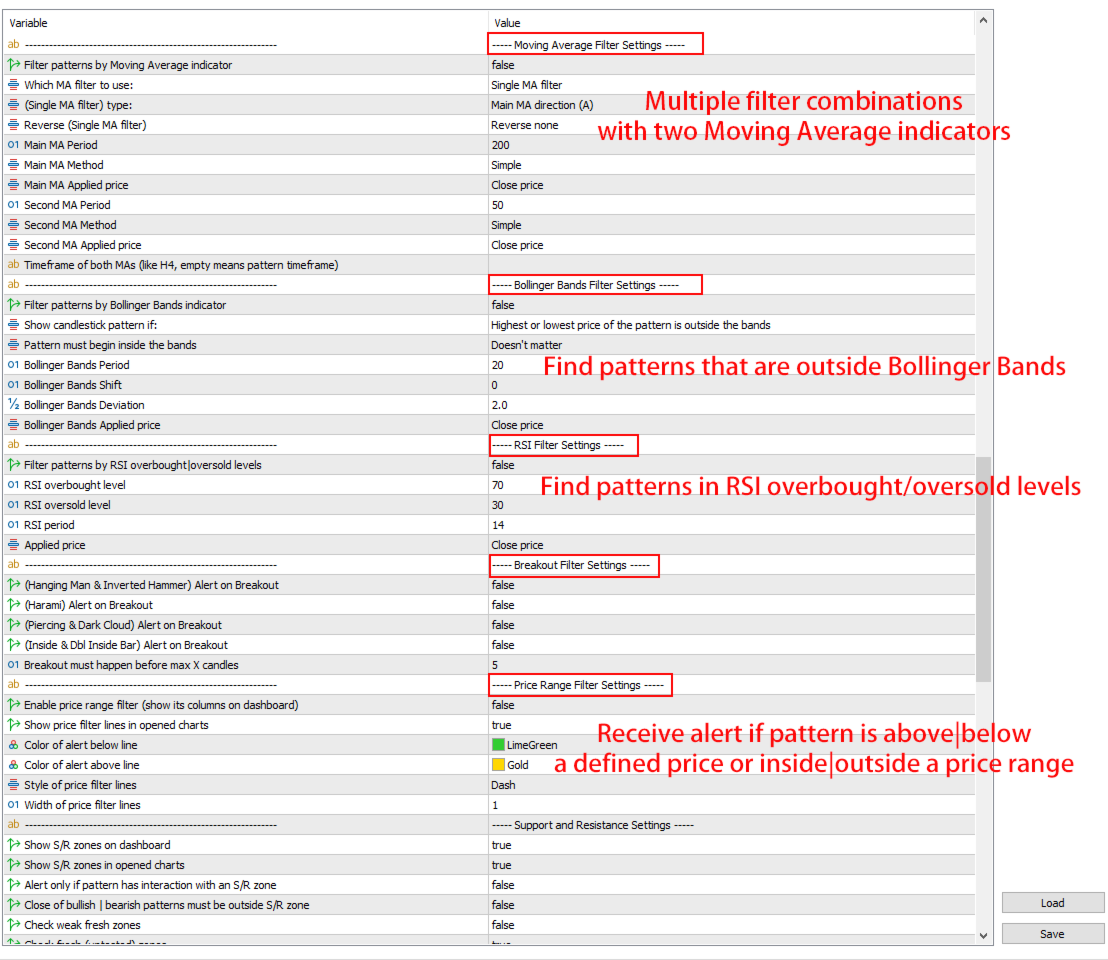
Scanner is integrated with support and resistance zones so you can check the candlestick patterns in most important areas of the chart to find breakout and reversal patterns in the price chart.
Download demo version (works on M4,M6,M12,H3,H8 timeframes and 20 symbols of Market Watch window)
Read the full description of scanner parameters in the blog page.
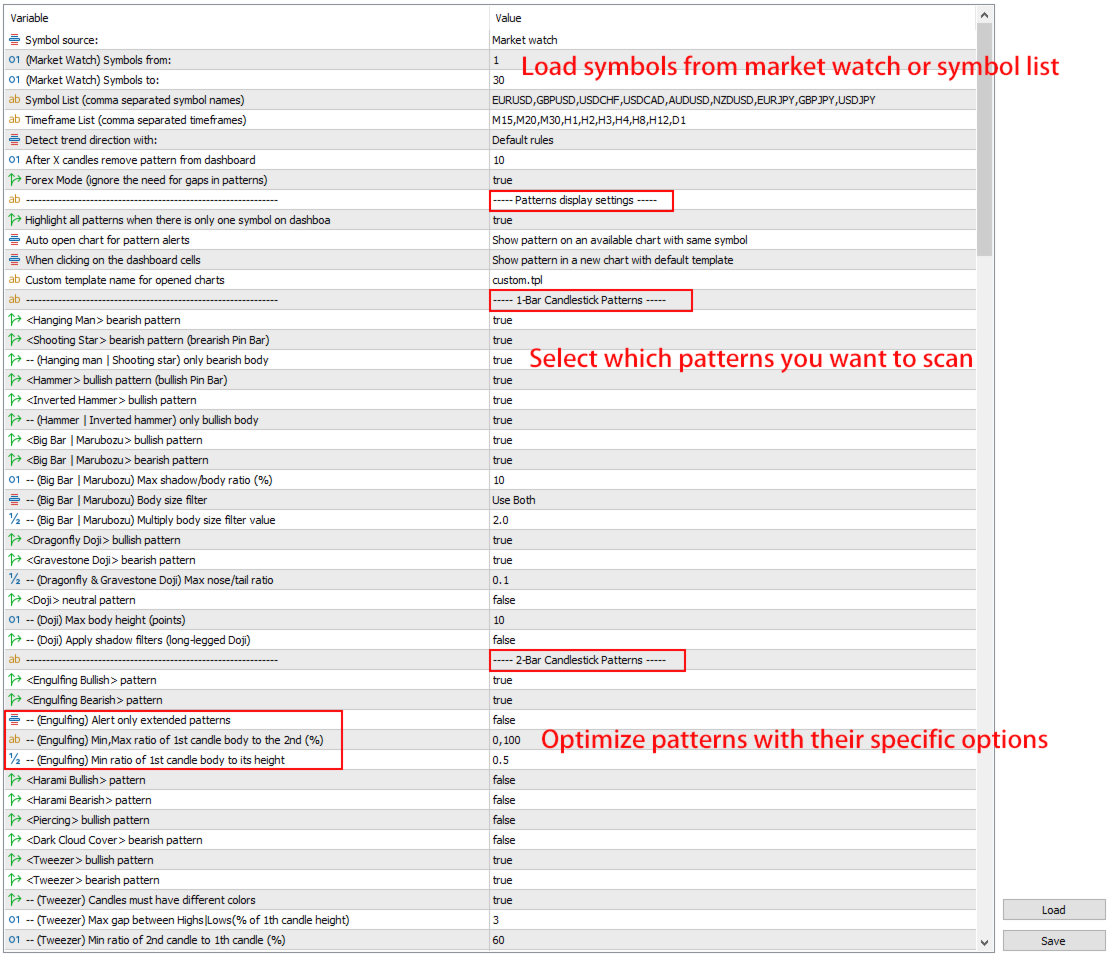
Candlestick Patterns Types:
Scanner checks 25 candlesticks patterns including:
One bar candlesticks patterns:
- Hammer (bullish)
- Inverted Hammer (bullish)
- Hanging Man (bearish)
- Shooting Star (bearish)
- Dragonfly Doji (bullish)
- Gravestone Doji (bearish)
- Doji Star (neutral)
- Marubozu | Big Bar (bullish and bearish)
- Pin Bar (bullish and bearish) (equivalent to hammer, inverted hammer, shooting star and hanging man)
Two bar candlesticks patterns:
- Engulfing (bullish and bearish)
- Inside Bar (neutral)
- Outside Bar (neutral)
- Harami (bullish and bearish)
- Piercing (bullish)
- Dark Cloud Cover (bearish)
- Tweezer (bullish and bearish)
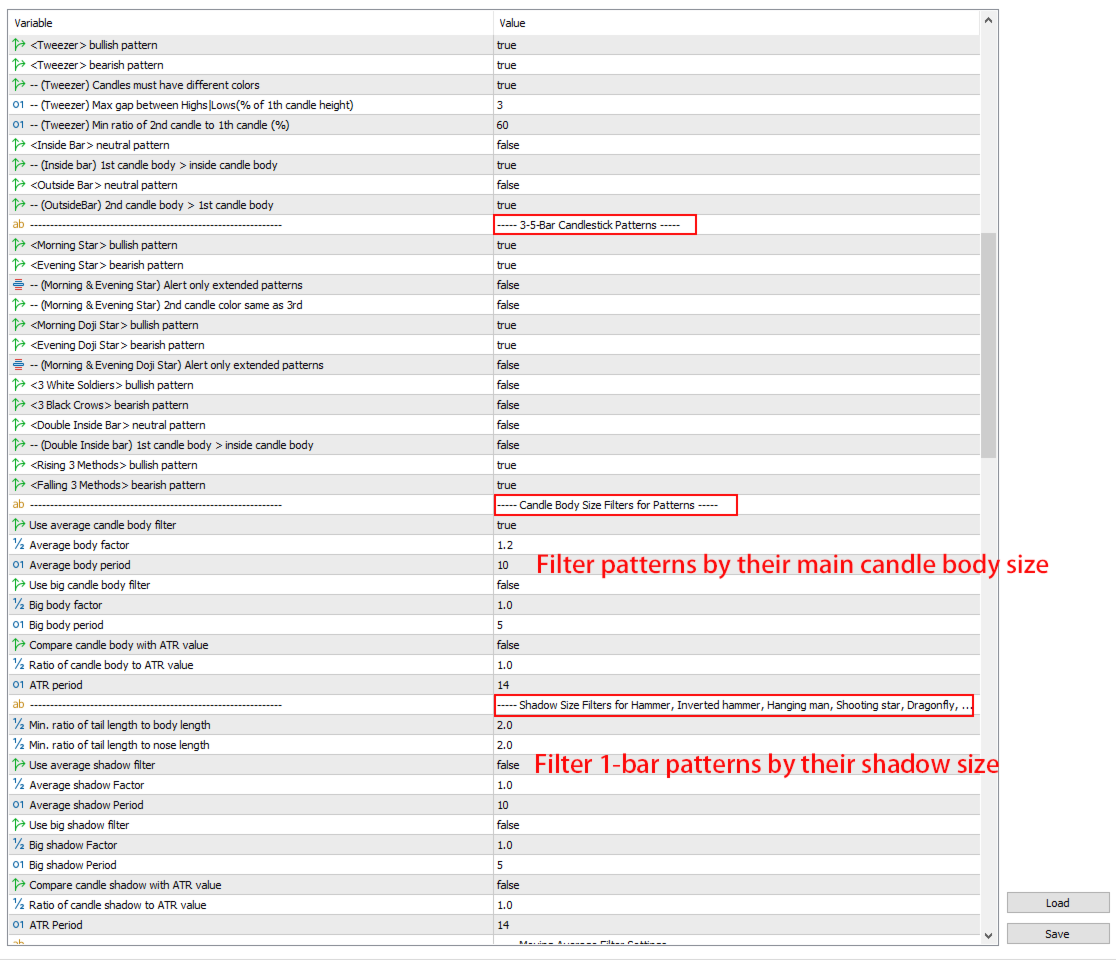
Three bar candlesticks patterns:
- Evening Star (bearish)
- Morning Star (bullish)
- Evening Doji Star (bearish)
- Morning Doji Star (bullish)
- 3 White Soldiers (bullish)
- 3 Black Crows (bearish)
- Double inside (neutral)
Five bar candlesticks patterns:
- Rising Three Methods (bullish)
- Falling Three Methods (bearish)
Candlestick Pattern Scanner Features:
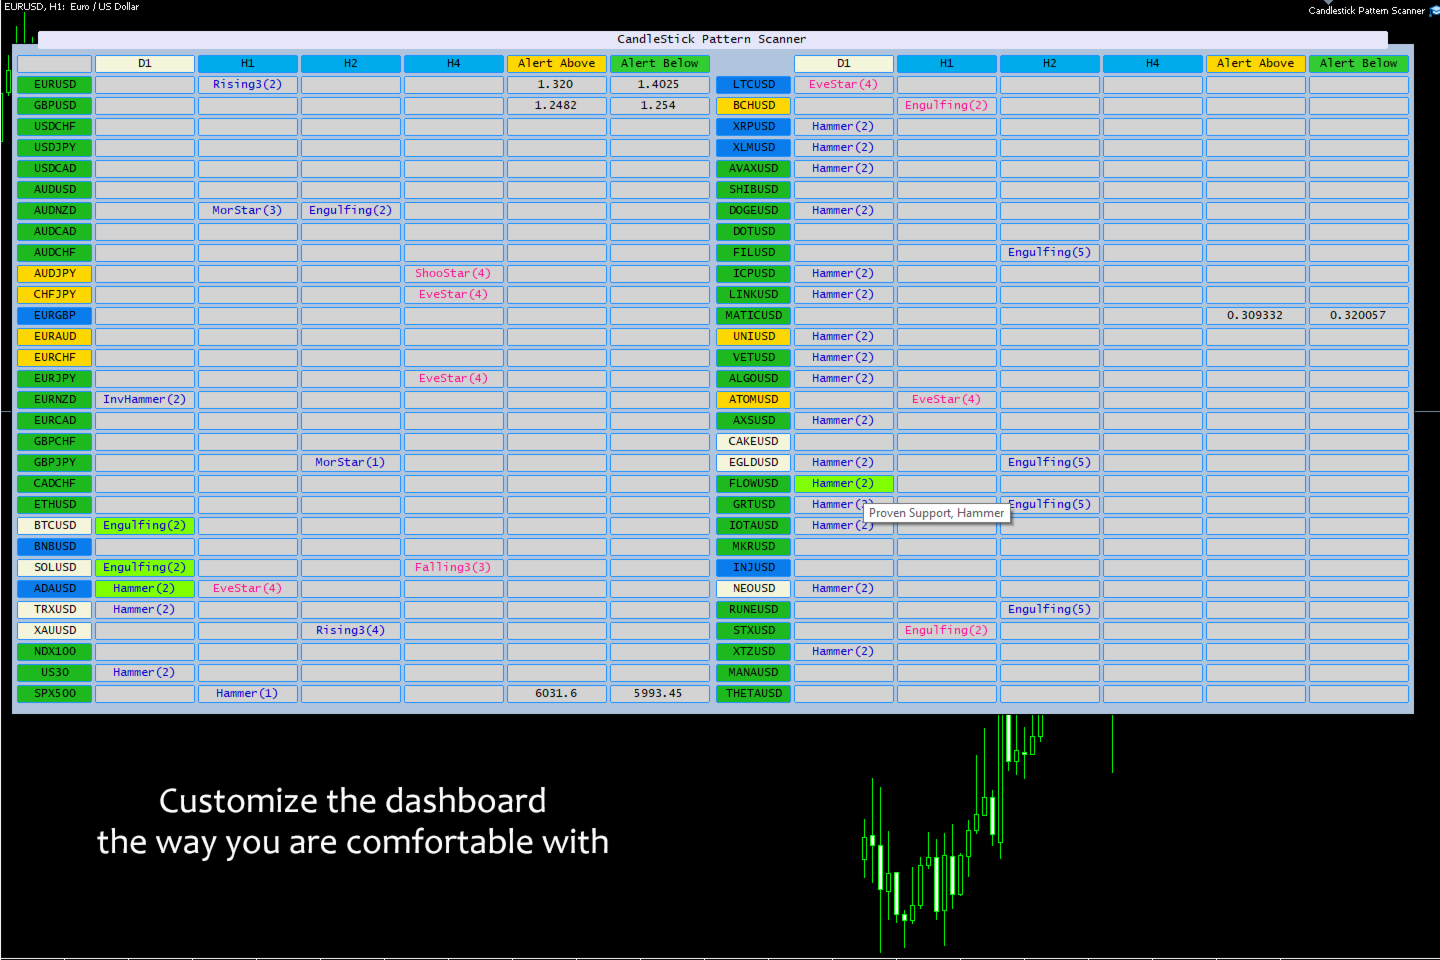
- Run the dashboard on one chart and see the candlestick patterns for all selected symbols and timeframes.
- You can split the symbols into 2 columns to show more symbols on the chart
- You can separate symbols into multiple dashboards with different parameters for each dashboard (for example for different markets).
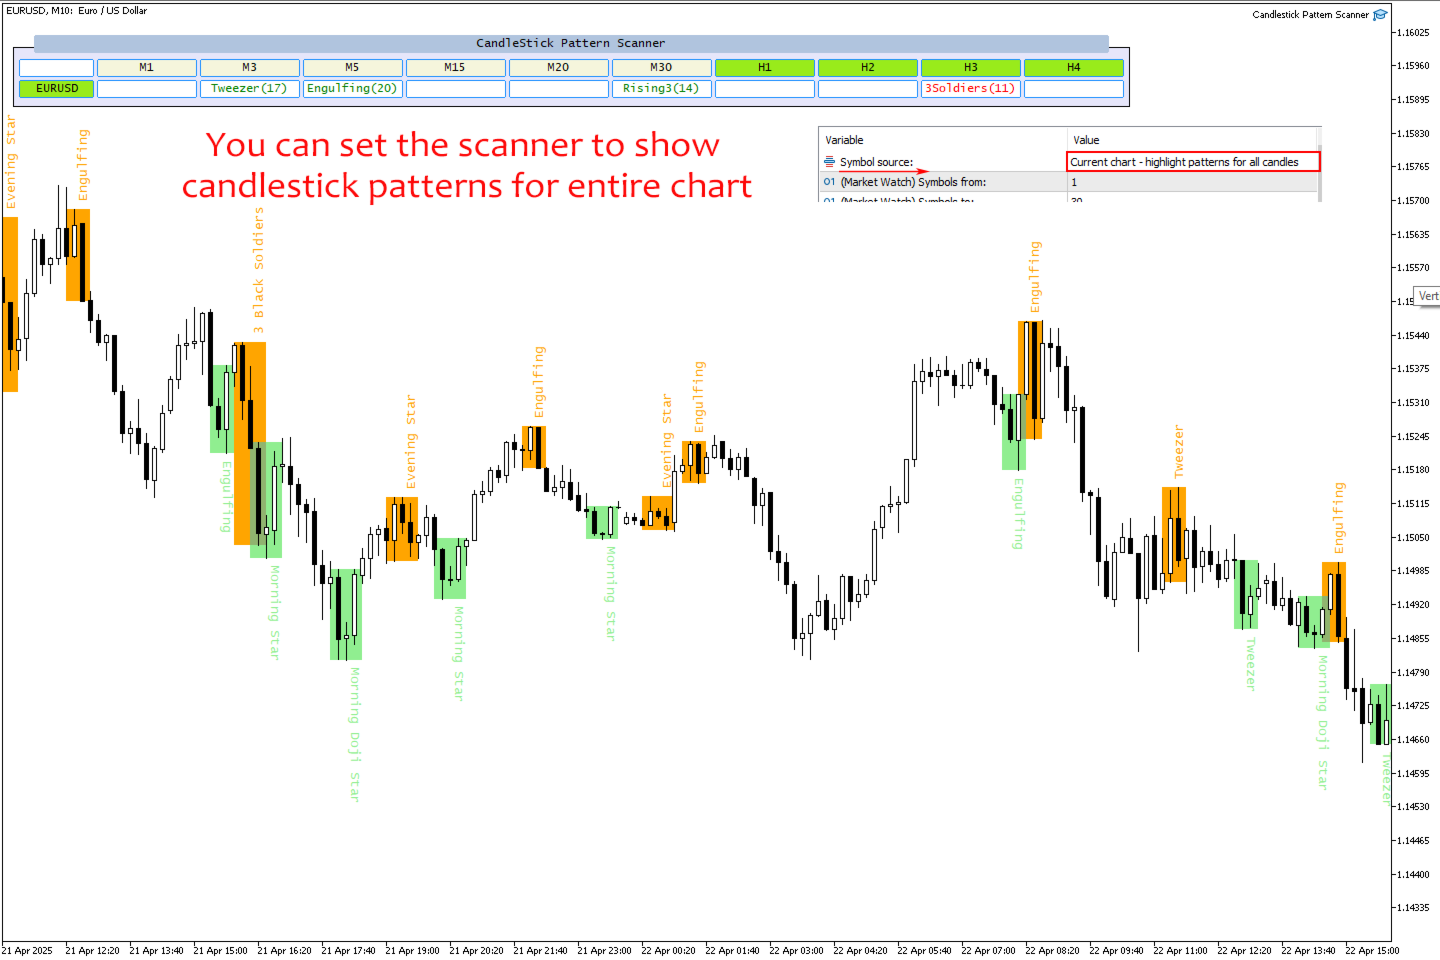
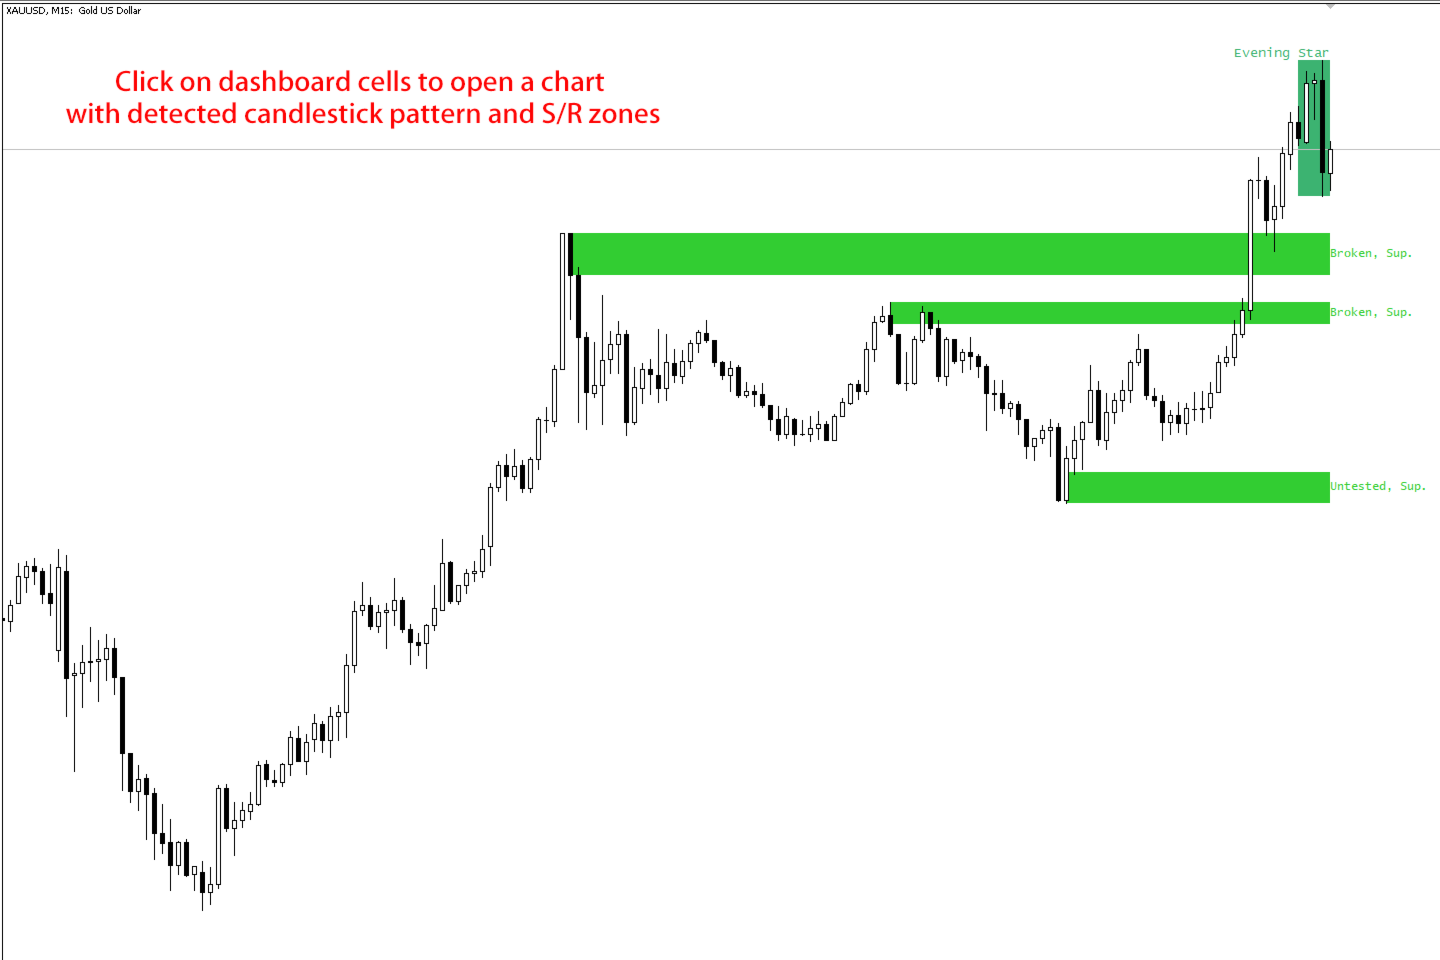
- You can click on dashboard cells and open the symbol and timeframe in the new chart showing the highlighted pattern and S/R zone.
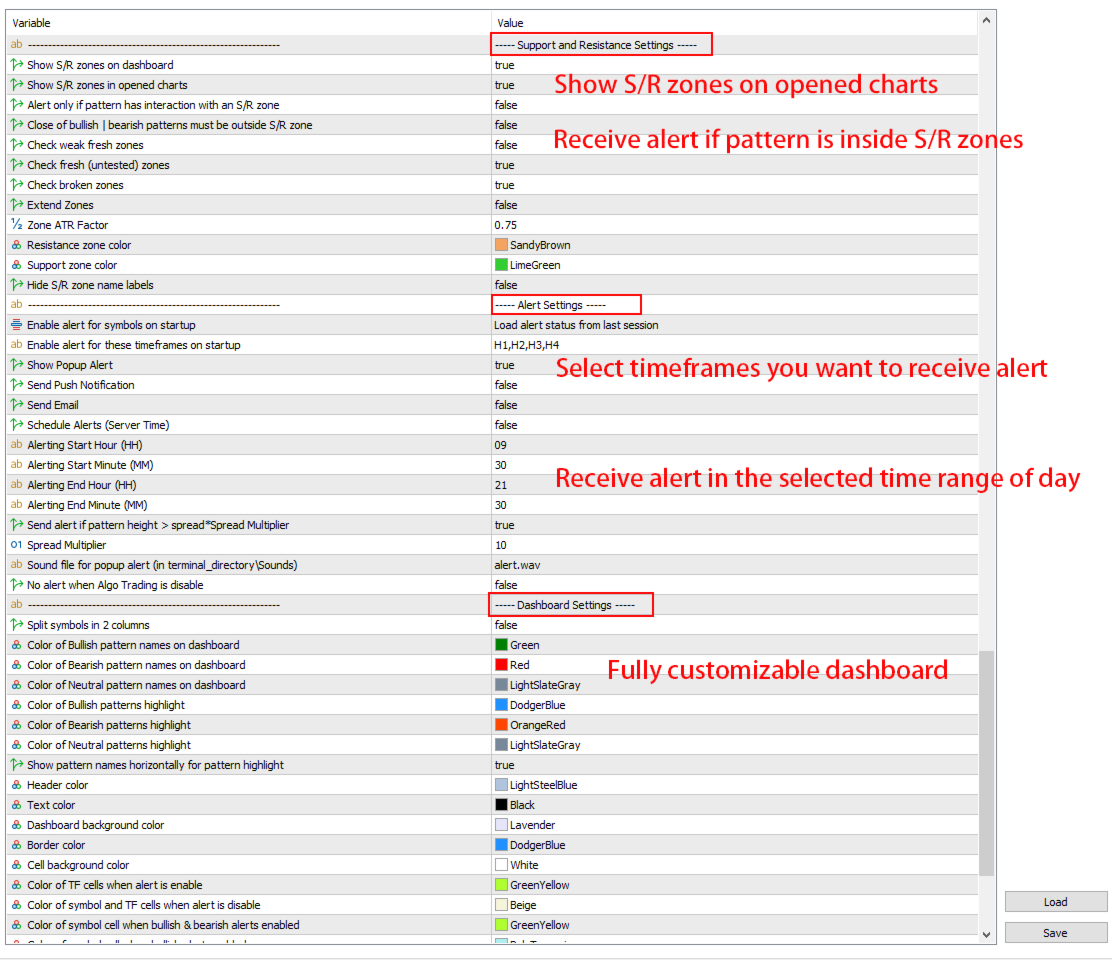
- There are a full set of parameters for customizing the appearance of the panel.
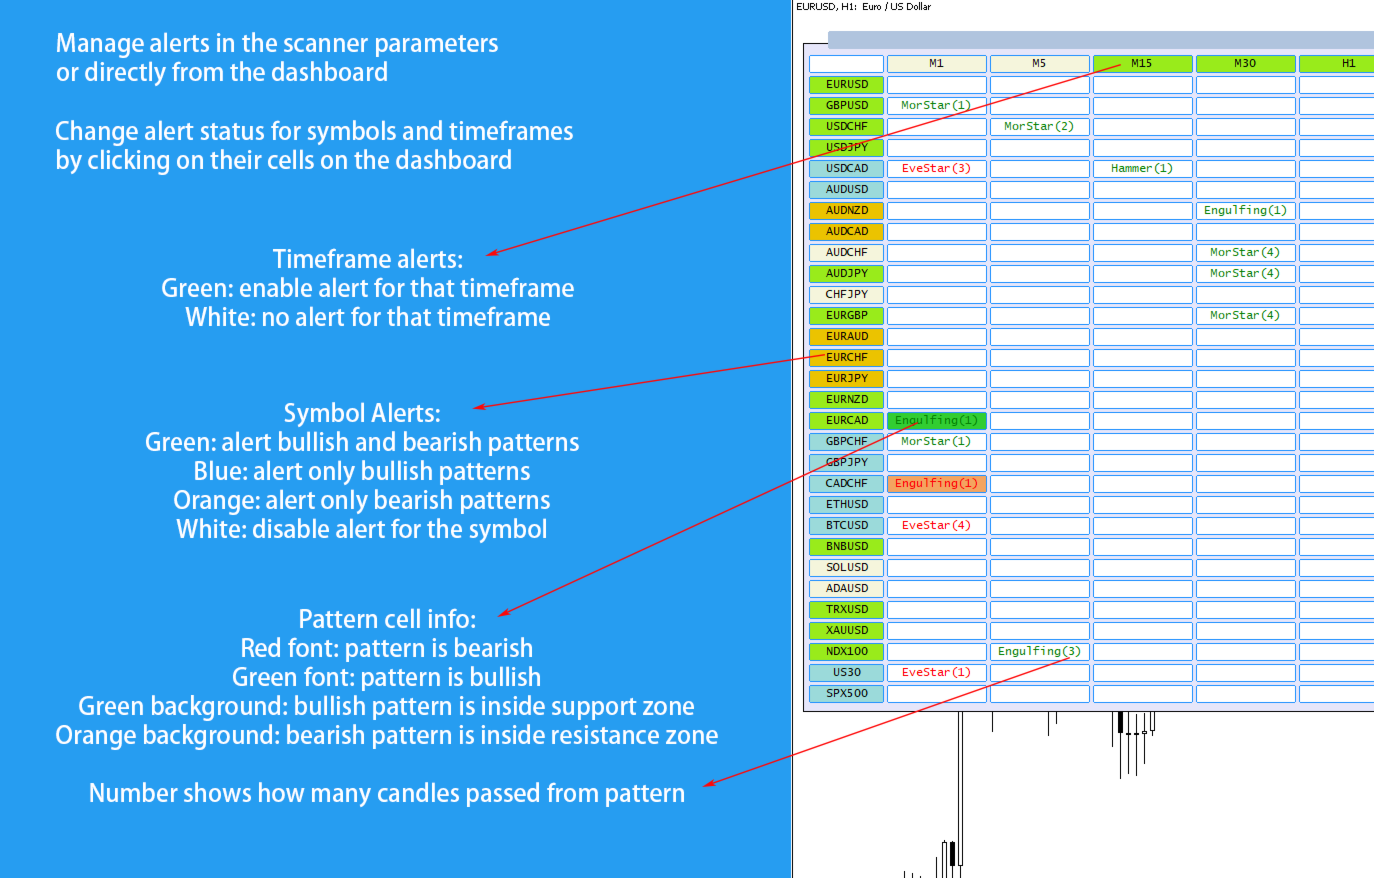
- You can enable/disable alerts for symbols and timeframes directly from the scanner panel.
- Scanner works in all markets (Forex, Stocks, Indices, Commodities, Crypto ...), you can write the symbol names in the settings (comma separated) or simply set the scanner to read the symbols from market watch.
Integrated with support and resistance zones
- You can set the scanner to only receive alerts for patterns that are inside the support and resistance zones.
- You can see the type of support and resistance zones through cell colors and strength of the zones by hovering the mouse pointer on the panel cells.
- You can set the parameters for support and resistance zones in scanner input parameters.
Use the power of Candlestick Patterns in your EAs:
This scanner has a fast and lightweight version (bridge) that you can use in the code of expert advisors and indicators for accessing the values of different candlestick patterns and S/R zones for all metatrader timeframes.
- If you want to trade based on candlestick patterns in your trading strategy you can use the bridge in your expert advisor code (with iCustom function).
- Bridge is included in the lifetime licenses of the scanner, contact me after buying the scanner and I'll send the bridge to you.
- Also you will receive a sample EA to see how to use the bridge in the expert advisor code.
Please check out scanner blog page for more info about the bridge.
Different Alert Types:
You can enable the following alerts at the same time in the scanner settings.
- Show Pop Up Alert: Show alert window when scanner alert triggers.
- Send Push Notification: Send push notification to mobile phone when scanner alert triggers. (You should set metatrader Notifications options)
- Send Email: Send email when scanner alert triggers. (You should set metatrader Email options)
- Dashboard works smoothly for 80 symbols and all 9 timeframes on an average PC, you can add more symbols when you reduce the number of timeframes.
- If there are many symbols in the market watch, in the first run of the scanner on the chart it may take some time to load the history data for all timeframes of all symbols.
- Dashboard updates every 1-minute candle open time, run it on more volatile symbols like EURUSD and BTCUSD to receive new price ticks faster.
If you have any questions, please ask in the comments section. I'll do my best to answer your questions.

all of the tools are thoughtfully crafted and collaborate well systematically if you think deeply the context the tools bring to your trading is amazing. the tools give u reversal trading styles as well as trend following styles. u truly have automation ability at your finger tips. i have to tinker and study them to get them set but once u do u will be happy u purchased the tools. cant wait to see the moving average filter added . its going to change the game lol