The 1 2 3 Pattern Scanner
- 指标
- Reza Aghajanpour
- 版本: 1.40
- 更新: 20 一月 2025
- 激活: 20
** All Symbols x All Timeframes scan just by pressing scanner button **
After 17 years of experience in the markets and programming, Winner indicator is ready. I would like to share with you!
Introduction
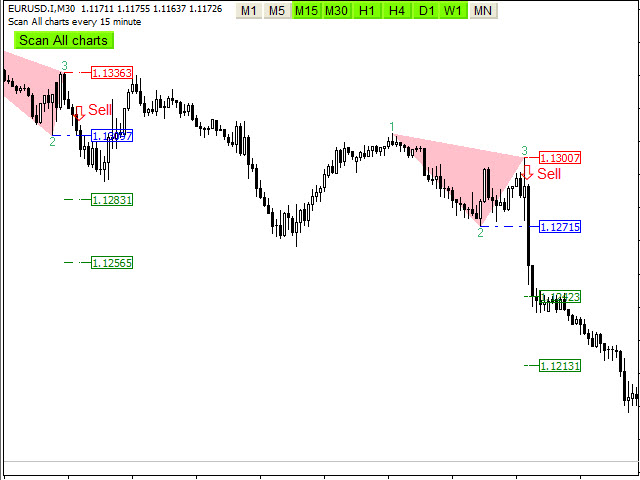
The 123 Pattern Scanner indicator with a special enhanced algorithm is a very repetitive common pattern finder with a high success rate. Interestingly, this Winner indicator indicates that the trend has changed its direction or the end of a trend retracement or even the 1 2 3 Pattern appears at the range market.
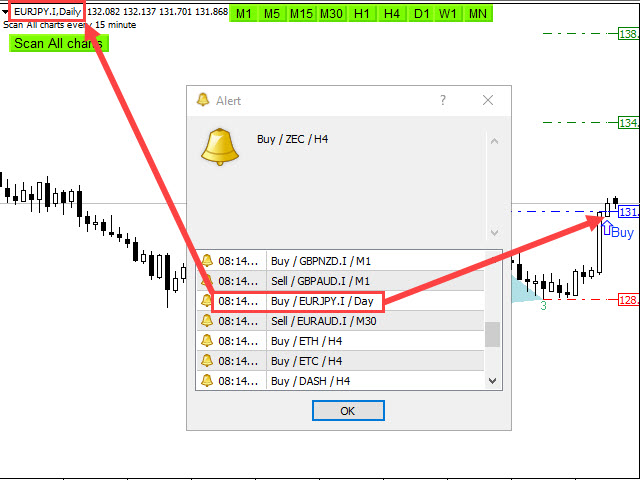
The 1,2,3 Pattern Scanner finds immediately with alarm and notification and also has stop loss, take profits and entry point with candlestick checking for easy trading.
Main Features
- Use special enhanced algorithm
- Detect the best and most successful pattern with very repetitive in trend, swing and breakout.
- Easy-to-use and user-friendly indicator
- NO repaint
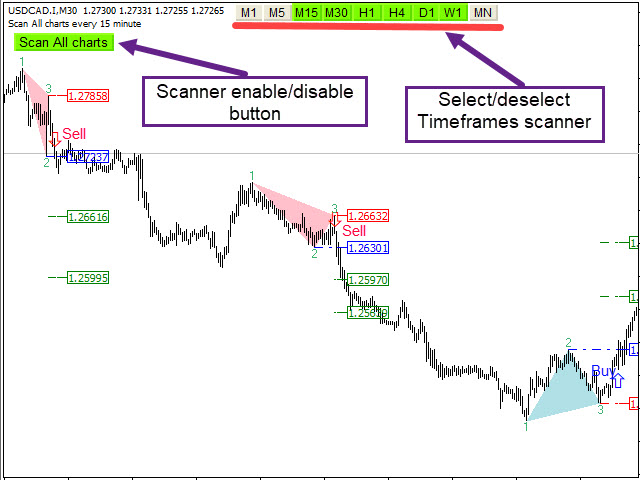
- Scan all charts button ( Forex, Crypto, Indices and commodities)
- Select and deselect time frames button for scan (M5,M15,M30,H1,H4,D1,W1,MN)
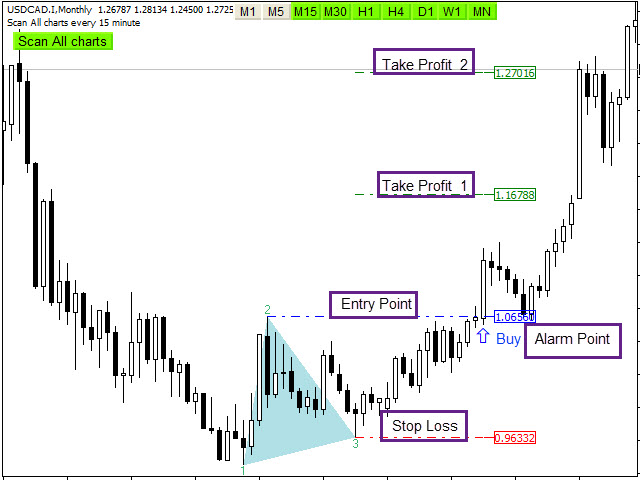
- It displays and pushes notification stop-loss, entry-point and take-profit levels
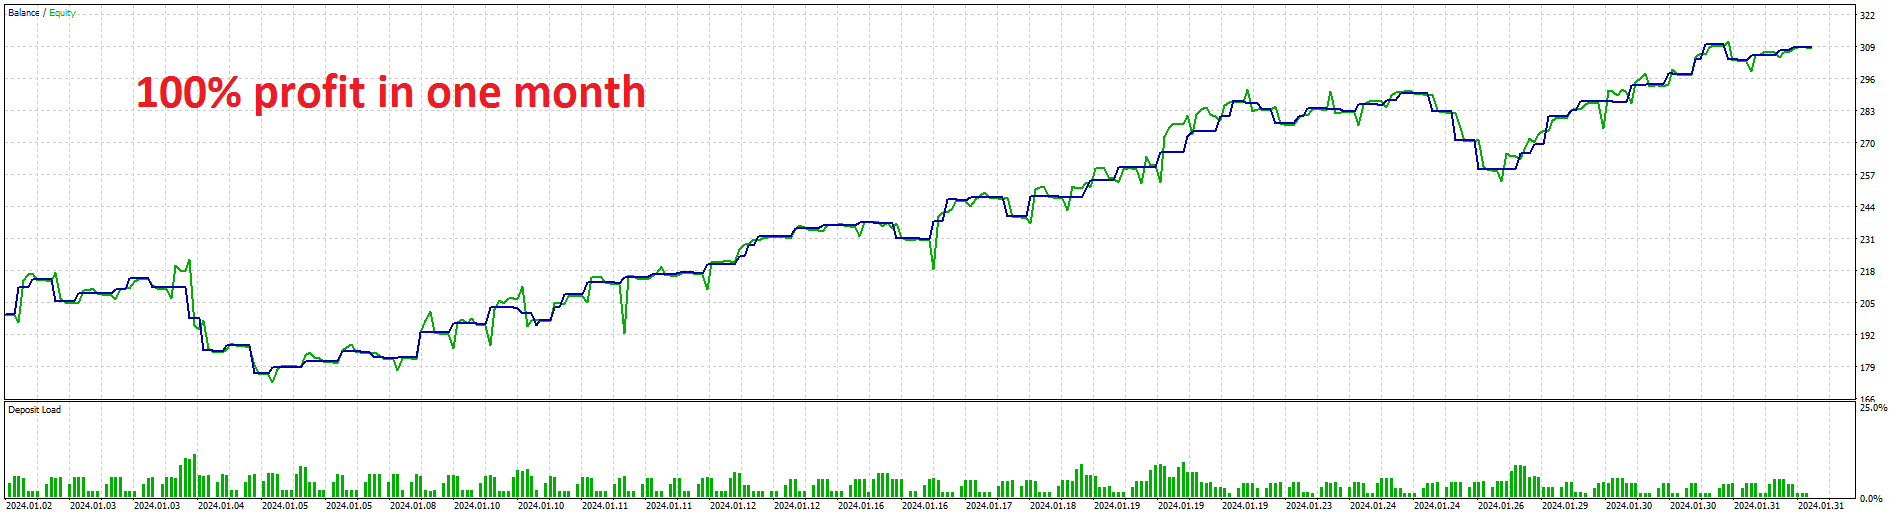
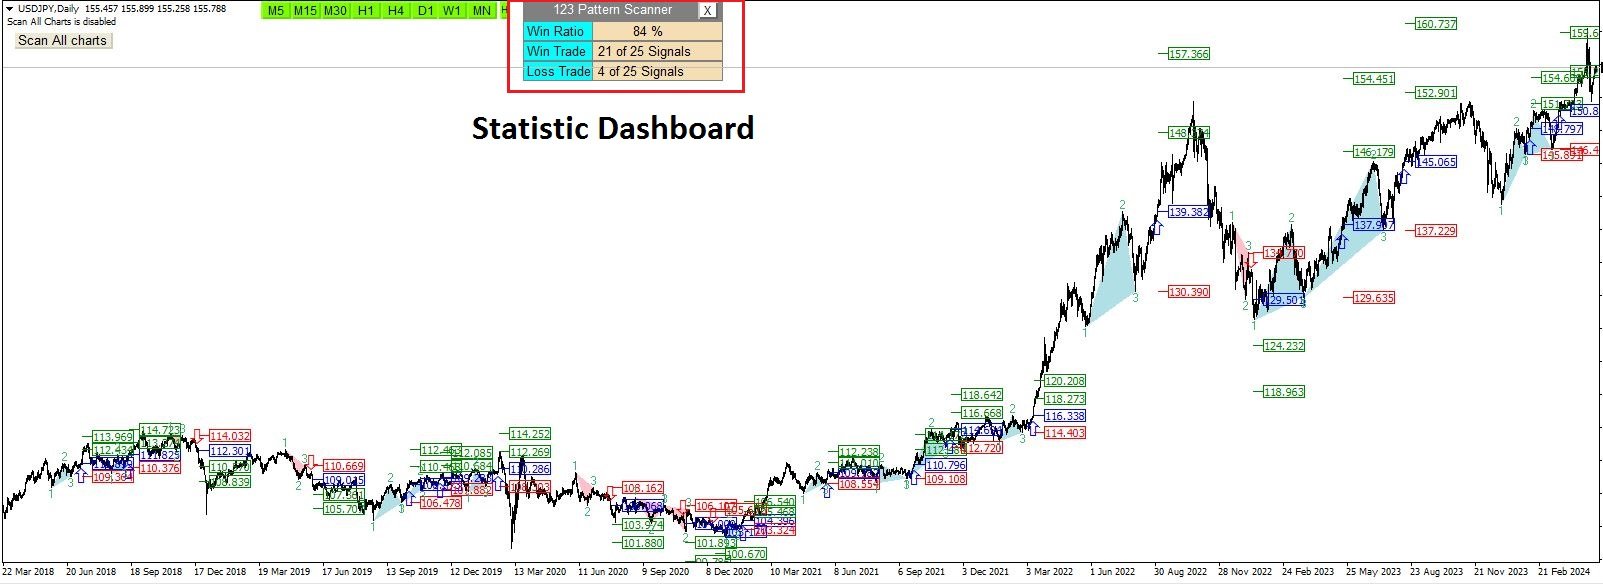
- Real Statistics Dashboard
- Candlestick check for the best entry point
- Method to choose how appearing pattern : breakout(after breakout the point 2) or pattern(in point 3)
- Sending the alert and push notification, email and files
- Alert enable/disable base on your setting time
- Adjust the pattern setting
- Risk to Reward : 1:2
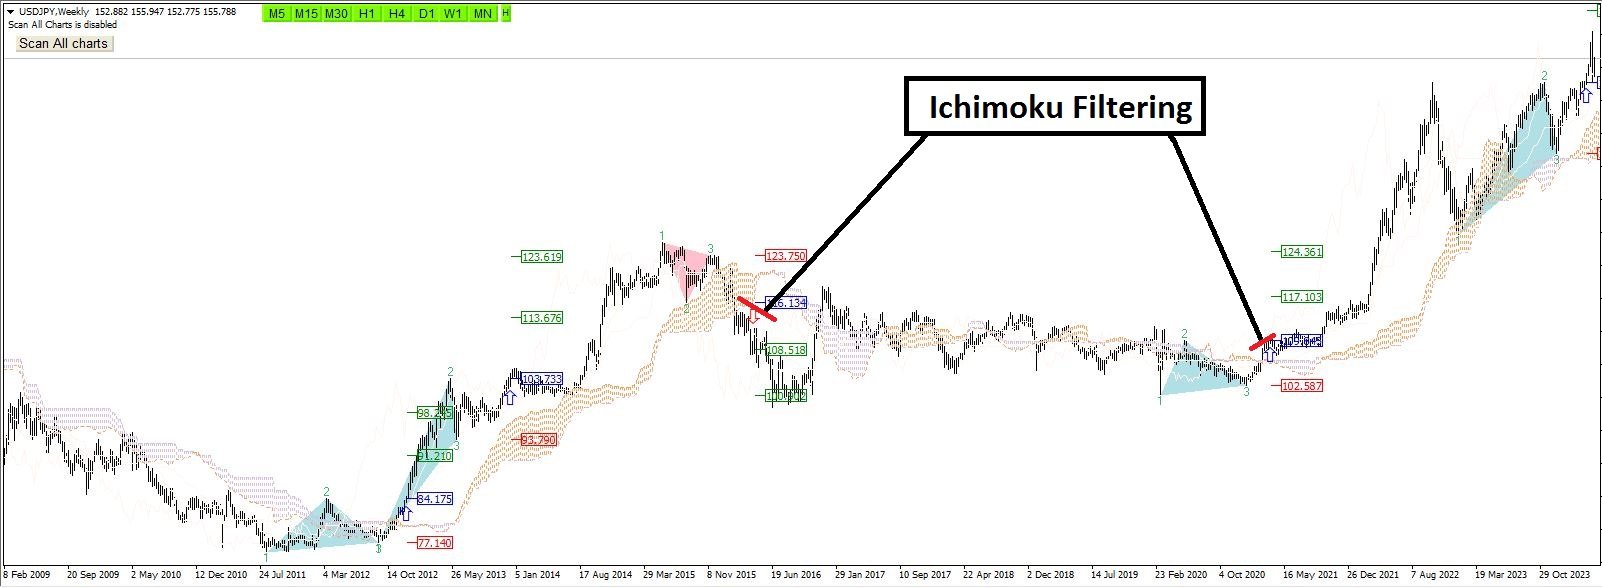
- Ichimuku filtering
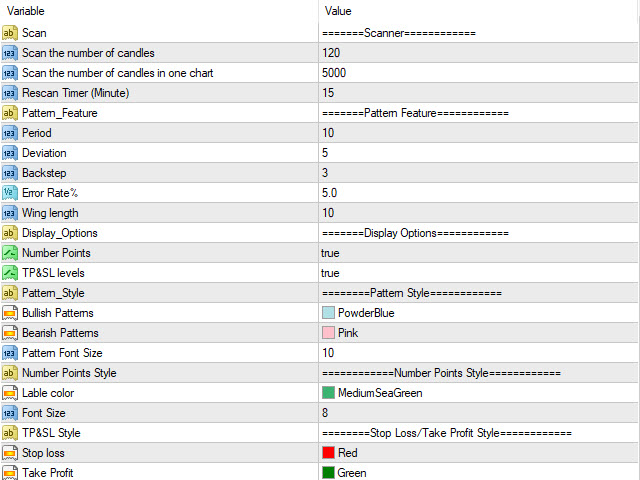
Input Parameters
=========Scanner============
- Scan all charts - Enabled
- Scan the number of candles – Amount of history bars to evaluate
- Re-scan Timer – Re-scan all charts and all time frames after passing time
- Method - choose how appearing a pattern : breakout(after breakout in point 2) or pattern(in point 3)
=======Pattern Feature============
- Pattern_Feature(Period, Deviation, Back step) - Algorithm Parameters for pattern recognition
- Error_Rate – Maximum allowable error relative to pattern percentage
- Wing length - Minimum distance between two legs in a pattern
=======Display/style Options============
- Display_Options – Display or do not display TP & SL levels
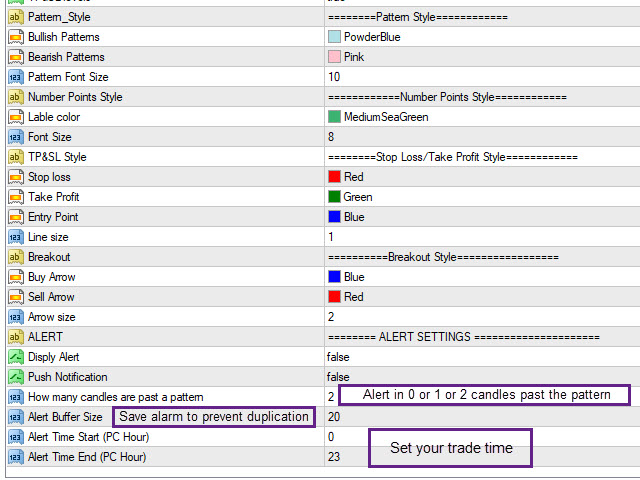
- Stop Loss/Take Profit levels and Breakout Style - Set the Fonts and colors of patterns
- Chart view - Color Scheme of chart (White / Black / Don't change)
- Statistics Dashboard - Display or do not display Dashboard
========ALERT SETTINGS ==========
- Display Alert or Push Notification – Enable or disable Alert or Push Notification
- How many candles are past a pattern – Maximum Number of candles Passed from a pattern to allow alert
- Alert Buffer Size – Maximum save alert to prevent duplicate alerts
- Alert start/end time – Determine trading hours based on the computer clock to activate and deactivate the alarm


Great indicator,very usefull and gives good opertunities,highly recommend !