Fibonacci Auto Levels
- 指标
- Mohamed yehia Osman
- 版本: 1.4
- 更新: 12 一月 2022
- 激活: 5
Auto levels drawn based on input index (Bars Count )
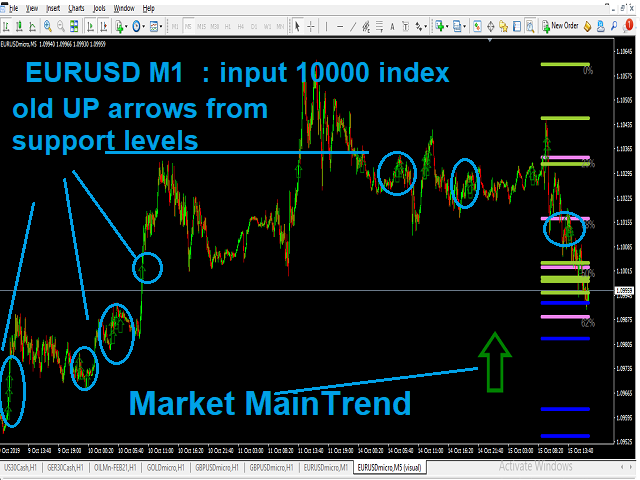
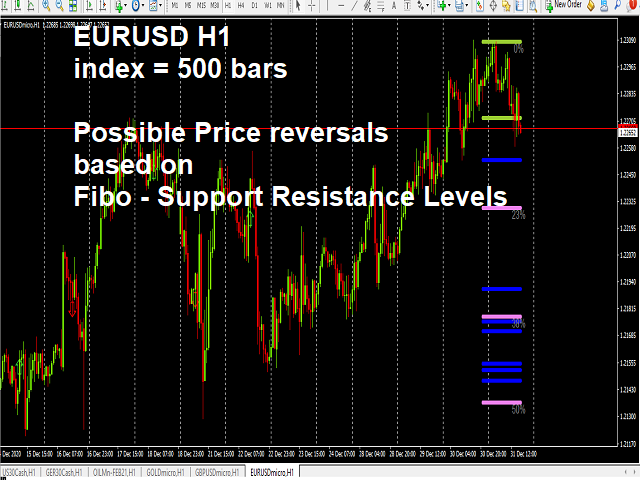
---->>> Price Over 50% Fibo line ---> UP TREND ---> BUY when price drop near Support Lines
---->>> Price Down 50% Fibo line ---> DOWN TREND ---> SELL when price goes up near Resistance Lines
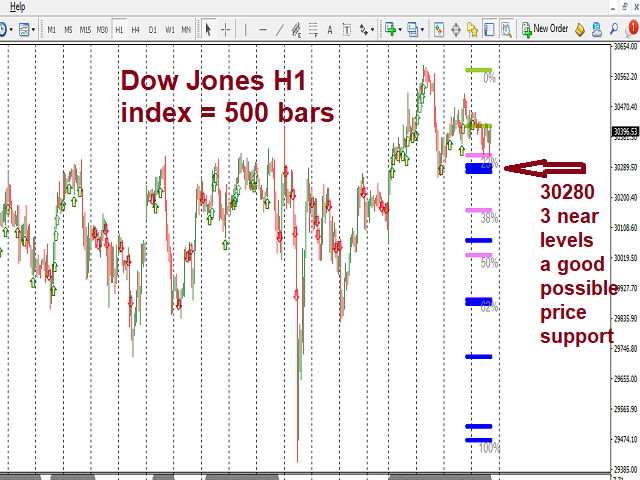
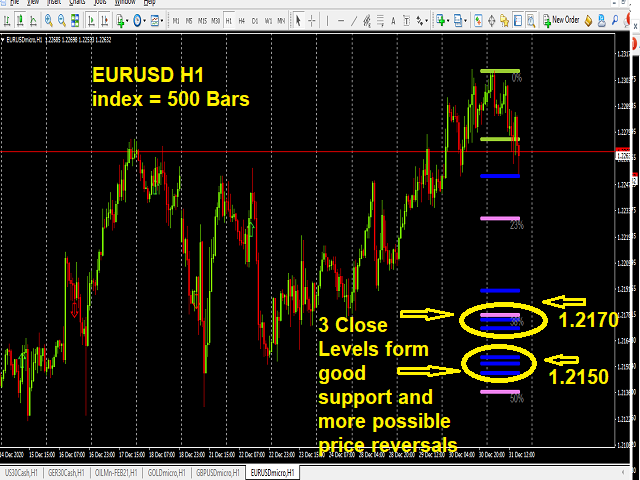
--->>> The more close price levels ----> the more possibility for price reversals
--->>> are you a scalper --> try it on M1 charts with big index like 5000 bars or more
one single input = index = numbers of bars for calculation of Fibonacci levels and support resistance levels during bars period
other inputs related to colors ,thickness and wideness of levels
can be used on any time frame / any symbol
Strategy 1:
---->>> Price Over 50% Fibo line ---> UP TREND ---> BUY when price drop near Support Lines
---->>> Price Down 50% Fibo line ---> DOWN TREND ---> SELL when price goes up near Resistance Lines
--->>> finding areas with many NEAR (close) levels as it has more possibility for price reversal
--->>> The more close price levels ----> the more possibility for price reversals







用户没有留下任何评级信息