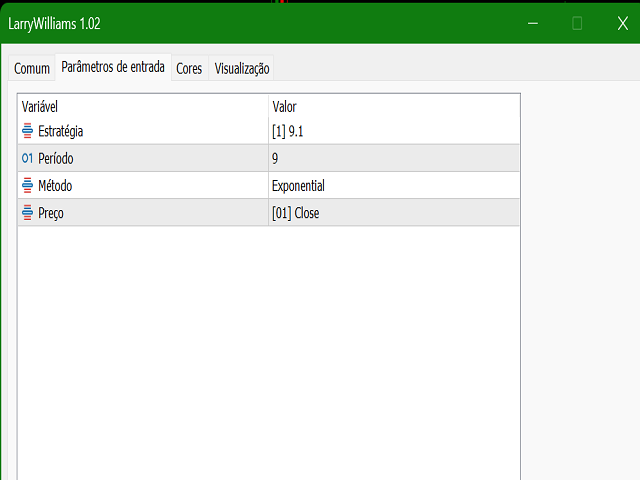
• 概述
  • 评论
  • 评论
  • 新特性

Larry Williams

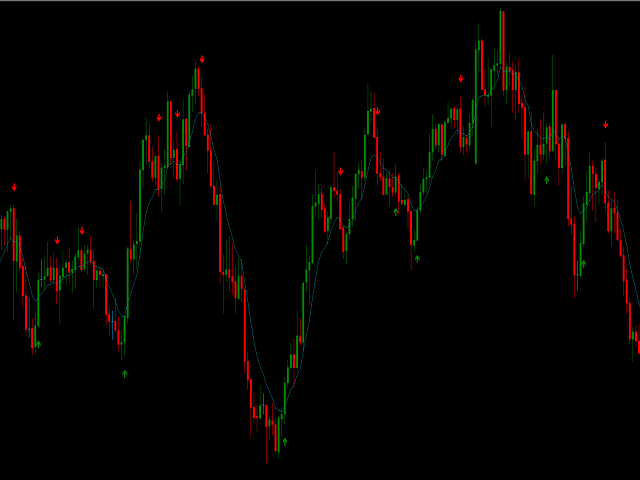
Created by trader and journalist Larry Williams, Setup 9.1 is a simple strategy that is easy to understand and execute, which is why it is so well known and popular in the world of traders and technical analysis. It is a REVERSION setup, where operations are sought when the moving average changes direction.


Setup Logic

With the open candlestick chart, at any time chart, it is only necessary to add the 9-period Exponential Moving Average (MME9). That done, we look for assets in which the MME9 is in a good trend, and we wait for it to change direction.


推荐产品
MP Impulse MACD for MT5
Pierre Ksachikian
5 (1)
MACD (short for Moving Average Convergence/Divergence) is one of the most famous and oldest indicators ever created and is widely used among   beginners . However, there is a newer version of the MACD that is named   Impulse MACD   which have less false signals than the standard MACD. Classic MACD helps us to identify potential   trends   by displaying   crossovers   between two lines. If MACD line crosses above the Signal line it shows us that the market is potentially   up   trending and that
MACD Divergence on MT5
KEENBASE SOFTWARE SOLUTIONS
KT MACD Divergence shows the regular and hidden divergences build between the price and oscillator. If your trading strategy anticipates the trend reversal, you can include the MACD regular divergence to speculate the potential turning points. And if your trading strategy based on the trend continuation, MACD hidden divergence would be a good fit. Limitations of KT MACD Divergence Using the macd divergence as a standalone entry signal can be a risky affair. Every divergence can't be interpr
This indicator combines double bottom and double top reversal chart patterns together with detection of divergences between the price chart and the Momentum oscillator. Features Easily detect strong reversal signals Allows to use double top/bottom and Momentum divergence signals combined or independently Get email and/or push notification alerts when a signal is detected Custom colors can be used The indicator is not repainting Can easily be used in an EA (see below) Inputs ENABLE Double Top
Paula Bollinger Bands Strategy
Francisco Gomes Da Silva
4 (2)
Bollinger bands out/in strategy A strategy created by Joe Ross, and very useful for finding trades when the market is overloaded. Indicator You don't need to find where there are entries on the chart, this indicator shows them for you. The entrance The trade is confirmed when the price closes outside the bollinger bands on a candle and the candle after the price closes inside the bands. comment I want to improve this indicator, so you can help me sending me your reviews and comments, thanks :).
FREE
这个指标采用经典的MACD和Zigzag结合用于检测价格和指标的背离,并采用先进的人工智能技术检测背离的有效性。MACD是指标之王,Zigzag也是非常有用的指标,这个指标把两个指标结合起来,发挥两个指标的优势。检测背离存在概率的问题,通常背离了又背离,所有我们试图通过先进的人工智能技术判断背离的有效性,过滤掉无效的背离,然后通过多种方式提醒用户。 促销价:59$ 功能 1.MACD形式的Zigzag指标 2.检测价格和MACD指标背离 3.通过AI技术检测背离的有效性 4.背离信号预警提醒 5.背离信号手机提醒 6.背离信号邮件提醒 7.使用于多个周期 8.使用 强大的ONNX( Open Neural Network Exchange )模型格式 使用 底背离: 单MACD在下面交叉时,指标会检测出是否底背离,画出向上的箭头,并提醒 顶背离: 单MACD在上面交叉时,指标会检测出是否顶背离,画出向下的箭头,并提醒 输入参数 Fast EMA period               =  12;  Slow EMA period              =  2
The indicator monitors the Dinapoli MACD trend in multiple timeframes for the all markets filtered and shows the results on Dashboard. Key Features Indicator can be used for all markets Monitors every timeframe, from 1 Min to Monthly Parameters UseMarketWatch: Set true to copy all symbols available in market watch MarketWatchCount : Set the number of symbols that you want to copy from the market watch list. CustomSymbols: Enter the custom symbols that you want to be available in dashboard.
This indicator combines double bottom and double top reversal chart patterns together with detection of divergences between the price chart and the MACD oscillator. Features Easily detect strong reversal signals Allows to use double top/bottom and MACD divergence signals combined or independently Get email and/or push notification alerts when a signal is detected Custom colors can be used The indicator is not repainting Can easily be used in an EA (see below) Inputs ENABLE Double Top - Botto
MACD 日內趨勢 PRO 是通過改編自 Gerald Appel 在 1960 年代創建的原始 MACD 而開發的指標。 通過多年的交易,觀察到通過使用斐波那契比例更改 MACD 的參數,我們可以更好地呈現趨勢運動的連續性,從而可以更有效地檢測價格趨勢的開始和結束。 由於其檢測價格趨勢的效率,還可以非常清楚地識別頂部和底部的背離,從而更好地利用交易機會。 特徵 MACD 日內趨勢 PRO 指標適用於任何貨幣對、任何時間範圍以及 Renko 圖表。 可以通過選擇 6 種模式來設置趨勢檢測速度: 最快的 快速地 普通的 減緩 最慢 資源 它有 6 個可配置的警報: MACD回調信號線 MACD穿越信號線 MACD穿過零水平 信號線過零電平 MACD 變化趨勢顏色 信號線變化趨勢顏色 對於每個警報,可以配置: 彈出 聲音(有 13 種聲音可用。) 智能手機通知 彈出窗口和聲音 彈出窗口和智能手機通知 聲音和智能手機通知 彈出窗口、聲音和智能手機通知 與智能交易系統或其他指標集成 有 8 個緩衝區可用於訪問和與專家顧問或其他指標集成,即使關閉警報,它們也會被填滿,它
Introducing the Consecutive Green/Red Candle Alert Indicator for MT5 - Your Trend Spotting Companion! Are you ready to take your trading to the next level? We present the Consecutive Green/Red Candle Alert Indicator, a powerful tool designed to help you spot trends and potential reversals with ease. Whether you're a new trader looking for clarity in the market or an experienced pro seeking additional confirmation, this indicator is your trusted companion. Key Features of the Consecutive Gre
Divergence ONE
Enrico Schmidke
The indicator identifies divergences between chart and RSI, with the possibility of confirmation by stochastics or MACD. A divergence line with an arrow appears on the chart when divergence is detected after the current candle has expired. There are various filter parameters that increase the accuracy of the signals. To identify a divergence, point A must be set in the RSI, then point B Value must be edited, which sets the difference between point A and point B. The indicator can be used for tim
Walking on the clouds
LEONARDO NOCERA
5 (1)
WALKING ON THE CLOUD TREND INDICATOR  GREEN ARROW :  UPTREND BLU ARROW     :  DOWNTREND BASED ON SEVERAL TREND INDICATORS : MOVING AVERAGE / ICHIMOKU KYNKO HYO / SUPERTREND / PARABOLIC SAR HELP YOUR TRADING WITH THIS POWERFULL INDICATOR ! PROFITABLE IN EVERY TIMEFRAME AND IN EVERY CHART BUT THE SIGNALS ARE MORE ACCURATE IN H1 TIMEFRAME,SO I SUGGEST THIS TF RECEIVE DIRECTLY TO YOUR PHONE THE SIGNAL WHEN A NEW ARROW APPEARS  PLEASE CONTACT ME FOR EVERYTHING
TPM cross indicator
Ekaterina Saltykova
TPM Cross (trend power moving cross) - is a trend following strategy based on custom signal points. Indicator consists from main custom moving chart line and trend power line. Indicator defines up and down movements by it's trend power and custom moving direction. When current market's trend looses it's power and opposite trend starts - power trend line  crosses moving and indicator plots an arrow.  Main indicator's adjustable inputs : movingPeriod - period of moving line  trendPeriod  - period
MACDivergence MTF MT5
Pavel Zamoshnikov
4.17 (6)
Advanced ideas of the popular MACD indicator: It detects and displays classic and reverse divergences (two methods of detecting divergences). It uses different color to highlight an uptrend and a downtrend. Two methods of determining a trend: а) MACD crosses the 0 level (classic signal); б) MACD crosses its own average (early signal). This is a multi-timeframe indicator: it can display MACD data from other timeframes. Two methods of drawing: classic histogram and line. It generates sound and vis
Multiple TimeFrame MACD Confluency Tool
Kelvin Souza Da Costa Oliveira
Multiple Timeframe MACD indicator. This indicator was built for making multiple timeframe analysis possible in MT5 using MACD Indicator. MACD Indicator traditionally shows two lines and one histogram. MACD Line(Yellow) is calculated by subtracting 12period EMA(fast) from 26period EMA (slow). Signal Line(Blue) is created by a 9period EMA from MACD Line. Histogram is just the difference between MACD and Signal lines. Histogram is colored based on the difference between its value and the previous h
HLC bar MT5 Wyckoff
Eduardo Da Costa Custodio Santos
創建 MT5 的指標“HLC_bar_MT5 Wyckoff”是為了方便交易時的分析。 HLC Bar 由 Richard Wyckoff 使用,目前廣泛用於“VSA”操作。 Wyckoff 發現使用 High、Low 和 Close 使圖表更清晰、更易於分析。 指標“HLC_bar_MT5 Wyckoff”允許: # 改變條寬; # 保持條形相同的顏色; # 並突出顯示以相同價格開盤和收盤的柱。 顏色和寬度很容易在設置中修改 要使用該指標,只需將其拖到圖表上即可。 當與成交量一起使用時,威科夫將 HLC 圖表稱為條形圖。 他們試圖隱藏這些信息多年,但現在每個人都可以訪問這些信息,並可以使用此類圖表改進他們的操作。 HLC bar MT5 Wyckoff Chart 可用於任何市場和任何圖表時間,使操作員更加舒適。
如果您来到这里,那是因为您已经了解了 策略扫描仪 的免费版本。 此外,您可能需要一个带有警报功能的工具,因为这对您很重要: MetaTrader上的警报 手机上的警报 电子邮件中的警报 声音警报 这些警报将在您的Rule Plotter Scanner线上出现不同箭头时通知您。 您可以选择声音警报、MetaTrader上的警报、手机上的警报以及电子邮件中的警报。 充分利用Rule Plotter线的功能,使用此工具接收Rule Plotter Scanner的警报。 非常感谢您的关注和购买。请在这里添加我为好友,以了解我何时发送更多免费和付费产品到MetaTrader: Rule Plotter的开发者 。 MetaTrader上的警报 手机上的警报 电子邮件中的警报 声音警报
KT Pin Bar MT5
KEENBASE SOFTWARE SOLUTIONS
KT Pin Bar identifies the pin bar formation which is a type of price action pattern which depicts a sign of reversal or rejection of the trend. When combined with support and resistance, BRN and other significant levels, Pin Bar pattern proved to be a very strong sign of reversal. Basically, a pin bar is characterized by a small body relative to the bar length which is closed either in upper or lower 50% part of its length. They have very large wicks and small candle body. A pin bar candlest
This scanner shows the trend values of the well known indicator SuperTrend for up to 15 instruments and 21 time frames. You can get alerts via MT5, Email and Push-Notification as soon as the direction of the trend changes. Important Information You have many possibilities to use the scanner. Here are two examples: With this scanner you can trade a top-down approach easily. If two higher time frames e.g. W1 and D1 are already showing green values (upward trend) but the H12 time frame shows a re
Crash Crush Hunter
Muhammad Tanveer
Hello Traders I have created this indicator to Catch SPIKES on Crash1000, Crash500 and Crash300. Follow the below mention instruction for better Result 1. When Red arrow pop up on the Chart, Take a Sell entry 2. Stay in trade until price break below from entry 3. Do not hold trades after all trades went in Blue 4. Keep adding position until spike cross below from intial entry See Example for more assistance
Binary MACD
Bogdan Kupinsky
Индикатор, показывающий момент преодоления нулевой отметки индикатора MACD.  Подходит для бинарной торговли, т.к. имеется возможность посчитать точность сигналов, в зависимости от времени экспирации. Входные параметры Period of SMA1  - Период 1 скользящей средней Period of SMA2 -  Период 2 скользящей средней Period of SMA3 -  Период 3 скользящей средней Price Type - Тип цены, используемый индикатором MACD Invert signals  - Возможность давать инвертированные сигналы (для работы по тренду) Infor
This indicator combines double bottom and double top reversal chart patterns together with RSI divergence detection. Features Easily detect strong reversal signals. Allows to use double top/bottom and RSI divergence signals combined or independently. Get email and/or push notification alerts when a signal is detected. Custom colors can be used. The indicator is not repainting. Can easily be used in an EA. (see below) Inputs ENABLE Double Top - Bottom: Enable the double top - bottom indicator
SuperTrend MT5
KEENBASE SOFTWARE SOLUTIONS
KT SuperTrend is a modified version of the classic SuperTrend indicator with new useful features. Whether its Equities, Futures, and Forex, the beginners' traders widely use the Supertrend indicator.  Buy Signal: When price close above the supertrend line. Sell Signal: When price close below the supertrend line. Features A multi-featured SuperTrend coded from scratch. Equipped with a multi-timeframe scanner. The last signal direction and entry price showed on the chart. All kinds of MetaTra
Wolfe Wave Scanner MT5
Reza Aghajanpour
5 (4)
**  All Symbols  x  All Timeframes  scan just by pressing scanner button ** *** Contact me after the purchase to send you instructions and add you in "Wolfe Wave Scanner group" for sharing or seeing experiences with other users. Introduction: A Wolfe Wave is created with five-wave patterns in price. It shows supply and demand and a fight towards a balance price. T hese waves of price actions can help traders identify the boundaries of   the trend . Also  It helps forecast how the price will mo
MACD Intraday Trend
JETINVEST
4.77 (47)
MACD 日内趋势是通过改编自 Gerald Appel 在 1960 年代创建的原始 MACD 而开发的指标。 通过多年的交易,观察到通过使用斐波那契比例更改 MACD 的参数,我们可以更好地呈现趋势运动的连续性,从而可以更有效地检测价格趋势的开始和结束。 由于其检测价格趋势的效率,还可以非常清楚地识别顶部和底部的背离,从而更好地利用交易机会。 请务必尝试我们具有可配置功能和警报的专业版本: MACD Intraday Trend PRO 特征 适用于任何货币对 在任何时间范围内工作 适用于 Renko 图表 如果您仍有疑问,请通过直接消息与我联系: https://www.mql5.com/zh/users/robsjunqueira/ ----------------------------------------- 如果可能,请留下您的评论和评论,以帮助向社区传播信息。 还可以了解我们的其他指标和专家顾问。 我有几种有用的指标和专家顾问。 如果您有任何建议,请随时提出建议,这样我才能改进产品,使持续改进永无止境。
FREE
RDG Brooks Bar Counting
Sergio Ritter Rodrigues
This indicator can be used to help learn the Al Brooks 'bar counting system'. It finds and labels 'H', 'L', Micro Gap '=', Outside 'E' and Inside bars '+'. You can choose label "H" and "L" at signal bar ou at entry bar. (does not count bars/legs...you'll have to do your own counting for L1 L2...H1 H2 etc.) The inside bar is only found when label at entry bar is selected.
FREE
Qv2 Trend MT5
Joao Marcilio
The Qv² Trend is an indicator that aims to identify trends. Buying trend signals are indicated by arrows pointing up. Selling trend signals are indicated by arrows pointing down. It can be used in all deadlines. It can be used in all pairs. I use it on the H1 with a period of 24. Important Recommendation: Make sure you trade in trend market. Good Trades, in trend market
Stochastic R
Antony Augustine
Stochastic  Reversal  allows you to recognize reversals professionally. Stochastic Indicator: This technical indicator was developed by George Lane more than 50 years ago. The reason why this indicator survived for so many years is because it continues to show consistent signals even in these current times. The Stochastic indicator is a momentum indicator that shows you how strong or weak the current trend is. It helps you identify overbought and oversold market conditions within a trend.  Rules
Setup Double 7s
Luigi Nunes Labigalini
Entry and exit signals from the Double 7's Strategy by Larry Connors in his book "Short Term Trading Strategies That Work". Larry claims this strategy predicted the market's direction over 80% of the time since 1995. Picking up the gains and being exposed in the market less than 25% of the time. Good for swing trading on Daily charts of SPY, Nasdaq, China's FXI, Brazil's EWZ and the majority of the equity ETFs and World Indices. How does it work? The indicator activates the buy signal when
To get access to MT4 version click   here . This is the exact conversion from TradingView: "Trendlines with Breaks" by LuxAlgo This is a REPAINT indicator. Buffers are available for processing.  However there are objects on chart to process also. All input fields are available.  Alerts are generated based on bars closure. You can message in private chat for further changes you need. Thanks for downloading
Use of support and resistance in systematic trading is very subjective. Every trader has their own idea and way to plotting the support and resistance levels on the chart. KT Support and Resistance indicator take out this ambiguity out of the situation and automatically draws support and resistance levels following an algorithmic approach using a unique multi-timeframe analysis. When launched on the chart, It immediately scan the most significant extreme points across all the available timefr
该产品的买家也购买
Atomic Analyst MT5
Issam Kassas
5 (14)
首先值得强调的是,该交易指标是非重绘、非延迟的指标,这使其成为手动和机器人交易的理想选择。 用户手册:设置、输入和策略。 Atomic Analyst是一种PA价格行动指标,利用价格的力量和动量来寻找市场上更好的机会。配备了高级过滤器,可帮助去除噪音和假信号,并提高交易潜力。使用多层复杂的指标,Atomic Analyst扫描图表,并将复杂的数学计算转化为任何初学者都能理解并用来做出一致交易决策的简单信号和颜色。 “Atomic Analyst”是专为新手和经验丰富的交易者量身定制的综合交易解决方案。它将高级指标和一流功能融合为一体的交易策略,使其成为所有类型交易者的多功能选择。 日内交易和剥头皮策略:专为快速准确的日内交易和短期交易而设计。 日内和摆动交易策略:可用作追求价格大幅波动的日内和摆动交易者的可靠工具。 多货币和市场:凭借其可靠的精度,在不同的工具和市场上运作。 多个时间框架:可在多个时间框架上使用,性能良好。 稳定性:所有指标均不重绘、不重绘和不滞后,确保可靠的信号。 信号清晰度:提供箭头信号,用于清晰的入场和出场点。 实时警报:通过交易入场、SL和TP警报通知交
首先,值得强调的是,这个交易系统是一个非重绘、非重画和非滞后的指标,这使得它非常适合手动和机器人交易。 在线课程,手册和下载预设。 “智能趋势交易系统 MT5”是专为新手和经验丰富的交易者量身定制的综合交易解决方案。它结合了超过 10 个优质指标,具有 7 多个强大的交易策略,使其成为适用于各种市场条件的多功能选择。 趋势跟随策略:提供精确的入场和止损管理,以有效地跟随趋势。 反转策略:识别潜在的趋势反转,使交易者能够利用区域市场的机会。 剃头策略:专为快速准确的日内交易和短期交易而设计。 稳定性:所有指标都不会重绘、不会重画和不会滞后,确保可靠的信号。 定制:支持自定义策略,以满足个人交易偏好。超过 7 种策略和组合可帮助您找到最佳策略。 信号清晰度:提供箭头信号,以指示清晰的入场和退出点。 实时警报:通过交易进出警报使交易者保持了解。 深入分析:提供更高时间框架的趋势分析和实时交易监控。 自适应颜色编码:利用蜡烛颜色编码来显示成交量、趋势和反转蜡烛信号。通过蜡烛颜色分析市场方向。 “智能趋势交易系统 MT5”赋予交易者必要的工具,以便在各种市场条件下做出明智和战略性的交易决策。无论
Quantum Trend Sniper
Bogdan Ion Puscasu
5 (43)
介绍   量子趋势狙击指标 ,突破性的 MQL5 指标,正在改变您识别和交易趋势反转的方式!由拥有超过13年交易经验的资深交易员团队开发,     量子趋势狙击指标   旨在通过其创新的方式以极高的准确度识别趋势反转,将您的交易之旅推向新的高度。 ***购买量子趋势狙击指标,即可免费获得量子突破指标!*** 当量子突破指标识别出趋势反转时,它会向您发出警报和信号箭头,并建议您三个止盈水平。 它既适合新手交易者,也适合专业交易者。 量子 EA 通道:       点击这里 MT4版本:       点击这里 建议: 时间范围: 所有时间范围。为了获得最佳结果,我们建议在 M15、M30 和 H1 时间范围内使用它。 货币对:欧元兑美元、英镑兑美元、澳元兑美元、欧元兑英镑、, EURAUD,  XAUUSD 账户类型:ECN、Raw 或 Razor,点差极低 经纪时间:任意 经纪商:IC Markets、Pepperstone with Raw 和 Razor 的点差最低 建议止损:50 点 建议止盈水平:20 点、50 点和
TPSpro RFI Levels MT5
Roman Podpora
5 (8)
Reversal First Impulse levels (RFI)      INSTRUCTIONS        RUS       -       ENG              R ecommended to use with an indicator   -   TREND PRO -  Version MT4                 A key element in trading is zones or levels from which decisions to buy or sell a trading instrument are made. Despite attempts by major players to conceal their presence in the market, they inevitably leave traces. Our task was to learn how to identify these traces and interpret them correctly. Main functions:: Di
首先,值得强调的是,这个交易工具是非重绘、非重画和非滞后的指标,非常适合专业交易。 在线课程,用户手册和演示。 智能价格行动概念指标是一个非常强大的工具,既适用于新手,也适用于经验丰富的交易者。它将超过20个有用的指标合并到一个指标中,结合了高级交易思想,如内圈交易员分析和智能资金概念交易策略。该指标侧重于智能资金概念,提供有关大型机构交易方式的见解,帮助预测它们的动向。 它在流动性分析方面尤其擅长,有助于理解机构的交易方式。它擅长预测市场趋势,并仔细分析价格波动。通过将您的交易与机构策略对齐,您可以更准确地预测市场走向。该指标多才多艺,擅长分析市场结构,识别重要的订单区块,并识别各种模式。 它擅长识别BOS和CHoCH等模式,理解动量的转变,并突出显示供需强劲的关键区域。它还擅长发现强大的不平衡,并分析价格创造更高高点或更低低点的模式。如果您使用斐波那契回撤工具,该指标可以满足您的需求。它还可以识别相等的高点和低点,分析不同的时间框架,并通过仪表板显示数据。 对于使用更高级策略的交易者,该指标提供了工具,如公平价值差指标和优惠和折扣区域的识别。它特别关注高时间框架订单
Trend Screener Pro MT5
STE S.S.COMPANY
4.88 (64)
使用趋势筛选指标释放趋势交易的力量:由模糊逻辑和多货币系统提供支持的终极趋势交易解决方案! 使用趋势筛选器(由模糊逻辑提供支持的革命性趋势指标)提升您的趋势交易。 它是一个强大的趋势跟踪指标,结合了超过 13 种高级工具和功能以及 3 种交易策略,使其成为使您的 Metatrader 成为趋势分析器的多功能选择。 限时优惠:趋势筛选指标终身仅需 50 美元。 ( 原价 125$ ) (优惠延长) 体验趋势筛选器 100% 无需重新绘制的准确性,确保您的交易决策不受过去价格变化的影响。 释放多时间框架和多货币功能的多功能性,使您能够以无与伦比的信心在外汇、商品、加密货币和指数领域进行交易。 利用 Trend Screener 的综合策略套件增强您的交易: - 趋势跟踪策略和趋势延续策略 :趋势筛选器的趋势跟踪策略提供清晰的趋势延续信号,让您有效捕捉趋势走势并管理风险。 - 反转策略和早期入场点策略 :趋势筛选器的反转策略可检测市场方向的潜在变化,使您能够预测趋势反转并利用疲弱的市场趋势。通过早期入场点,您可以在潜在的趋势变化之前定位自己 获取可观的利润。 - 倒卖策略: 趋势筛选器的倒卖
FX Volume MT5
Daniel Stein
4.94 (17)
通过 mql5 和 Telegram 上 的 " 晨间简报 "获取每日市场更新,包括详细信息和屏幕截图 ! 外汇交易量(FX Volume)是第一个也是唯一一个从经纪商角度真正洞察市场情绪的交易量指标。 直接在您的图表上看到这些信息是真正改变游戏规则和突破性的交易解决方案。 受益于独特的市场数据洞察,如 比率(Ratios )显示货币多头和空头头寸的比率(百分比 比率变化 显示所选时间段内的多头比率及其百分比变化 总交易量 显示货币的总交易量(多头和空头),以手为单位 多头 交易量显示货币所有多头头寸的交易量 空头 交易量显示所有货币空头头寸的交易量 净多头 显示净多头交易量,即所有多头头寸减去所有空头头寸(以手为单位)。 净多头百分比 显示货币净多头交易量的变化 请阅读我们的基本教程 -> "如何使用外汇交易量进行交易 " 获取更多信息,如常见问题、交易技巧和教程视频,请访问我们的 外汇交易量公共信息频道 请 安装并运行 SI Connect 以建立与我们数据中心的持续连接 背景信息 我们都知道,外汇是一个分散的市场。这就是为什么我们必须打破常规思维,开发一个独
Gold Stuff mt5
Vasiliy Strukov
4.89 (179)
Gold Stuff mt5 是专为黄金设计的趋势指标,也可用于任何金融工具。 该指标不会重绘,也不会滞后。 推荐时间框架 H1。 购买后立即联系我以获得设置和个人奖励!   你可以在我的个人资料中找到它。   重要! 购买后立即与我联系,以获得说明和奖金!   您可以免费收到我们的强力支持和趋势扫描指标的副本,请私信。大部头书!   设置 绘制箭头 - 打开关闭。 在图表上绘制箭头。 警报 - 打开关闭声音警报。 电子邮件通知 - 打开关闭。 电子邮件通知。 Puch-notification - 打开关闭。 推送通知。 接下来,调整色域。 Gold Stuff mt5 是专为黄金设计的趋势指标,也可用于任何金融工具。 该指标不会重绘,也不会滞后。 推荐时间框架 H1。 购买后立即联系我以获得设置和个人奖励!   设置 绘制箭头 - 打开关闭。 在图表上绘制箭头。 警报 - 打开关闭声音警报。 电子邮件通知 - 打开关闭。 电子邮件通知。 Puch-notification - 打开关闭。 推送通知。 接下来,调整色域。
FX Power MT5 NG
Daniel Stein
5 (5)
通过 mql5 和 Telegram 上 的晨间简报获取每日市场更新,包括详细信息和屏幕截图 ! FX Power MT5 NG 是我们长期以来非常受欢迎的货币强度计算器 FX Power 的下一代产品。 这款下一代强度计算器能提供什么?您所喜爱的原版 FX Power 的所有功能 附加功能 黄金/XAU 强度分析 更精确的计算结果 可单独配置的分析周期 可自定义计算限制,以获得更好的性能 为希望查看更多信息的用户提供特殊的多实例设置 无尽的图形设置,可在每个图表中设置您最喜欢的颜色 无数的通知选项,让您再也不会错过任何重要信息 采用 Windows 11 和 macOS 风格的全新圆角设计 神奇的移动指标面板 FX Power 主要功能 所有主要货币的完整强势历史 所有时间框架内的货币强弱历史 所有经纪商和图表的计算结果完全相同 100% 可靠的实时计算 -> 无重绘 可通过下拉列表选择分析时段 通过自定义模式单独配置分析时段 可在一个图表中使用多个实例 可移动 FX Power 显示屏(通过拖放) 适用于高分辨率 QHD、UHD 和 4K 显示器 自动终端配置 针对平板电脑
XQ Indicator MetaTrader 5
Marzena Maria Szmit
5 (1)
Step into the realm of Forex trading with confidence and precision using XQ, a cutting-edge Forex indicator designed to elevate your trading game to unprecedented heights. Whether you're a seasoned trader or just stepping into the world of currency exchange, XQ Forex Indicator empowers you with the insights and signals needed to make informed trading decisions. The signal conditions are a combination of three indicators, and XQ Forex Indicator only display  medium and long-term trends . The ind
Entry Points Pro for MT5
Yury Orlov
4.55 (160)
这款指标用于 MT5,可提供准确的入场交易信号,且无重绘。 它可应用在任何金融资产:外汇、加密货币、贵金属、股票、指数。 它将提供极其精准的评估,并告诉您何时开仓和平仓的最佳时机。 观看 视频 (6:22),其中包含一个仅处理单一信号的示例,该信号即可值回指标购价! 大多数交易者在 Entry Points Pro 指标的帮助下,在第一个交易周内即改善了他们的交易结果。 订阅我们的 Telegram 群 ! Entry Points Pro 指标的益处。 入场信号无重绘 如果信号出现,并得到确认,则它不会再消失;不像是重绘指标,它会导致重大的财产损失,因为它们可以在显示信号后再将其删除。 无差错开仓 指标算法可令您找到入场交易(买入或卖出资产)的理想时机,从而提高每位交易者的成功率。 Entry Points Pro 可操作任何资产 它允许您在 MT5 平台上交易任何经纪商的加密货币、股票、贵金属、指数、大宗商品和货币。 提供任何方向的信号 Entry Points Pro 指标提供针对任意价格走势的入场交易信号 - 上涨、下跌或横盘(横向)。
ICT, SMC, SMART MONEY CONCEPTS, SMART MONEY, Smart Money Concept, Support and Resistance, Trend Analysis, Price Action, Market Structure, Order Blocks, BOS/CHoCH,   Breaker Blocks ,  Momentum Shift,   Supply&Demand Zone/Order Blocks , Strong Imbalance,   HH/LL/HL/LH,    Fair Value Gap, FVG,  Premium  &   Discount   Zones, Fibonacci Retracement, OTE, Buy Side Liquidity, Sell Side Liquidity, BSL/SSL Taken, Equal Highs & Lows, MTF Dashboard, Multiple Time Frame, BigBar, HTF OB, HTF Market Structure
成為突破者,隨著價格反轉,市場結構會改變利潤。 訂單突破者指示器可以識別趨勢或價格走勢何時接近枯竭並準備好逆轉。它會提醒您市場結構的變化,通常會在發生逆轉或重大回調時發生。 該指標使用專有計算來確定突破和價格動能。每當在可能的耗盡點附近形成新的高點時,指標就會繪製最後一個生成該高點的順序塊。然後,它將隨價格移動隨價格跟隨定單。然後,當價格轉向相反方向並突破該訂單塊時,它會提醒您,從而創建新的市場結構並開始趨勢或重大回調的可能逆轉。 訂單塊是在創建高/低之前的最後一個相反的彩色蠟燭,並且當價格跌破這些關鍵區域以下時,這表明趨勢可能會發生短期或長期反轉。 特徵 提醒您關鍵耗盡點的市場結構變化 價格接近耗盡水平時自動提取訂單塊 在一個方向繼續移動時,在價格後面跟踪定單,以提醒您最佳的反轉輸入 將顏色更改為純色塊,以顯示何時發生市場結構中斷。 適用於所有交易品種和時間範圍 內置集成的彈出窗口和電子郵件警報 策略和如何與定單破壞者指標進行交易 當斷路器塊發生時,您有兩個選擇。 看左邊!我們正在尋求供應/需求或支撐/阻力位嗎?市場結構轉變(逆轉)通常發生在價格重新測試舊水平或
Bill Williams Advanced
Siarhei Vashchylka
5 (6)
Bill Williams Advanced is designed for automatic chart analysis using Bill Williams' "Profitunity" system. The indicator analyzes four timeframes at once. Manual (Be sure to read before purchasing) Advantages 1. Automatically analyzes the chart using the "Profitunity" system of Bill Williams. The found signals are placed in a table in the corner of the screen. 2. Equipped with a trend filter based on the Alligator indicator. Most of the system signals are recommended to be used only accordi
AW Trend Predictor MT5
AW Trading Software Limited
4.78 (58)
一个系统中趋势和故障水平的组合。先进的指标算法过滤市场噪音,确定趋势、进入点以及可能的退出水平。指标信号记录在统计模块中,您可以选择最合适的工具,显示信号历史的有效性。该指标计算获利和止损标记。 手册和说明 ->   这里 / MT4 版本 ->   这里 如何使用指标进行交易: 使用趋势预测器进行交易只需三个简单的步骤: 第 1 步 - 开仓 收到买入信号,成功率超过 70% 第 2 步 - 确定止损 通过相反的信号选择中继线 第 3 步 - 定义止盈策略 策略一:达到 TP1 时平仓 策略 2:达到 TP1 时平仓 50%,达到 TP2 时平仓剩余 50% 策略三:在趋势反转时平仓 好处: 从不重绘结果,信号严格位于蜡烛收盘时 它可以在顾问中使用 获利和止损标记 对交易策略或独立策略的重要补充 市场噪音过滤算法 适用于任何工具 统计模块: 为了更好地选择配对,请使用内置的统计计算。 计算交易 - 给出统计数据的信号总数 成功评级 - 达到 TP1 的信号百分比,或反转那些正获利的信号时的百分比 TakeProfit1 Hit - 达到 TP1 的信号百分比 TakeProfit2
TrendMaestro5
Stefano Frisetti
note: this indicator is for METATRADER4, if you want the version for METATRADER5 this is the link:  https://www.mql5.com/it/market/product/108106 TRENDMAESTRO ver 2.4 TRENDMAESTRO recognizes a new TREND in the bud, he never makes mistakes. The certainty of identifying a new TREND is priceless. DESCRIPTION TRENDMAESTRO identifies a new TREND in the bud, this indicator examines the volatility, volumes and momentum to identify the moment in which there is an explosion of one or more of these data a
介绍     Quantum Breakout PRO   ,突破性的 MQL5 指标,正在改变您交易突破区域的方式!由拥有超过13年交易经验的资深交易员团队开发,     量子突破 PRO     旨在通过其创新和动态的突破区域策略将您的交易之旅推向新的高度。 量子突破指标将为您提供带有 5 个利润目标区域的突破区域的信号箭头,以及基于突破框的止损建议。 它既适合新手交易者,也适合专业交易者。 量子 EA 通道:       点击这里 重要的!购买后请私信我领取安装手册。 建议: 时间范围:M15 货币对:GBPJPY、EURJPY、USDJPY、NZDUSD、XAUUSD 账户类型:ECN、Raw 或 Razor,点差极低 经纪商时间:GMT +3 经纪商:IC Markets、Pepperstone with Raw 和 Razor 的点差最低 规格: 不重漆! 最多 5 个建议利润目标区域 建议止损水平 可定制的盒子。您可以设置自己的 Box Time Start 和 Box Time End。 接触 如果您有任何疑问或需要帮
The 1 2 3 Pattern Scanner MT5
Reza Aghajanpour
5 (14)
** All Symbols x All Timeframes scan just by pressing scanner button ** ***Contact me after purchase to send you instructions and add you in "123 scanner group" for sharing or seeing experiences with other users. After 17 years of experience in the markets and programming, Winner indicator is ready. I would like to share with you! Introduction The 123 Pattern Scanner indicator with a special enhanced algorithm is a very repetitive common pattern finder with a high success rate . Interestingly,
Quantum Heiken Ashi PRO MT5
Bogdan Ion Puscasu
4.5 (8)
Quantum Heiken Ashi PRO 简介 Heiken Ashi 蜡烛旨在提供对市场趋势的清晰洞察,以其过滤噪音和消除虚假信号的能力而闻名。告别令人困惑的价格波动,迎接更流畅、更可靠的图表表示。 Quantum Heiken Ashi PRO 的真正独特之处在于其创新公式,它将传统烛台数据转换为易于阅读的彩色条。红色和绿色条分别优雅地突出了看跌和看涨趋势,让您能够以非凡的精度发现潜在的进入和退出点。 量子 EA 通道:       点击这里 MT4版本:       点击这里 这一卓越的指标具有以下几个关键优势: 增强清晰度:通过平滑价格波动,Heiken Ashi 金条可以更清晰地反映市场趋势,使您更容易识别有利的交易机会。 减少噪音:告别经常导致错误信号的不稳定价格变动。 Quantum Heiken Ashi 指标可过滤噪音,使您能够做出更明智的交易决策 无缝集成:Heiken Ashi 指标专为 MetaTrader 开发,可无缝集成到您的交易平台中。它用户友好、高度可定制,并且与您的其他交易指标和过滤器兼容 无论您是寻求新优势的经验丰富的交易者,
Golden Gate Algo MT5
James David Lane
4 (6)
40% 圣诞优惠!价格将于1月1日涨至$250! 推出GoldenGate Entries:前沿交易解决方案! 发现与GoldenGate Entries(GGE)一同进行交易的革命性方法,这是一款设计用于提升您交易体验的先进指标。GGE提供了一套全面的功能,以赋予用户在交易决策中的精准和信心。 交易对:任意(外汇 - 商品 - 股票 - 股票 - 加密货币) 时间框架:15分钟至H1 主要特点: 买入和卖出箭头指示:接收伴随弹出警报的买入和卖出箭头指示,确保您随时保持了解。 GoldenGate_Algo:通过GoldenGate_Algo深入了解市场状况,这是一款强大的工具,用于评估市场是否处于“超卖”或“超买”状态。 当前趋势分析:通过访问您正在查看的时间框架上的当前趋势,保持领先地位,使您能够将交易与市场当前方向对齐。 内置枢轴点:使用内置的枢轴点轻松识别关键市场点,提供有价值的支撑和阻力水平。 蜡烛扫描器:分析蜡烛形态和图案,找到最佳的入场点并过滤掉低概率的入场。 完全定制:通过完整的定制选项,完全掌控您的交易体验,允许您个性化从
TPA True Price Action indicator reveals the true price action of the market makers through 100% non-repainting signals strictly at the close of a candle! TPA shows entries and re-entries, every time the bulls are definitely stronger than the bears and vice versa. Not to confuse with red/green candles. The shift of power gets confirmed at the earliest stage and is ONE exit strategy of several. There are available now two free parts of the TPA User Guide for our customers. The first "The Basics"
Blahtech Market Profile MT5
Blahtech Limited
5 (8)
Was: $249  Now: $99   Market Profile defines a number of day types that can help the trader to determine market behaviour. A key feature is the Value Area, representing the range of price action where 70% of trading took place. Understanding the Value Area can give traders valuable insight into market direction and establish the higher odds trade. It is an excellent addition to any system you may be using. Inspired by Jim Dalton’s book “Mind Over Markets”, this indicator is designed to suit the
Legacy of Gann for MT5
Pavel Zamoshnikov
5 (6)
The indicator very accurately determines the levels of the possible end of the trend and profit fixing. The method of determining levels is based on the ideas of W.D.Gann, using an algorithm developed by his follower Kirill Borovsky. Extremely high reliability of reaching levels (according to K. Borovsky  - 80-90%) Indispensable for any trading strategy – every trader needs to determine the exit point from the market! Precisely determines targets on any timeframes and any instruments (forex, met
Auto Order Block with break of structure based on ICT and Smart Money Concepts (SMC) Futures Break of Structure ( BoS )             Order block ( OB )            Higher time frame Order block / Point of Interest ( POI )    shown on current chart           Fair value Gap ( FVG ) / Imbalance   -  MTF      ( Multi Time Frame )    HH/LL/HL/LH  -  MTF      ( Multi Time Frame )  Choch  MTF      ( Multi Time Frame )  Volume Imbalance     ,  MTF          vIMB Gap’s Power of 3 Equal High
Easy Buy Sell Signal Alert
Franck Martin
4.86 (7)
Easy By Sell is a market indicator for opening and closing positions. It becomes easy to track market entries with alerts. It indicates trend reversal points when a price reaches extreme values ​​and the most favorable time to enter the market. it is as effective as a Fibonacci to find a level but it uses different tools such as an algorithm based on ATR indicators and Stochastic Oscillator. You can modify these two parameters as you wish to adapt the settings to the desired period. My othe
Fractal Advanced MT5
Siarhei Vashchylka
5 (3)
Fractal Advanced - displays Fractal and Alligator indicators on the price chart. Has wide options for settings and customization. It is also equipped with alerts and a hotkey system. Manual (Be sure to read before purchasing) | Version for MT4 Advantages 1. The indicator does not fill the entire chart with fractals, but allows you to display only relevant signals. 2. The number of fractals is adjusted by scrolling the mouse while holding down the Shift key. 3. Instantly show/hide the Alligator
首先值得强调的是,这个交易系统是一个不重绘、不重画和不滞后的指标,这使它非常适合专业交易。 在线课程,用户手册和演示。 “智能支撑和阻力交易系统”是专为新手和经验丰富的交易者量身定制的先进指标。它赋予交易者在外汇市场上精确和自信的能力。这个综合系统结合了7+种策略、10个指标和各种交易方法,包括日内交易策略、波段交易策略、支撑和阻力策略、蜡烛图模式策略、VWAP策略、多时间段趋势策略等。它提供箭头信号、入场和出场点、交易警报、更高时间框架的趋势分析、实时交易监控以及见解深刻的趋势和成交量蜡烛染色。通过自动支撑和阻力检测,这是一个多面手的指标,帮助交易者在不同的市场条件下做出明智的决策。 “智能支撑和阻力交易系统”是一个强大的技术分析方法,融合了一套高端和强大的指标和工具。在其核心,这个系统识别关键的支撑和阻力水平,这些水平作为潜在市场反转或延续的关键区域。该系统无缝集成了多时间框架趋势面板,增强了交易者在不同时间框架下评估当前趋势方向的能力。此外,蜡烛图模式检测器扫描价格图表以获取重要的蜡烛图模式,为潜在的市场走势提供宝贵的见解。此外,VWAP(成交量加权平均价格)的加入
Gartley Hunter Multi
Siarhei Vashchylka
5 (7)
Gartley Hunter Multi - An indicator for searching for harmonic patterns simultaneously on dozens of trading instruments and on all possible timeframes. Manual (Be sure to read before purchasing) | Version for MT4 Advantages 1. Patterns: Gartley, Butterfly, Shark, Crab. Bat, Alternate Bat, Deep Crab, Cypher 2. Simultaneous search for patterns on dozens of trading instruments and on all possible timeframes 3. Search for patterns of all possible sizes. From the smallest to the largest 4. A
IX Power MT5
Daniel Stein
5 (3)
IX Power 终于将 FX Power 的无与伦比的精确性带到了非外汇交易符号中。 它能准确判断您喜爱的指数、股票、商品、ETF 甚至加密货币的短期、中期和长期趋势强度。 您可以 分析 终端提供的 一切 。试试吧,体验一下您在交易时如何把握 时机 。 IX Power 主要功能 100% 精确的非重绘计算结果 - 适用于您终端中的所有交易符号 下拉式选择预配置以及可单独配置的强度分析周期 通过电子邮件、消息和手机通知的无数种通知选项 可访问的 EA 请求缓冲区 可自定义计算限制,以获得更好的性能 为希望查看更多信息的用户提供特殊的多实例设置 无尽的图形设置,让您在每个图表中都能找到最喜欢的颜色 采用 Windows 11 和 macOS 风格的圆角新面板设计 神奇的移动指标面板,可在子窗口和主图表之间无缝移动 适用于高分辨率 QHD、UHD 和 4K 显示器,并针对平板电脑和触摸屏进行了优化 IX Power 参数 最重要的参数不言自明,但我们很快会在另一篇文章中为您提供所有 IX Power 参数的完整说明。 使用别名 "参数可为技术交易符号
作者的更多信息
Stochastic Slow
Danrlei Hornke
Stochastic: It was developed by George Lane in the early 1950s. It is based on the principle that the price closes close to the maximum if the asset is on an uptrend, and close to the minimum if it is on a downtrend. Following the idea of the inercial movement of prices. This indicator can generate possible signals of overbought moments or about asset sales. In a usual way it can used according to some standards; Slow Stochastic: A moving average of 3 periods is calculated on the stochastic i
Touch VWAP MT5
Danrlei Hornke
5 (5)
O Touch VWAP é um indicador que permite calcular uma Média Ponderada por Volume (VWAP) apenas apertando a tecla 'w' no seu teclado e após clicando no candle do qual deseja realizar o calculo, clicando abaixo do candle é calculada a VWAP baseado na minima dos preços com o volume, clicando sobre o corpo do candle é calculado uma VWAP sobre o preço medio com o volume e clicando acima do candle é calculado uma VWAP baseado na máxima dos preços com o volume, voce tambem tem a opção de remover a VWA
FREE
Touch VWAP MT4
Danrlei Hornke
5 (1)
O Touch VWAP é um indicador que permite calcular uma Média Ponderada por Volume (VWAP) apenas apertando a tecla 'w' no seu teclado e após clicando no candle do qual deseja realizar o calculo, clicando abaixo do candle é calculada a VWAP baseado na minima dos preços com o volume, clicando sobre o corpo do candle é calculado uma VWAP sobre o preço medio com o volume e clicando acima do candle é calculado uma VWAP baseado na máxima dos preços com o volume, voce tambem tem a opção de remover a VWAP
FREE
O Afastamento da Média Móvel, é uma poderosa ferramenta de análise técnica projetada para fornecer uma representação visual do afastamento entre o preço atual e uma média móvel específica. Este indicador, desenvolvido para o MetaTrader, oferece aos traders uma perspectiva clara das mudanças na dinâmica de preço em relação à tendência de médio prazo. Versão MT4:  https://www.mql5.com/pt/market/product/111705
FREE
O indicador é uma ferramenta desenvolvida para o MetaTrader, projetada para auxiliar na análise detalhada do comportamento do preço em relação a uma média móvel específica. Ao ser anexado ao timeframe diário, o ele realiza cálculos e monitora, em timeframes menores, quantas vezes o preço toca determinados níveis de afastamento durante o dias além de calcular a média dos toques. MT4:  https://www.mql5.com/pt/market/product/111706
FREE
O Chart Control é um indicador que permite de forma rapida e pratica alterar o timeframe e ativo do grafico, possibilitando que voce possa fazer todas as suas analises em apenas um grafico sem precisar abrir vários, além disso voce pode escolher o entre os temas claro e escuro para o qual melhor se adapta a sua preferencia. MT4:  https://www.mql5.com/pt/market/product/112155  
FREE
O indicador é uma ferramenta desenvolvida para o MetaTrader, projetada para auxiliar na análise detalhada do comportamento do preço em relação a uma média móvel específica. Ao ser anexado ao timeframe diário, o ele realiza cálculos e monitora, em timeframes menores, quantas vezes o preço toca determinados níveis de afastamento durante o dias além de calcular a média dos toques. MT5:  https://www.mql5.com/pt/market/product/111710
FREE
O Afastamento da Média Móvel, é uma poderosa ferramenta de análise técnica projetada para fornecer uma representação visual do afastamento entre o preço atual e uma média móvel específica. Este indicador, desenvolvido para o MetaTrader, oferece aos traders uma perspectiva clara das mudanças na dinâmica de preço em relação à tendência de médio prazo. Versão MT5:  https://www.mql5.com/pt/market/product/111704
FREE
Chart Control MT4
Danrlei Hornke
5 (1)
O Chart Control é um indicador que permite de forma rapida e pratica alterar o timeframe e ativo do grafico, possibilitando que voce possa fazer todas as suas analises em apenas um grafico sem precisar abrir vários, além disso voce pode escolher o entre os temas claro e escuro para o qual melhor se adapta a sua preferencia. MT5:  https://www.mql5.com/pt/market/product/109444
FREE
Keltner Channels (ou   Canais de Keltner ) é mais um indicador de   volatilidade   utilizado pela   análise técnica. Também chamado de   envelope , esse canal foi criado por Chester Keltner para monitorar os seus investimentos no mercado futuro de café na década de 1960. Porém, com o passar do tempo, passou também a ser utilizado para outros ativos e, atualmente, é uma das ferramentas mais utilizadas pelos traders. Nesta versão customizada foram adicionados novas opções de método de média movel
A Média Móvel é um indicador que faz parte da Análise Técnica. Com ela, é possível identificar o equilíbrio dos preços no mercado, observando tendências de alta, neutra ou baixa. Este indicador customizado traz opções extras pera definir o método de cálculo podendo-se esclolher entre SMA,EMA,SSMA,LWMA,JJMA,JurX,ParMA,T3,Vidya,AMA,HULL MA. Também conta com varias opções para escolher o método de cálculo para o preço base a ser usado no cáculo da média.
筛选:
无评论
回复评论
版本 1.2 2022.11.30
Adicionados os setups 9.2, 9.3 e 9.4