Fear and Greed MT4
- 指标
- Diego Arribas Lopez
- 版本: 1.1
- 更新: 26 十二月 2021
- 激活: 5
[MT5 Version]
How to trade using the Fear and Greed Indicator: Click here
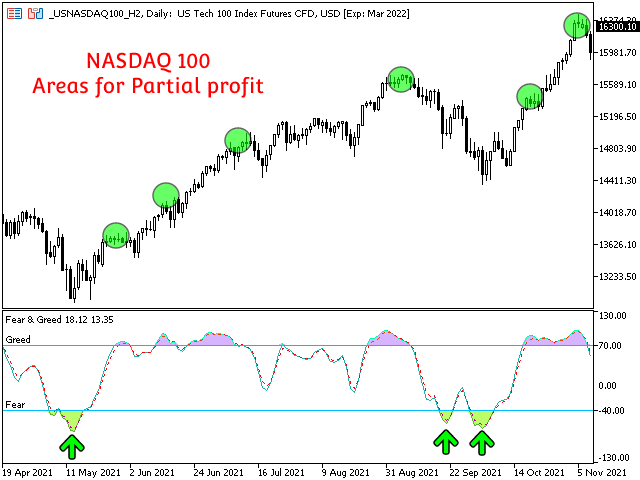
Uncertain about when to take total or partial profits? The Fear and Greed is your reliable companion for making confident trading decisions. This innovative tool offers unparalleled insights into market sentiment, helping you identify key pivot zones and optimize your trading strategy.
Why Choose Fear and Greed?
Revolutionary Market Insight:
- Sentiment Analysis: The first indicator for that reveals the market's Fear and Greed levels, enabling better entry and exit decisions.
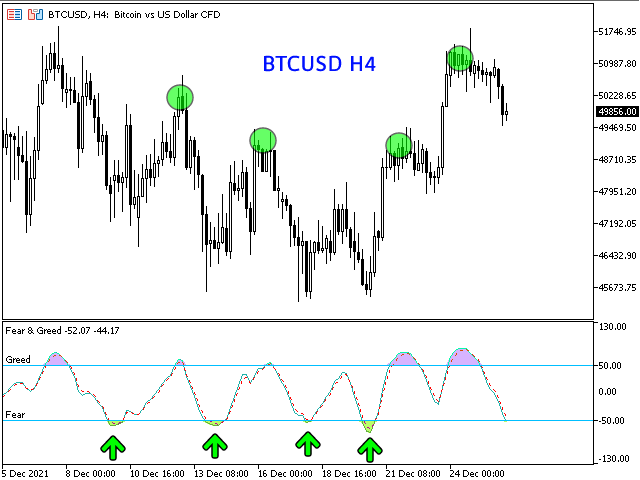
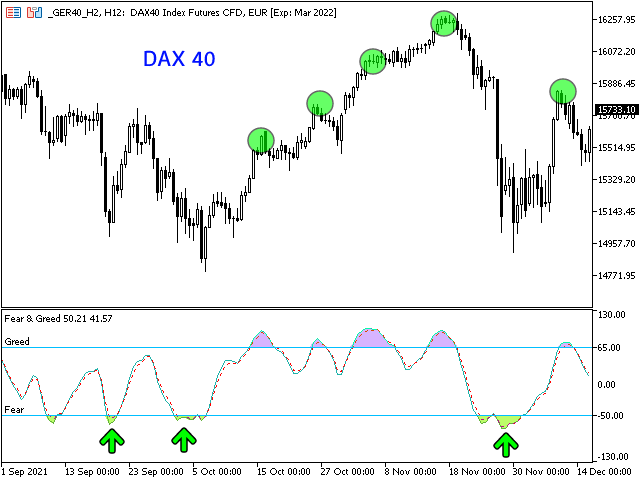
- Pivot Key Zones: Identify potential pivot points in the current timeframe for bullish and bearish markets.
Versatility Across Trading Styles:
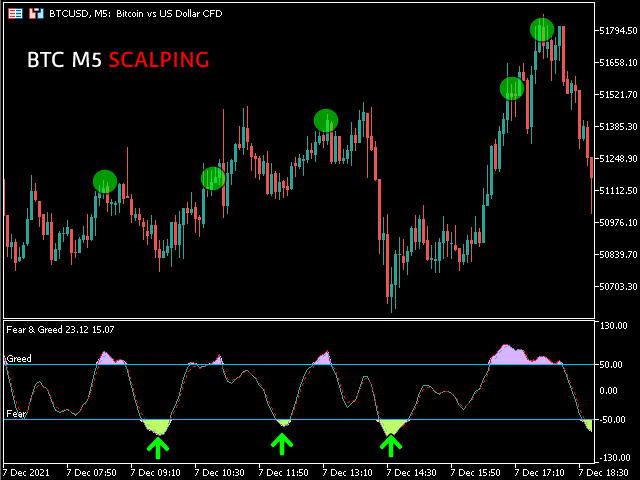
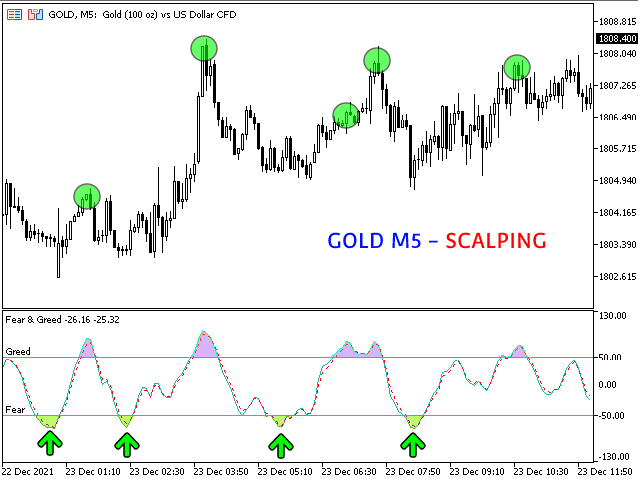
- Ideal for All Strategies: Perfect for HOLD, SCALPING, and SWING trading strategies.
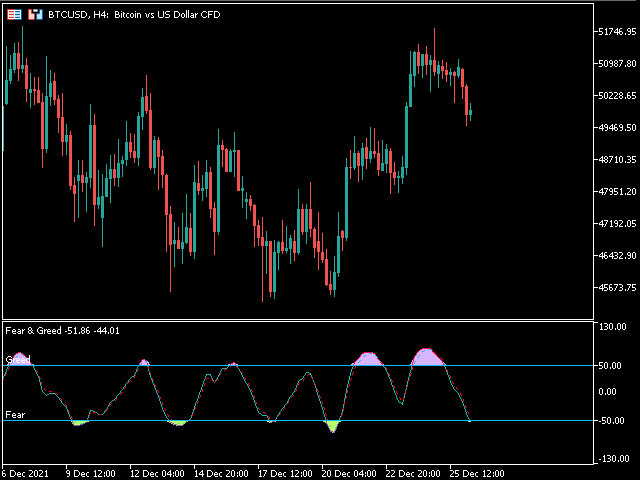
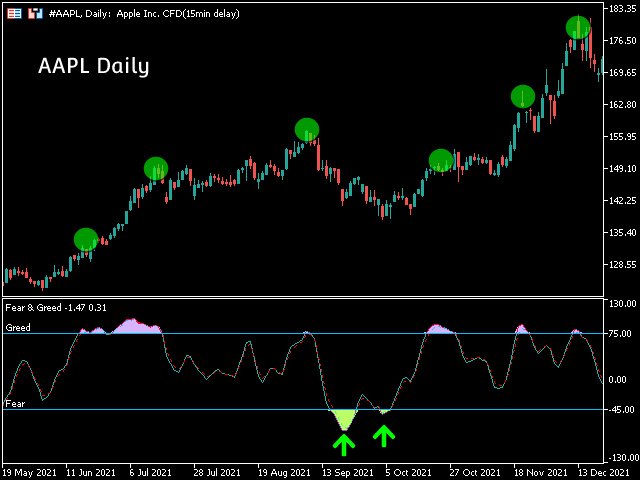
- Multi-Timeframe Analysis: Functional across multiple timeframes, offering comprehensive market perspectives.
Advanced Features:
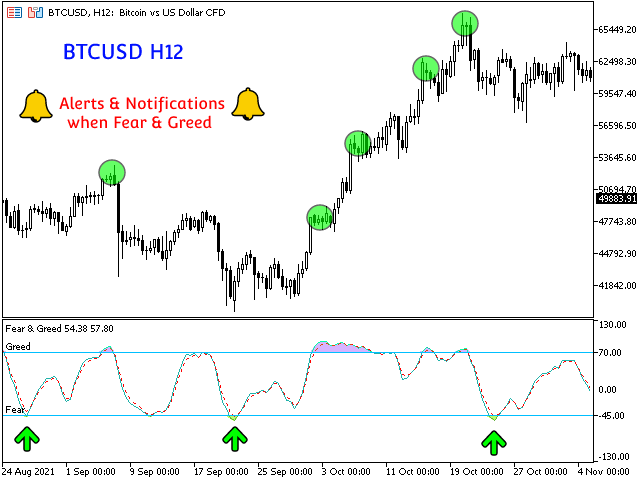
- Sophisticated Alerts: Receive alerts and notifications on your mobile phone and Terminal when Fear and Greed levels are triggered.
- Highly Customizable: Tailor settings to suit your trading style and market preferences, including indices, stocks, and crypto.
Key Features:
- Time-Saving: Streamline your trading process and make quicker decisions.
- Ease of Decision-Making: Facilitate taking full or partial profits with confidence.
- Functional Across All Pairs: Applicable to Crypto, Forex, Stocks, Indices, and Commodities.
- Highlights Reversal Areas: Identify potential market reversal zones.
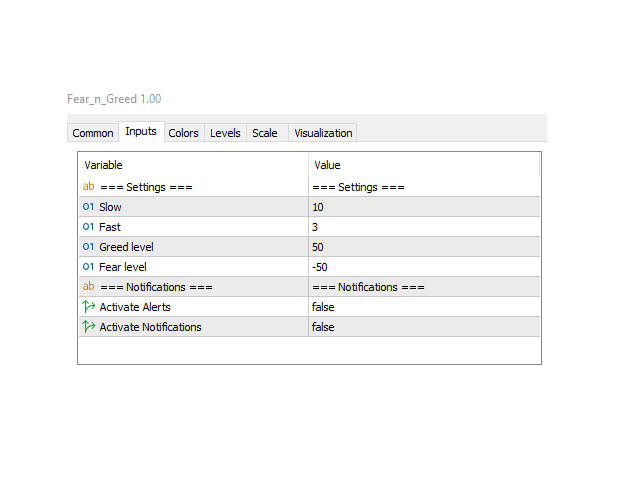
- Customizable Input Parameters: Adjust Slow, Fast, Greed, and Fear levels to better suit different markets.
- Color Customization: Personalize the indicator's colors to match your chart preferences.
Transform Your Trading Strategy!
Gain the confidence to make informed trading decisions with the Fear and Greed Indicator. Invest in your trading future now and navigate market sentiment with precision.

用户没有留下任何评级信息