Rise Fall ATR MT4
1.这是什么
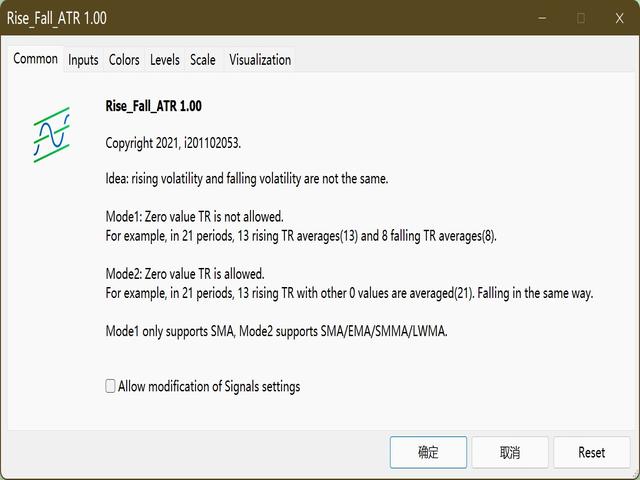
上涨波动和下降波动是不一样的,无论是学术研究还是实际检验都说明了这一点。
原始的ATR指标是把上涨波动和下降波动放在一起进行计算。本指标则是把上涨波动和下降波动分开进行计算,这样能更好的帮助你研究市场。
2.指标说明
本指标的计算有两种模式,如下表所示:
| 0 | 1 | 2 | 3 | 4 | 5 | |
| 波动方向 | + | - | + | + | - | + |
| TR | 15 | 20 | 17 | 5 | 16 | 8 |
| 原始ATR | (15+20+17+5+16+8)/6=13.5 | |||||
| 模式1 | 不以0填充位置,周期数改变 | |||||
| 模式1上涨TR | 15 | 17 | 5 | 8 | ||
| 模式1下跌TR | 20 | 16 | ||||
| 模式1上涨ATR | (15+17+5+8)/4=11.25 | |||||
| 模式1下跌ATR | (20+16)/2=18 | |||||
| 模式2 | 以0填充位置,周期数不变 | |||||
| 模式2上涨TR | 15 | 0 | 17 | 5 | 0 | 8 |
| 模式2下跌TR | 0 | 20 | 0 | 0 | 16 | 0 |
| 模式2上涨ATR | (15+0+17+5+0+8)/6=7.5 | |||||
| 模式2下跌ATR | (0+20+0+0+16+0)/6=6 | |||||
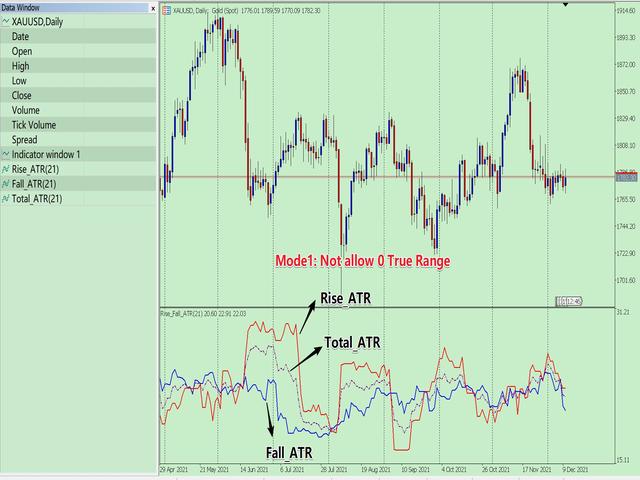
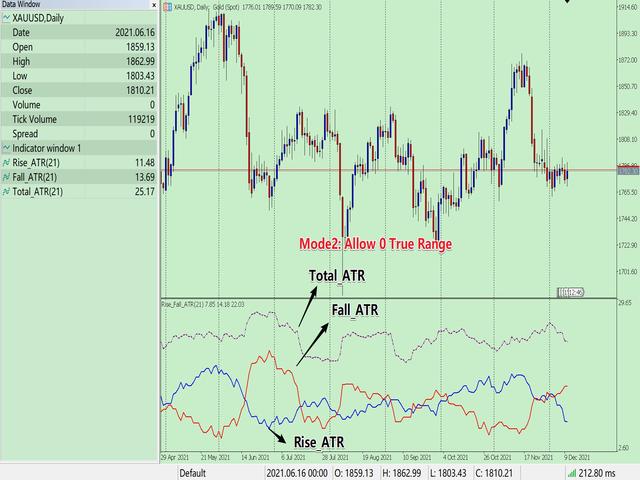
如上表。比如周期为6的序列中,有4个上涨2个下跌。模式1不以0填充位置,所以涨跌的周期数都分别改变为4和2。模式2以0填充位置,所以涨跌的周期数都不变。
模式1仅用SMA进行平均计算。模式2由于周期不变,可以用多种平均方法进行计算。
3.使用说明
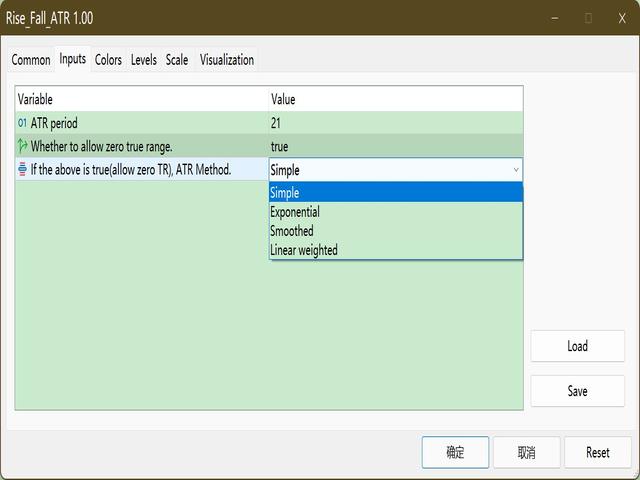
参数说明:
- InpAtrPeriod = 21; // ATR period
- InpAllowZeroTR = false; // Whether to allow zero true range.
- InpMAMethod = MODE_SMA; // If the above is true(allow zero TR), you can choose ATR Method.
结果有3个:Rise_ATR, Fall_ATR, Total_ATR。其中 Total_ATR 就是不区分涨跌的ATR结果。
4.其他
本指标有MT4版本和MT5版本