Trend Channel Alert
- 指标
- Nikolay Ivanov
- 版本: 1.2
- 更新: 10 八月 2023
- 激活: 5
价格通道是交易者分析当前市场情况的主要工具。在它的帮助下,您可以成功预测未来的价格行为,但获利的主要因素是及时的决策。这通常是一个问题,因为根本不可能经常看显示器。
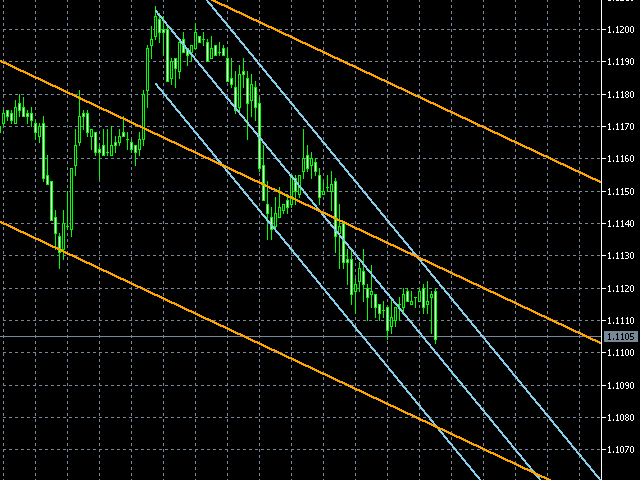
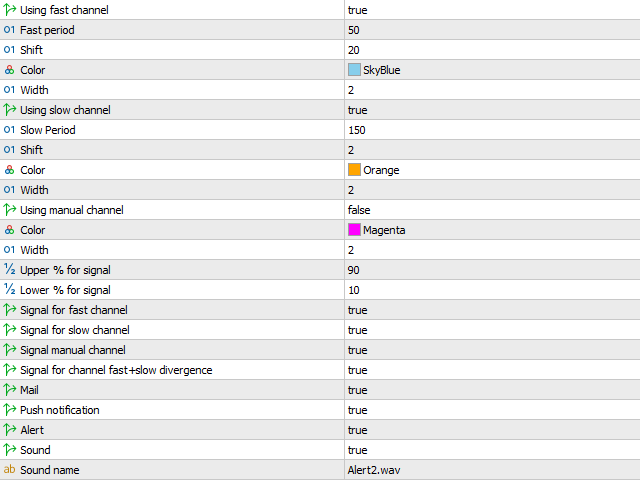
该指标自动构建和更新具有不同周期(快和慢)的两个趋势通道。趋势是使用线性回归确定的。也可以使用 1 个自定义频道,您可以自行构建。
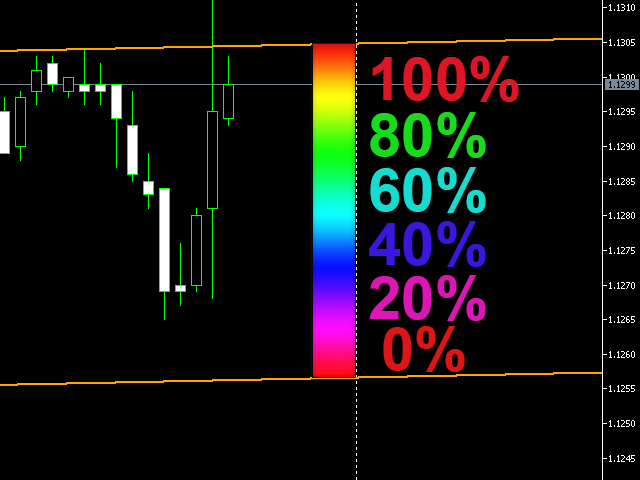
该指标将通道划分为百分比区域。您可以指定您感兴趣的区域的百分比。当价格达到此区域时,您将收到通知。
该指标的一个有趣特征是接收背离信号 - 这是当价格处于不同时期的相反通道区域时。这是一个强烈的信号。
“shift”参数在构建通道时定义了一个小前锋。
可以使用以下类型的通知:电子邮件、推送通知、警报,以及以 wav 格式播放您选择的任何声音。
Всё круто, хороший индикатор. Качественно сделан и отлично помогает.