True Choppiness Direction MT5
- 指标
- Libertas LLC
- 版本: 1.4
- 激活: 20
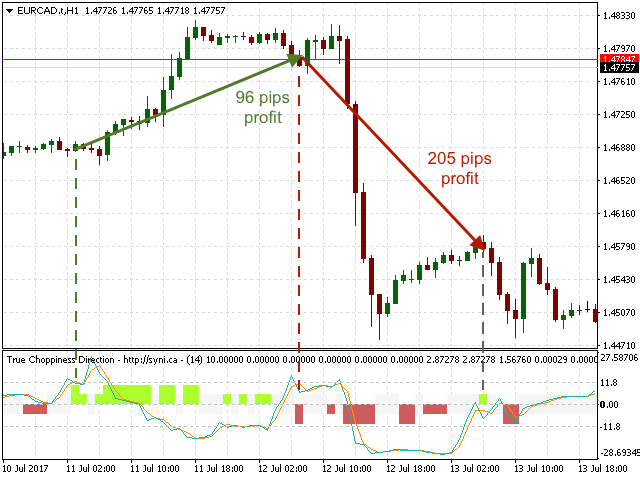
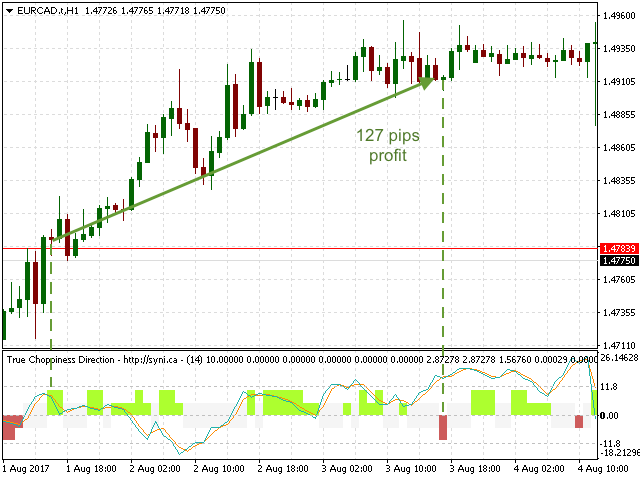
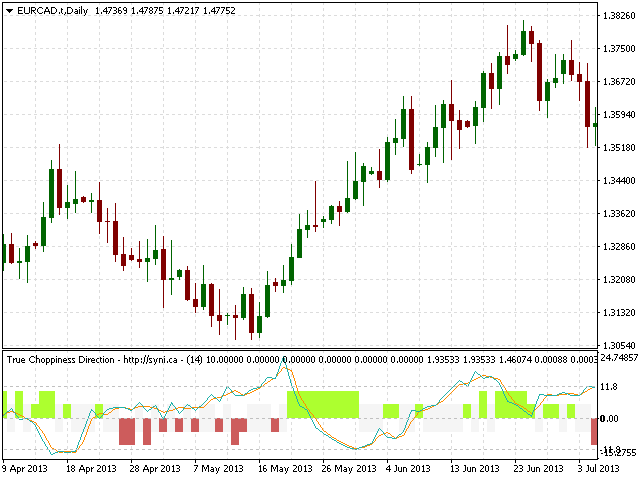
True Choppiness Direction determines if the market is choppy (trading sideways) or if it is trending, as well as the trend direction and strength (green=up, red=down, grey=no trend). The underlying algorithm is designed to detect trend movements even in the presence of noisy market data, please see screenshots.
Trend strength is indicated by taller or shorter red/green fill. Choppiness index is range-bound between -50 (very trendy) and +50 (very choppy). This is a custom algorithm designed by us :)
Trading Strategies
There are many trading strategies for the True Choppiness Direction indicator, either as a stand-alone or in combination with other indicators. A simple and effective strategy is described below:
- Enter a trade when the trend fill turns green (call) or red (put), and choppiness index (blue) is moving downward (toward negative i.e., trendy area)
- Conservative Exit: If trade is profitable, exit when trend fill turns grey (i.e., no trend), or
- Medium Exit: When trend fill is grey and the choppiness index (blue) line crosses above 0 (i.e., choppy period), exit the trade, or
- Riskier Exit: Do not exit when trend fill turns grey, but rather wait until the trend fill turns the opposite trend color (red if placed a call, or green if placed a put). This strategy is best for capturing full trend movements, because it captures multiple movement phases of a trend.
Parameters
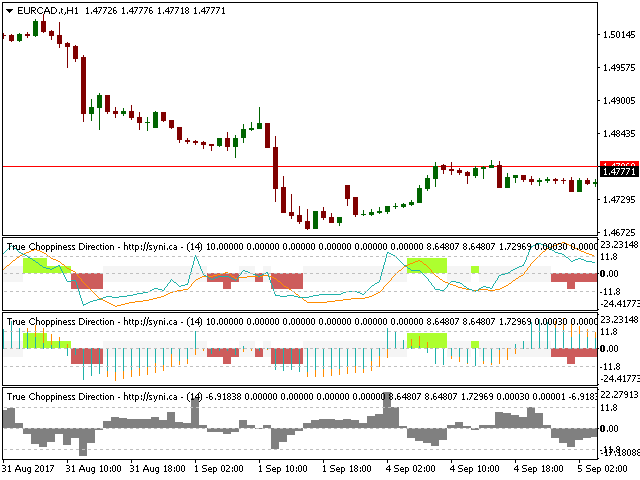
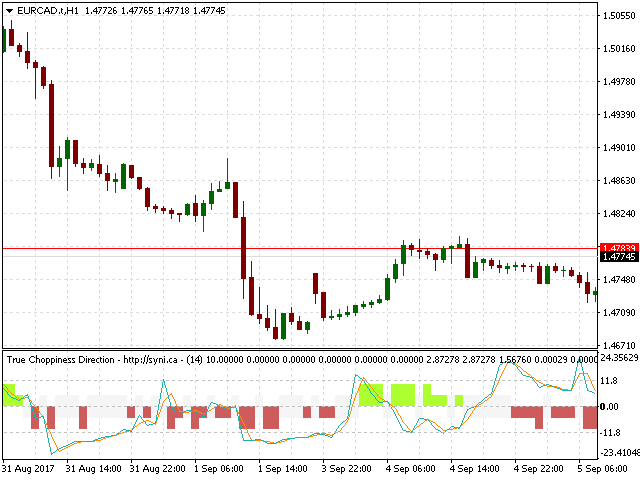
- TCD Calculation Type (Default=Standard): Indicates how indicator is visualized, either Standard (with choppiness indicator lines); TCDBars (with choppiness indicator bars); or Histogram (fast detection of trendy/choppy, trendy is < 0 and choppy is >0).
- Calculation period (Default=14): Number of bars used for calculation.
- Control line period (Default=5): Calculation period used to compare short/long term choppy/trendy values. The parameter varies detection sensitivity for choppy/trendy periods.
- Control scaler (Default=1.25): Scaler used for short/long-term choppy/trendy values.

Indicator has bugs. Doesn't work well. Cannot be used for serious trading. Seller not responding to messages.