• 概述
  • 评论
  • 评论

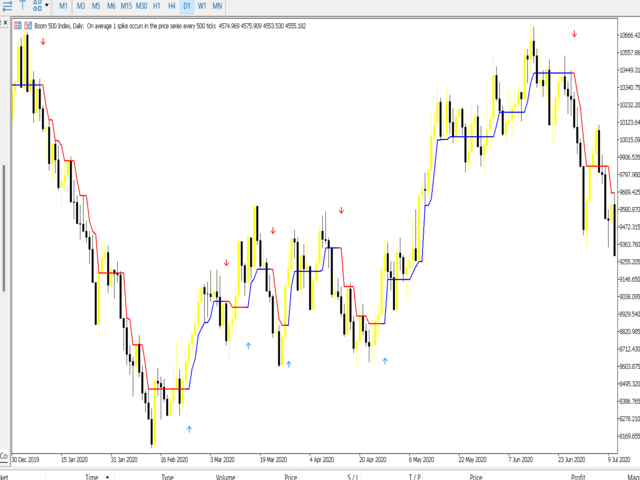
Boom Crash Trend Indicator

Boom and Crash Trend Detector is a  Non-Repaint MT5 trading system usually being sold for 50 0$.

Most people use this for Deriv but can be used to forex too.

The boom and crash spike indicator is a spike detecting software, with Multiple features, these features include.

  • Spike Alert ( from 10 to 100-second warning before spike)
  • Continues spike Alert (for double or continuous spikes at a time)
  • supports all Boom/crash Indices
  • M6 time frame works best here .
  • Bigger time frame trend pointer for Swing trading
  • Non-Repaint

Works Best on M6 Time Frame 

推荐产品
KT Pin Bar MT5
KEENBASE SOFTWARE SOLUTIONS
KT Pin Bar identifies the pin bar formation which is a type of price action pattern which depicts a sign of reversal or rejection of the trend. When combined with support and resistance, BRN and other significant levels, Pin Bar pattern proved to be a very strong sign of reversal. Basically, a pin bar is characterized by a small body relative to the bar length which is closed either in upper or lower 50% part of its length. They have very large wicks and small candle body. A pin bar candlestic
Visual Range Directional Force Indicator
AL MOOSAWI ABDULLAH JAFFER BAQER
Range Directional Force Indicator – Designed for You to Optimize! The Range Directional Force Indicator is a cutting-edge tool designed to empower traders by visualizing market dynamics and directional strength. Built to offer insights into market trends and reversals, this indicator is an invaluable asset for traders seeking precision in their strategies. However, it is important to note that this indicator is not optimized, leaving room for you to tailor it to your unique trading preferences.
KT Renko Patterns MT5
KEENBASE SOFTWARE SOLUTIONS
KT Renko Patterns 会逐砖扫描整个 Renko 图表,寻找那些在各种金融市场中被交易者频繁使用的著名图表形态。 与基于时间的图表相比,Renko 图由于其简洁清晰的特性,更容易识别图表形态,尤其适合基于形态的交易策略。 KT Renko Patterns 包含多种常见的 Renko 图形模式,其中许多都在 Prashant Shah 所著的《用 Renko 图表实现盈利交易》一书中有详细说明。 基于 KT Renko Patterns 指标开发的 100% 自动交易EA已发布,点击这里了解 - KT Renko Patterns EA 。 特点 可交易多达八种清晰明确的 Renko 图形模式,无任何模糊。 每种模式都配有止损位和斐波那契目标位,确保交易策略客观明确。 KT Renko Patterns 实时监测每种模式的准确率,并将关键统计信息显示在图表上。 当 Renko 砖块发生反转时会自动标记并提醒,有助于在行情突变时提前计划退出。 已识别的图形不会重绘或重新绘制,信号稳定可靠。 包含的图形模式 W-M 形态 强势旗形 AB=CD 形态 三顶/三底 双顶
Blue Shark Mt5
Riccardo Canu
Blue Shark is a trading robot  for the trading on Forex. It a   Trend Following   system and works in this way: 1. Identify the trend 2. Wait for a retracement 3. Cover profits Blue Shark MT5 is a fully automated trading system that doesn't require any special skills from you. Just fire up this EA and rest. You don't need to set up anything, EA will do everything for you. EA is adapted to work on small deposits from $500. REQUIREMENTS FOR YOUR ACCOUNT Leverage >= 1:500 Balance >= $500 (or equ
KT Asian Breakout Indicator MT5
KEENBASE SOFTWARE SOLUTIONS
KT Asian Breakout 指标分析亚洲交易时段的关键部分,以生成双向买卖信号,并基于价格突破的方向进行交易。当价格突破该交易时段的最高点时,会出现买入信号;当价格突破最低点时,会出现卖出信号。 注意事项 如果交易时段的范围过大,建议避免新交易,因为大部分价格走势已在该时段内完成。 如果突破K线过大,价格通常会在继续沿信号方向运行之前发生短暂回调。 功能特点 买入/卖出信号包含止损和盈利目标。 KT Asian Breakout 指标持续监测其表现,并使用第一、第二或第三盈利目标作为成功标准。 显示三个关键性能指标,包括盈亏信号、成功率和每个信号的平均点数。 如果突破K线过大,图表上会显示警告信息。 推荐设置 时间周期: 15分钟。 交易货币对: 所有 JPY 货币对。 输入参数 绘制交易时段框 :  true/false 绘制止损和盈利目标 :  true/false 性能分析 : true/false 显示文本分析(左上角) :  true/false 成功率标准 :  第一目标 | 第二目标 | 第三目标 颜色和样式设置 :  可自定义 警报设置 :  可自定义
Ce super EA utilise une intelligence Artificiel spécifiques à l’or le plus récent,  le plus avancé avec une précision inégalée pour identifier les points d’achat et de vente. Il représente une avancée révolutionnaire dans le trading d’or sur le marché Forex. Mélangé à quelques indicateurs, d’un filtre, d’une couverture de grille, Après analyse, il élimine les fausses signaux et détecte de super entré.   L’EA utilise un stop suiveurs adaptatif.
HiperCube VIX
Adrian Lara Carrasco
Welcome to HiperCube VIX Discount code for 25% off at Darwinex Zero: DWZ2328770MGM This indicator provide you a real info of market of volume of sp500 / us500 Definition  HiperCube VIX  known as the CBOE Volatility Index, is   a widely recognized measure of market fear or stress . It signals the level of uncertainty and volatility in the stock market, using the S&P 500 index as a proxy for the broad market. The VIX Index is calculated based on the prices of options contracts on the S&P 500 inde
FREE
KT COG Robot MT5
KEENBASE SOFTWARE SOLUTIONS
KT COG Robot is a fully automated Expert Advisor based on the   KT COG Indicator . The COG indicator was originally presented by John F. Ehlers in the May 2002 edition of Technical Analysis of Stocks & Commodities magazine. The EA fires a long trade when COG line cross above the signal line and a short trade is fired when the COG line cross below the signal line.  Adaptive Filtration Our adaptive filtration algorithm combines the original COG formula with the major trend direction and market ac
趋势捕捉器: 具有警示指标的趋势捕捉器策略是一种多功能的技术分析工具,可帮助交易员识别市场趋势和潜在的进出点。它采用动态趋势捕捉器策略,根据市场条件进行调整,清晰地呈现趋势方向。交易员可以自定义参数,以符合其偏好和风险容忍度。该指标有助于识别趋势,发出潜在的反转信号,充当跟踪止损机制,并提供实时警报,以便及时应对市场。 具有警示指标的趋势捕捉器策略是一种多功能的技术分析工具,可帮助交易员识别市场趋势和潜在的进出点。它采用动态趋势捕捉器策略,根据市场条件进行调整,清晰地呈现趋势方向。交易员可以自定义参数,以符合其偏好和风险容忍度。该指标有助于识别趋势,发出潜在的反转信号,充当跟踪止损机制,并提供实时警报,以便及时应对市场。 特点: 趋势识别:信号牛市趋势和熊市趋势。 趋势反转:当蜡烛颜色从牛市变为熊市,反之亦然时,提醒可能的反转。 实时警报:为新趋势识别生成警报。 建议: 货币和货币对:EURUSD,AUDUSD,XAUUSD... 时间框架:H1。 账户类型:任何ECN,低点差账户。
FREE
KT Momentum Arrows MT5
KEENBASE SOFTWARE SOLUTIONS
5 (2)
KT Momentum Arrows 指标基于瞬时突破计算,它结合了价格波动方向中的带宽偏离和新兴波动率。这是一种对动量变化反应灵敏的技术指标,适合在趋势开始阶段发出交易信号。 当价格收于上轨之上时,生成买入信号;当价格收于下轨之下时,生成卖出信号。 该指标使用一个“幅度系数”作为输入参数,同时影响带宽偏离和波动率计算。建议根据不同品种和时间周期仔细选择和优化该系数值以获得最佳效果。 主要特点 信号不重绘! 非常适合动量交易者的进场工具。 性能分析功能:胜率、盈亏比、平均收益等数据可视化展示。 适用于日内交易者、波段交易者和剥头皮交易者。 输入参数 历史K线数量:  用于指标计算的K线数量。 幅度系数:  用于调节带宽偏离和波动率的单一系数。 性能分析:  显示或隐藏性能分析,包括利润趋势线。  提醒设置:  支持弹窗、邮件、推送和声音提醒。 其余参数无需额外解释,简单明了。
PZ Mean Reversion MT5
PZ TRADING SLU
3 (2)
采用专业和量化方法进行均值回归交易的独特指标。它利用了价格以可预测和可衡量的方式转移并返回均值这一事实,这允许明确的进入和退出规则大大优于非量化交易策略。 [ Installation Guide | Update Guide | Troubleshooting | FAQ | All Products ] 清晰的交易信号 非常容易交易 可定制的颜色和尺寸 实现性能统计 优于大多数交易策略 显示合适的止损和止盈水平 它实现了电子邮件/声音/视觉警报 这个怎么运作 该指标从更高的时间范围测量完全可定制的移动平均线的标准偏差,并使用趋势跟踪方法精确地找到交易。交易是通过深入当前图表的价格行为发现的,并在价格返回到平均价格区间时关闭,根据您选择的更高时间范围计算。由于其编码方式,该指标将远离高波动性和强劲趋势市场,并且仅在可预测的情况下进行交易,在可接受的波动性与方向性比率范围内,回归均值是可行的。 指标剖析 绿线是更高时间范围内的移动平均线(也就是平均值) 虚线区域是移动平均线周围的典型价格区间 蓝线是看涨交易的突破价格 红线是看跌交易的突破价格 交易是针对均值进行的,并在典型的价格
Bollingerpro
Marouane Benhmidane
BollingerPro - Your Complete Solution for Leveraging Bollinger Bands and Volume BollingerPro is a sophisticated Expert Advisor (EA) designed for traders who want to capitalize on Bollinger Bands, volume, and ATR (Average True Range). This robot is ideal for traders looking to use an automated strategy based on reversal signals, incorporating proven technical indicators to maximize potential gains while controlling risk. Key Data Utilized: Bollinger Bands : to identify dynamic support and resista
NeuroExt
Dmytryi Voitukhov
4 (11)
https://t.me/mql5_neuroExt 當前版本和討論。 您可以使用任何工具。基礎將在訓練開始時自動創建。如果您需要從 0 開始訓練 - 只需刪除數據庫文件。 一般條款。 可以訓練 EA 交易在任何工具上工作。 不要試圖在沒有神經網絡訓練的情況下進行測試! 訓練後的平衡圖是水平的就足夠了。 生成訓練基地非常簡單。 美元兌瑞郎可進行準備培訓。 為了正確操作,必須只有一對一帳戶!顧問,只有一個!工具。否則,平衡控制將不起作用。 初始存款 - 200 美元起。 選項: - OrderComm:在訂單中會補充一個操作方式和分析深度的標誌。 - 工作類型:學習\工作\市場。 “學習”——在這種模式下,你需要達到一個至少有輕微增加的時間表。沒有洞。此模式也可用於工作,但市場上一次只會有 1 個訂單。 “工作” - 定期加載數據庫。在測試人員同時進行培訓並不斷提高培訓質量的情況下。 “市場” - 僅供市場接收。需要切換。 - 我的百分比:... - SL:如果你在訓練模式下設置=0,40到110的值會被自動分配,會導致交易過多、學習緩慢和圖像失真。當 MaxOrders>1 且 Wor
FREE
SMC Venom 模型 BPR 指標是針對在智慧貨幣 (SMC) 概念內工作的交易者的專業工具。它會自動辨識價格圖表上的兩種關鍵模式: FVG (公平價值缺口)是三根蠟燭的組合,其中第一根和第三根蠟燭之間存在缺口。它在水平之間形成一個沒有成交量支撐的區域,這通常會導致價格調整。 BPR (平衡價格區間)是兩種 FVG 模式的組合,形成一個「橋樑」 - 當價格以低成交量活動移動時,突破並返回到水平的區域,從而在蠟燭之間產生間隙。 這些模式可協助交易者透過分析圖表上的交易量和價格動態(大型市場參與者和普通參與者之間的互動)來識別關鍵的支撐/阻力位、突破區域和切入點。 此指標以矩形和箭頭的形式可視化模式,也支援靈活的警報設定。 主要特點: 模式顯示模式:選擇顯示 BPR 模式(看漲和看跌)或 FVG 模式(看漲和看跌)。 可以隱藏所有圖表分析模式。 以條數過濾:BPR 結構中 FVG 之間的最小/最大距離。 訊號的附加視覺化: 箭頭有 9 種類型可供選擇(標準、細、分形等)或手動輸入 Wingdings 代碼,其表格可以選擇性地顯示在圖表上。 設定顏色、尺寸及其縮放時相對於價格的動態
Liquidity Oscillator
Paolo Scopazzo
5 (1)
A powerful oscillator that provide Buy and Sell signals by calculating the investor liquidity. The more liquidity the more buy possibilities. The less liquidity the more sell possibilities. Please download the demo and run a backtest! HOW IT WORKS: The oscillator will put buy and sell arrow on the chart in runtime only . Top value is 95 to 100 -> Investors are ready to buy and you should follow. Bottom value is 5 to 0 -> Investors are ready to sell and you should follow. Alert + sound will appe
Sweet Apple Pro Max 2.1 - Long term profit Please read before using:  Gaining 30 40 50 even 100% profit within a day and then lose all, have you ever in that situation, or you ever saw someone still in that endless loop, x2 x3 profit then they have nothing. Hey my friend, stop thinking like that anymore, we will never be alive in this market if you are still thinking that you can become a millionaire quickly. Therefore, I am here to tell you these things We can not make profit con
Advance Entry Levels
Kundan Kumar Srivastava
Introducing Your Ultimate Trading Edge: Dynamic Support & Resistance, Advance Entry Levels Indicator for MT5 platform Unlock the power of precision trading with our cutting-edge Dynamic Support & Resistance Indicator. Designed to give traders unparalleled clarity, this indicator is your roadmap to identifying exactly where to buy and sell, maximizing your potential for consistent, sustainable profits. Why Choose Our Indicator? Crystal Clear Entry and Exit Points : No more guesswork. Our indicat
The key logic of SignalTech is generated by Artificial Intelligence. The machine learning module should continue optimizing the core logic on the server side to guarantee that SignalTech System can accurately track the market's movement.  SignalTech can generate AI based signals with Buy/Sell Arrows and Pop-Up/Sound Alerts. Each signal has clear Entry and stop Loss levels, which should be automatically flagged on the chart, as well as potential Targets 1, 2, and 3. SignalTech can work on EURU
Manyal trading system, CovEchoTrend Robot, focuses on reliability and flexibility. By employing statistical analysis methods to study the relationships between the base indicator and market patterns, the system enables a deeper understanding of market processes. Intelligent pattern analysis: The application of statistical data processing helps identify key trend reversal points more accurately, signaling significant market shifts. Informed decision-making is based on the intersection of indicato
Binary Options Assistant (BOA) BOIL Signals Indicator provides signals based on Ana Trader Binary Options Strategy. Indicators: Stochastic Stop missing trades, stop jumping from chart to chart looking for trade set-ups and get all the signals on 1 chart! U se any of the BOA Signals Indicator with the  Binary Options Assistant (BOA) Multi Currency Dashboard .  All BOA Signal Indicator settings are adjustable to give you more strategy combinations. The signals can be seen visually and heard audi
MT4 Version here: https://www.mql5.com/en/market/product/89114 For Deriv Synthetic indices MT5:  https://www.mql5.com/en/market/product/95814  Hello traders, I believe you all know that risk and money management along with psychology are the keys to success in trading. No matter how strong one’s strategy is, without these 3 criteria they will always face losses in the long run. I have created an EA to control our human behaviors. This EA will force us to be discipline exactly the way you will s
PipHarvestor EA
Jyotirmoy Sarkar
Introducing the Pip Harvestor Forex EA – your ultimate solution for seamless trading! The Pip Harvestor Forex EA is a state-of-the-art trading robot designed to elevate your trading experience. Powered by advanced algorithms, it identifies profitable trading opportunities with pinpoint accuracy, ensuring you stay ahead in the volatile forex market. Key Features: Automated Trading : Eliminate emotional trading. Our EA executes trades based on predefined strategies, ensuring discipline and consis
Free automatic Fibonacci is an indicator that automatically plots a Fibonacci retracement based on the number of bars you select on the BarsToScan setting in the indicator. The Fibonacci is automatically updated in real time as new highest and lowest values appears amongst the selected bars. You can select which level values to be displayed in the indicator settings. You can also select the color of the levels thus enabling the trader to be able to attach the indicator several times with differe
FREE
Pro Experience Only 4 copies available for $99.00. Next price 199 USD ECN Pro Experience is a scalping strategy based on breaking through strong price levels. One of the oldest and most reliable strategies with the author's modernization for the current market. The strategy does not require any optimizations. We installed it on the chart according to the recommendation and enjoy trading!!! Advantages of ECN Pro Experience: - optimal SL/TP ratio - low SL, which makes the system as safe as possi
QuantumAlert RSI Navigator is a free indicator available for MT4/MT5 platforms, its work is to provide "alerts" when the market is inside "overbought and oversold" regions in the form of "buy or sell" signals. This indicator comes with many customization options mentioned in the parameter section below, user can customise these parameters as needful. Join our MQL5 group , where we share important news and updates. You are also welcome to join our private channel as well, contact me for the priva
FREE
Advance Entry Levels Light
Kundan Kumar Srivastava
Introducing Your Ultimate Trading Edge:   Dynamic Support & Resistance, Advance Entry Levels Light Indicator for MT5 platform Unlock the power of precision trading with our cutting-edge Dynamic Support & Resistance Indicator. Designed to give traders unparalleled clarity, this indicator is your roadmap to identifying exactly where to buy and sell, maximizing your potential for consistent, sustainable profits. Why Choose Our Indicator? Crystal Clear Entry and Exit Points : No more guesswork. Our
KT COG Advanced MT5
KEENBASE SOFTWARE SOLUTIONS
KT COG is an advanced implementation of the center of gravity indicator presented by John F. Ehlers in the May 2002 edition of Technical Analysis of Stocks & Commodities magazine. It's a leading indicator which can be used to identify the potential reversal points with the minimum lag. The COG oscillator catches the price swings quite effectively. MT4 version of the same indicator is available here KT COG Advanced MT4 Calculation of COG The COG indicator is consist of the two lines. The main l
Receive notifications for multi-trendline or single trendline breakout. Yes! You heard us right!  You will be notified the moment price crosses any and all the timeframe trendlines that you have chosen.  1.    ADDING MULTIPLE OR SINGLE TRENDLINES IN THE SAME DIRECTION To trigger a stronger trading opportunity you can require that price breaks one or more trend lines of different timeframes in the same direction. To do this navigate to the timeframe for which you want to add a trendline and click
Trendline mt5 indicator
David Muriithi
3 (1)
Are you tired of drawing trendlines every time you're analyzing charts? Or perhaps you would like more consistency in your technical analysis. Then this is for you. This indicator will draw trend lines automatically when dropped on a chart. How it works Works similar to standard deviation channel found on mt4 and mt5. It has 2 parameters: 1. Starting Bar 2. Number of bars for calculation The   starting bar   is the bar which drawing of the trend lines will begin, while the   number of bars for c
FREE
Orbit Rage Final 2
BILLY ARANDUQUE ABCEDE
Note : i only sell this EA on MQL5, any other sellers is fake. Orbit Rage Final, a cutting-edge trading strategy meticulously designed around the bull/bear candle approach and divergence analysis. This powerful tool is engineered to empower you to shape the life you desire. To embark on this transformative journey, simply download and seamlessly integrate it into your MetaTrader 4 platform by placing it in the experts advisors folder. Orbit Rage Final revolutionizes trading by offering a risk-f
该产品的买家也购买
RelicusRoad Pro MT5
Relicus LLC
4.78 (18)
现在$ 147(更新后增加到$ 499) - 无限帐户(PC或Mac) RelicusRoad 用户手册 + 培训视频 + 访问 Private Discord Group + VIP 身份 一种看待市场的新方式 RelicusRoad 是世界上最强大的外汇、期货、加密货币、股票和指数交易指标,为交易者提供保持盈利所需的所有信息和工具。我们提供技术分析和交易计划,帮助每一位交易者取得成功,从初学者到高级。它是一个关键的交易指标,可以提供足够的信息来预测未来的市场。我们相信一个完整的解决方案,而不是图表上几个没有意义的不同指标。这是一个多合一指标,显示无与伦比且非常准确的信号、箭头 + 价格行为信息。 RelicusRoad 基于强大的人工智能,提供缺失的信息和工具来教育您并使您成为交易专家,成为成功的交易者。 几乎所有技术指标都滞后,这意味着它们只能报告已经发生的事情。因此,他们只确认您过去可以看到的价格已经在哪里。我们相信领先指标可以预测未来价格,而无需重新绘制,也不要过度依赖可能改变并导致重新绘制的滞后指标。如果您根据滞后指标进行交易并建立头寸,您就知道您已经大部分时间
FxaccurateLS
Shiv Raj Kumawat
WHY IS OUR FXACCCURATE LS MT5 THE PROFITABLE ? PROTECT YOUR CAPITAL WITH RISK MANAGEMENT Gives entry, stop and target levels from time to time. It finds Trading opportunities by analyzing what the price is doing during established trends. POWERFUL INDICATOR FOR A RELIABLE STRATEGIES We have made these indicators with a lot of years of hard work. It is made at a very advanced level. Established trends provide dozens of trading opportunities, but most trend indicators completely ignore them! The
[ MT4 Version ]  [ Order Blocks ]  [ Kill Zones ]  [ SMT Divergences ] How to trade using Order Blocks :  Click here User Interface Performance:  During testing in the strategy tester, the UI may experience lag. Rest assured, this issue is specific to the testing environment and does not affect the indicator's performance in live trading. Elevate your trading strategy with the  Order Blocks ICT Multi TF  indicator, a cutting-edge tool designed to enhance your trading decisions through advanced o
[ MT4 Version ]  [ Kill Zones ]  [ SMT Divergences ] How to trade using Order Blocks:  Click here User Interface Performance:  During testing in the strategy tester, the UI may experience lag. Rest assured, this issue is specific to the testing environment and does not affect the indicator's performance in live trading. Elevate your trading strategy with the  Order Blocks ICT Multi TF  indicator, a cutting-edge tool designed to enhance your trading decisions through advanced order block analysis
IQ Gold Gann Levels a non-repainting, precision tool designed exclusively for XAUUSD/Gold intraday trading. It uses W.D. Gann’s square root method to plot real-time support and resistance levels, helping traders spot high-probability entries with confidence and clarity. William Delbert Gann (W.D. Gann) was an exceptional market analyst, whose trading technique was based on a complex blend of mathematics, geometry, astrology, and ancient mathematics which proved to be extremely accurate. Download
AT Forex Indicator MT5
Marzena Maria Szmit
5 (5)
The AT Forex Indicator MT5 is a sophisticated trading tool designed to provide traders with a comprehensive analysis of multiple currency pairs. This powerful indicator simplifies the complex nature of the forex market, making it accessible for both novice and experienced traders. AT Forex Indicator uses advanced algorithms to detect trends, patterns and is an essential tool for traders aiming to enhance their forex trading performance. With its robust features, ease of use, and reliable signal
Naveen Dynamic Square MT5
Satya Prakash Mishra
The Naveen Dynamic Square  MT5  is one of the best known  technical analysis tools  inspired  by WD Gann along with the Gann Fan and Gann Box. It is considered a cornerstone of his trading technique that is based on time and price symmetry. The Naveen Dynamic Square MT5   is a powerful tool in finance for determining support and resistance levels based on a stock's extreme price points. It works by extrapolating probable price levels from a central value, typically an all-time or cyclical high o
可以说,这是您可以为MetaTrader平台找到的最完整的谐波价格形成自动识别指标。它检测19种不同的模式,像您一样认真对待斐波那契投影,显示潜在的反转区域(PRZ),并找到合适的止损和获利水平。 [ 安装指南 | 更新指南 | 故障排除 | 常见问题 | 所有产品 ] 它检测19种不同的谐波价格形态 它绘制了主要,衍生和互补的斐波那契投影(PRZ) 它评估过去的价格走势并显示每个过去的形态 该指标分析其自身的质量和性能 它显示合适的止损和获利水平 它使用突破来表明合适的交易 它在图表上绘制所有样式比率 它实现了电子邮件/声音/视觉警报 受斯科特·M·卡尼(Scott M. Carney)的书的启发,该指标旨在满足最纯粹和最熟练的交易者的需求。但是,它采取了一种使交易更容易的方式:在向交易发出信号之前,它会等待Donchian朝正确方向突破,从而使交易信号非常可靠。 斐波那契投影与向量无关 它实现了电子邮件/声音/推送警报 它绘制了ABCD投影 重要提示: 为了符合 Scott M. Carney先生 的商标申诉,某些图案名称已重命名为不言自明的替代方式, Scott M.
CBT Quantum Maverick 高效的二元期权交易系统 CBT Quantum Maverick 是一款精心设计的高性能二元期权交易系统,专为追求精准、简单和纪律的交易者打造。无需自定义,该系统经过优化,可直接使用并产生高效结果。只需遵循信号操作,稍加练习即可掌握。 主要特点: 信号精准度: 基于当前K线生成下根K线交易信号,无频繁重绘。 市场多样性: 专为二元期权交易设计,兼容多种经纪商和资产类别,适应不同交易偏好。 兼容性: Deriv Synthetic Charts :适用于任何时间框架。 OTC Charts :来自如 Quotex、PocketOption、Binomo、Stockity、IQOption、Exnova、OlympTrade、Deriv、Binolla 和 Homebroker 的经纪商,可导入 MT5(一周内提供免费导入支持,之后需支付服务费用)。 外汇、加密货币和商品市场 :扩展资产利用。 高收益二元资产 :建议使用90%以上的高回报率资产。 额外优势: 全面的交易计划: 提供系统化和纪律性交易的分步支持计划。 高效时间利用: 每天仅需一
MetaForecast M5
Vahidreza Heidar Gholami
5 (3)
MetaForecast能够根据价格数据中的谐波来预测和可视化任何市场的未来走势。虽然市场不总是可预测的,但如果价格中存在模式,MetaForecast可以尽可能准确地预测未来。与其他类似产品相比,MetaForecast通过分析市场趋势可以生成更精确的结果。 输入参数 Past size (过去的尺寸) 指定MetaForecast用于创建生成未来预测模型的柱数量。该模型以一条黄色线绘制在所选柱上。 Future size (未来的尺寸) 指定应预测的未来柱数量。预测的未来以粉色线表示,并在其上绘制了蓝色回归线。 Degree (程度) 此输入确定了MetaForecast将在市场上进行的分析级别。 Degree 描述  0 对于程度0,建议使用较大的值来设置“过去的尺寸”输入,以覆盖价格中的所有高峰、低谷和细节。  1 (建议的) 对于程度1,MetaForecast可以理解趋势,并通过较小的“过去的尺寸”生成更好的结果。  2 对于程度2,除了趋势,MetaForecast还可以识别反转点。对于大于1的程度,必须使用较高的“细节”和“噪音减少”输入值。  大于2 不建议使用大于
精密指数振荡器(Pi-Osc)由Precision Trading Systems的Roger Medcalf开发 版本2经过精心重新编码,以在您的图表上加载速度非常快,还加入了一些其他技术改进,以提高体验。 Pi-Osc旨在提供准确的交易定时信号,旨在找到极端的耗尽点,这些点是市场被迫去触及,以清理每个人的止损单。 该产品解决了一个古老的问题,即知道极端点在哪里,这使得交易员的生活变得更加简单。 这是一个高度复杂的共识指标,与行业标准的振荡器相比,具有一些强大的区别。 它使用的一些特征包括需求指数、资金流动、RSI、随机指标、模式识别、成交量分析、标准偏差极端点以及不同长度上述各种变化的分歧。 乍一看,对于未经培训的人来说,它似乎与任何其他振荡器没有什么不同,但当与其他振荡器(如RSI或动量等)相对比时,这个指标的真正威力开始显现。 据我所知,没有其他振荡器可以频繁地精确指出顶部和底部,具有相同的定期效率。 精密指数振荡器由许多不同的数学方程组成,用于测量多个时间框架采样中的价格和成交量变动,从而高度准确地预测趋势可能发生转折的位置。 PTS Pi-Osc V2非
The   Time_Price_SQ9_Degree   indicator is based on the 9 Gann square. Using this indicator, you can identify strong time and price zones. The indicator displays the levels as a degree value. The degrees can be set in the settings. After launching, the MENU button appears. If it is highlighted, it can be moved to any point on the graph, and after double-clicking on it, it stops being highlighted and menu buttons appear. To hide the menu, just double-click on the button, it will become highlight
描述 ICSM(脉冲-修正SCOB映射器)是一个分析价格走势并识别有效脉冲、修正和SCOB(单蜡烛订单块)的指标。它是一个强大的工具,可以与任何类型的技术分析一起使用,因为它灵活、信息丰富、易于使用,并且能显著提高交易者对最具流动性的兴趣区域的认识。 设置 常规 | 视觉 颜色主题 — 定义ICSM的颜色主题。 SCOB | 视觉 显示SCOB — 启用/禁用SCOB; 标记SCOB — 代表SCOB表示的样式选项列表; SCOB颜色 — 定义SCOB的颜色; ICM | 视觉 显示ICM线 — 启用/禁用ICM(脉冲-修正映射器)线; 显示IC趋势 — 通过图表底部的彩色分隔线启用/禁用脉冲-修正趋势的可视化; 线条颜色 — 定义ICM线的颜色; 线条样式 — 定义ICM线的样式; 警报 ICM — 启用/禁用突破ICM线的警报; SCOB — 启用/禁用SCOB创建的警报; ICM+SCOB — 启用/禁用在单个脉冲/修正结束时出现SCOB的警报,该SCOB抓取ICM线的流动性。 ICM+SCOB(同一蜡烛) — 启用/禁用在抓取ICM线流动性
TPA True Price Action indicator reveals the true price action of the market makers through 100% non-repainting signals strictly at the close of a candle! TPA shows entries and re-entries, every time the bulls are definitely stronger than the bears and vice versa. Not to confuse with red/green candles. The shift of power gets confirmed at the earliest stage and is ONE exit strategy of several. There are available now two free parts of the TPA User Guide for our customers. The first "The Basics"
Visual Heatmap Book Analyzer
Alexandre Moraes De Souza Lima
Visual Heatmap Book Analyser This indicator monitors the market liquidity and generates colors based on order patterns, quantities, and renewal activities in the book. This allows you to visualize the order flow and identify areas of high and low liquidity and activity. The indicator uses machine learning techniques to analyze the order behavior in the book, enabling it to detect patterns and trends in orders, allowing you to make informed decisions about your trading operations. The color pale
SMT Divergences MT5
Diego Arribas Lopez
MT4 Version SMT Divergences MT5 SMT Divergences is one of the most innovative indicators in the market. It offers the possibility of analyzing price divergences between 2 pairs. These divergences highlight and help to foresee what banks and institutions are planning to do. SMT divergences also provides you with a kill zones indicator and the possibility of filtering divergences occurring during these kill zones.  This indicator is specially powerful if applied in 2 highly correlated pairs. A pri
Pro Thunder V10 神经网络交易指标 | MT5二元期权 & OTC交易信号 用   Pro Thunder V10   提升您的二元期权交易水平!这款专为MetaTrader 5打造的人工智能交易指标,结合尖端的神经网络技术和多年的市场分析经验,能够在各种市场条件下(包括新闻行情、OTC市场、Deriv指数(Boom 300、Crash 500)等)提供无与伦比的精准信号。全球数千名交易者信赖Pro Thunder V10,享受实时、稳定的盈利信号! 核心功能   AI智能分析 :基于高级神经网络实时解析市场数据,为二元期权、OTC及指数交易提供高精度信号。   多平台兼容 :完美支持   Olymp Trade、IQ Option、Pocket Option、Binomo   及所有MT5经纪商(含OTC和Deriv指数)。   无重绘信号 :信号稳定不漂移,确保您的交易决策基于可靠数据。   全面覆盖交易品种 :优化适用于   AUDCAD、EURUSD、GBPJPY、USDCAD 、Deriv Boom/Crash等15+主流货币对。   实时
Reversal ALGO
Muhammad Abdullah Bhatti
Reversal Algo 是一款精心设计的技术指标,旨在帮助交易者识别市场趋势的潜在转折点。通过深入分析历史价格数据,它能够检测可能预示市场动能即将转变的重要高点和低点。该指标在您的图表上提供清晰且明确的视觉信号,使您能够精准定位趋势可能反转的关键区域。Reversal Algo 遵循严格的行业标准,提供客观且可靠的信息,而不做夸大的声明或保证。 主要特点 重要价格检测: Reversal Algo 系统地扫描历史价格数据,以识别标志潜在反转区域的显著峰值和谷值。它优先考虑统计上显著的水平,而非短暂的市场噪音,确保信号既有意义又可靠。 高级噪音过滤: 该指标采用复杂的波动性过滤器,最小化次要价格波动的影响。这种高级噪音过滤机制确保只有重要的价格运动会触发警报,从而减少误报的发生。 可定制参数: 通过广泛的可配置设置,交易者可以调整灵敏度和阈值水平,以根据特定的交易风格和市场条件定制该指标。无论您偏好保守的方法还是激进的策略,Reversal Algo 都可以根据您的个人需求进行微调。 稳健的数据分析: 通过检查广泛的历史价格数据,Reversal Algo 识别出重复的模式和关键水平
Offer 249 down from 350 for the next 1 copies. then back to 350 $ Are you tired of using outdated indicators that leave you guessing where to set your profit targets? Look no further than the AK CAP Opening Range Breakout Indicator. This powerful tool is backed by a US patent and has already helped countless traders pass funded challenges like FTMO. We use it daily on our prop traders and internal funds, and now it's available to you as well. The calculation behind the indicator is incredibly a
IQ FX Gann Levels a precision trading indicator based on W.D. Gann’s square root methods. It plots real-time, non-repainting support and resistance levels to help traders confidently spot intraday and scalping opportunities with high accuracy. William Delbert Gann (W.D. Gann) was an exceptional market analyst, whose trading technique was based on a complex blend of mathematics, geometry, astrology, and ancient mathematics which proved to be extremely accurate. Download the Metatrader 4 Version M
Introduction Excessive Momentum Indicator is the momentum indicator to measure the excessive momentum directly from raw price series. Hence, this is an extended price action and pattern trading. Excessive Momentum Indicator was originally developed by Young Ho Seo. This indicator demonstrates the concept of Equilibrium Fractal Wave and Practical Application at the same time. Excessive Momentum detects the market anomaly. Excessive momentum will give us a lot of clue about potential reversal and
PZ Trend Trading MT5
PZ TRADING SLU
3.8 (5)
许多盈利交易者不仅知道如何识别市场趋势,而且也能把握趋势建立后的交易机会。 Pz 趋势交易 指标设计用来在趋势行情中尽可能的赚取利润。 已建立的趋势提供了一揽子交易机会,但大多数趋势交易指标完全忽视了它们,让交易者在趋势行情时完全不知道该如何做!一般趋势指标只通知有关的趋势变化,但根本不足以得到卓越的回报. Pz 趋势交易 指标比一般趋势指标显示多达 20 倍的交易 , 因为它注重所谓的市场时机。它不仅显示当前的市场趋势,也有回调,内柱线的突破和调整。它令您在趋势回调之后介入,安全的柱线内突破金字塔加仓,以及发现潜在的反转,和已知的调整。 趋势改变 一个趋势改变在市场方向变化时发生。趋势变化在图表上用带数字的彩色圆圈显示。蓝色 (1) 信号为上涨开始, 而红色 (1) 信号为下跌开始。趋势变化并非评估当前价格动作的结果, 它意味着交易设置是不定时地。如果您正确使用本指标, 在趋势变化时, 您将将已经入场 (参看下面的调整)。 回调 但凡趋势在运动中,行情上下抖动,盈利者收割利润,且其它参与者入场。趋势回调代表好的买入机会,通常是由主力获利离场导致。如果行情在回调后回归上行, 指标将
Super Zone indicator
Dmitriy Sotnikov
5 (1)
Super Zone   For several years of observing the principles of the market, Super Zone worked, both then and now, because the indicator  allows you to see the trading range of the  week and even the month that major market participants use. It’s very easy to use, we work on H4 in the weekly range (  in the tester it doesn’t work in the demo mode  ) - we sell from the upper zones, we buy from the lower ones. It marks the zones from the beginning of the week (month) that are  not redrawn  , works on
Introduction! to the Indicator that Connects Trend , Pattern , and Candlestick Trigger  3 Steps in Under 30 Seconds ️ Trade effortlessly — no analysis required, Your smart assistant is ready to simplify your workflow No more chart overload Trade with confidence using smart bias detection Compatible with all currencies, crypto, stocks, metals, indices, and any timeframe Just click and execute — it’s that simple Ideal for busy traders who want speed and clarity. TPTSyncX is a powerfu
TrendMaestro5
Stefano Frisetti
note: this indicator is for METATRADER4, if you want the version for METATRADER5 this is the link:  https://www.mql5.com/it/market/product/108106 TRENDMAESTRO ver 2.4 TRENDMAESTRO recognizes a new TREND in the bud, he never makes mistakes. The certainty of identifying a new TREND is priceless. DESCRIPTION TRENDMAESTRO identifies a new TREND in the bud, this indicator examines the volatility, volumes and momentum to identify the moment in which there is an explosion of one or more of these data a
This indicator is based on the mathematics of the great trader W.D. Ganna. With its help, you can easily find strong levels by analyzing swings to find the optimal entry point. The indicator works on all instruments and all timeframes. The indicator is fully manual and has control buttons. All you need to do is press the NEW button, a segment will appear, which you can place on any movement, swing or even 1 candle that you want to analyze. By placing the segment, press the OK button. A grid (th
PZ Swing Trading MT5
PZ TRADING SLU
5 (5)
Swing Trading 是第一个旨在检测趋势方向的波动和可能的反转波动的指标。它使用在交易文献中广泛描述的基准摆动交易方法。该指标研究多个价格和时间向量,以追踪总体趋势方向,并检测市场超卖或超买并准备好进行修正的情况。 [ 安装指南 | 更新指南 | 故障排除 | 常见问题 | 所有产品 ] 市场波动的利润不会被窃取 指示器始终显示趋势方向 彩色价格带代表机会基准 彩色虚线表示可能的反转波动 该指标分析其自身的质量和性能 它实现了一个多时间仪表板 可定制的趋势和波动周期 它实现了电子邮件/声音/推送警报 指示器为非重涂或重涂 什么是摇摆交易 摇摆交易是一种尝试在一天到一周内从证券中获得收益的交易方式,尽管某些交易最终可以保持更长的寿命。摇摆交易者使用技术分析来买入弱点和卖出力量,并有耐心等待这些机会的发生,因为在发生一波抛售浪潮之后购买证券而不是陷入抛售更有意义。 机会基准 关于历史数据的大量研究证明,适合于波动交易的市场倾向于在基线价格带上下交易,基线价格带由图表显示,使用平均真实区间计算得出。波动交易者使用基线,该策略是购买常态和卖出躁狂,或做空常态并掩盖沮丧。在没有疲
Gann Zone Pro MT5
Kirill Borovskii
This indicator identifies and displays zones, as it were areas of strength, where the price will unfold. The indicator can work on any chart, any instrument, at any timeframe. The indicator has two modes. The indicator is equipped with a control panel with buttons for convenience and split into two modes. Manual mode: To work with manual mode, you need to press the NEW button, a segment will appear. This segment is stretched over the movement and the LVL button is pressed. The level is displayed
Introduction to X3 Chart Pattern Scanner X3 Cherart Pattern Scanner is the non-repainting and non-lagging indicator detecting X3 chart patterns including Harmonic pattern, Elliott Wave pattern, X3 patterns, and Japanese Candlestick patterns. Historical patterns match with signal patterns. Hence, you can readily develop the solid trading strategy in your chart. More importantly, this superb pattern scanner can detect the optimal pattern of its kind. In addition, you can switch on and off individu
Elliot Waves Analyzer Pro
Viktor Weidenthal
2.67 (3)
Elliot Waves Analyzer Pro calculates Elliot Waves to Help Identify Trend direction and Entry Levels. Mainly for Swing Trading Strategies. Usually one would open a Position in trend direction for Wave 3 or a Correction for Wave C . This Indicator draws Target Levels for the current and next wave. Most important Rules for Elliot Wave Analysis are verified by the Indicator.  The Pro version analyzes Multiple Timeframes and shows the Subwaves and Target-Levels.   For an Overview  " Elliot Waves Anal
作者的更多信息
This Scanner will help you to get Pivot points , Resistance and Support Points on the Symbols in your watchlist, using this and the best part is it give alert in all format whether its a e-mail, or Phone Notification alert, or Pop-up Alerts.  There are multiple points as : 1) Standard Pivot Points 2) Fibonacci Pivot points  3) Camarilla Pivot points  4) Woddie Pivot points. 5) Bollinger Bands. Type of Alerts are : 1) Cross Alert. 2) Near_Alert. 3) Cross and Bounce Alert. 4) Bounce only Alert.
This EA is specifically for Volatility and Step Index . which are famous as ( BOOM & CRASH markets) . This Ea have several inputs that i though should be talk upon ->   equity_profit_ = 20;   // Restart the EA after this $ profit   equity_loss_ = 20;    // Restart the EA after this $ Loss   EA_close_Minutes_dollor_profit = 0;   // This much minutes to stop EA after profit   EA_close_Minutes_dollor_loss = 0;  // This much minutes to stop EA after Loss  Buy_trade = true; Sell_trade = true; (T
This EA Can work on any pair and make grids .  Is consistent in working and make comfortable trades. This have SL and TP well defined and Approx amount you need to out a trade too. For any information you can contract the developer .  Please try once and let me know the reviews. this will show how many trades are Open for BUY and SELL at a time and How much PL you are at right now .   
筛选:
无评论
回复评论