HLC bar MT5 Wyckoff
- 指标
- Eduardo Da Costa Custodio Santos
- 版本: 1.0
- 激活: 20
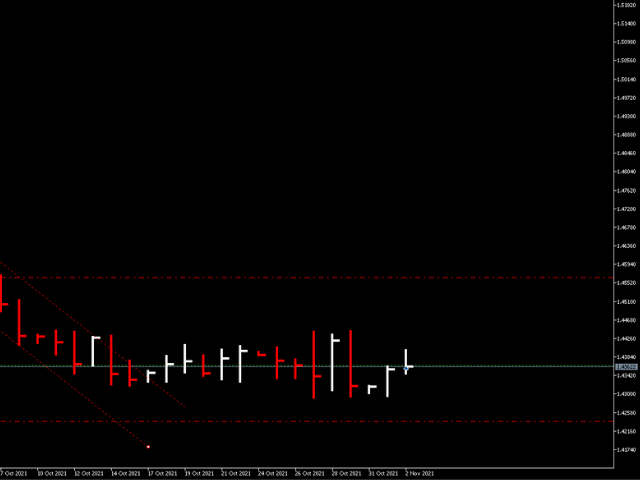
創建 MT5 的指標“HLC_bar_MT5 Wyckoff”是為了方便交易時的分析。
HLC Bar 由 Richard Wyckoff 使用,目前廣泛用於“VSA”操作。
Wyckoff 發現使用 High、Low 和 Close 使圖表更清晰、更易於分析。
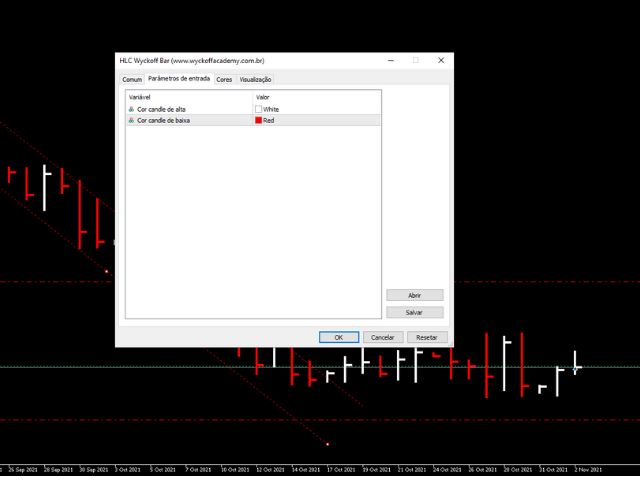
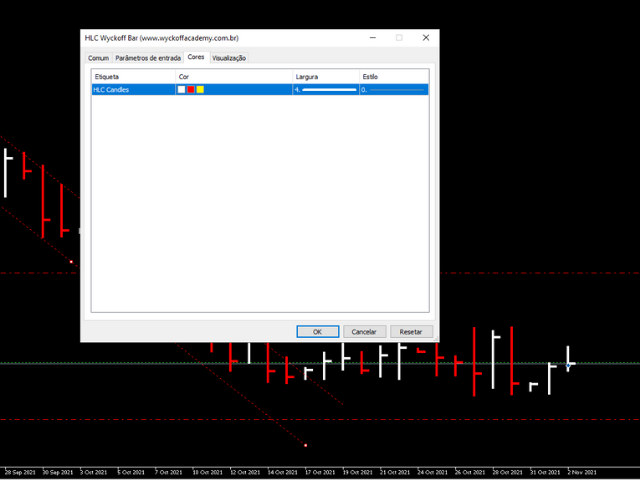
指標“HLC_bar_MT5 Wyckoff”允許:
# 改變條寬;
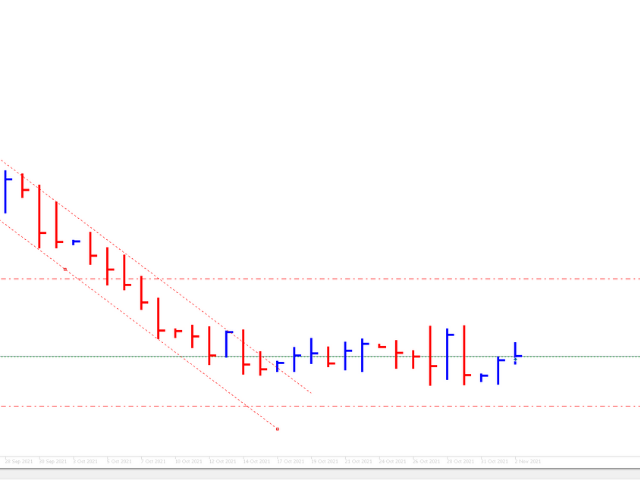
# 保持條形相同的顏色;
# 並突出顯示以相同價格開盤和收盤的柱。
顏色和寬度很容易在設置中修改
要使用該指標,只需將其拖到圖表上即可。
當與成交量一起使用時,威科夫將 HLC 圖表稱為條形圖。
他們試圖隱藏這些信息多年,但現在每個人都可以訪問這些信息,並可以使用此類圖表改進他們的操作。
HLC bar MT5 Wyckoff Chart 可用於任何市場和任何圖表時間,使操作員更加舒適。