• 概述
  • 评论 (1)
  • 评论 (5)
  • 新特性

Ichimoku Signal Scanner

4

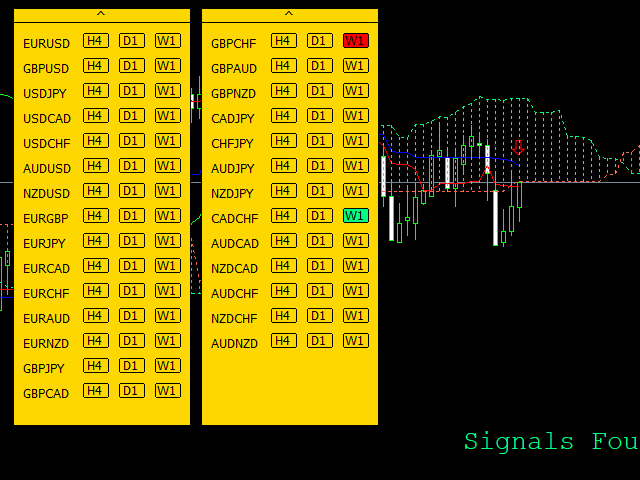
Ichimoku Signals Dashboard

To test the indicator please download demo version here.

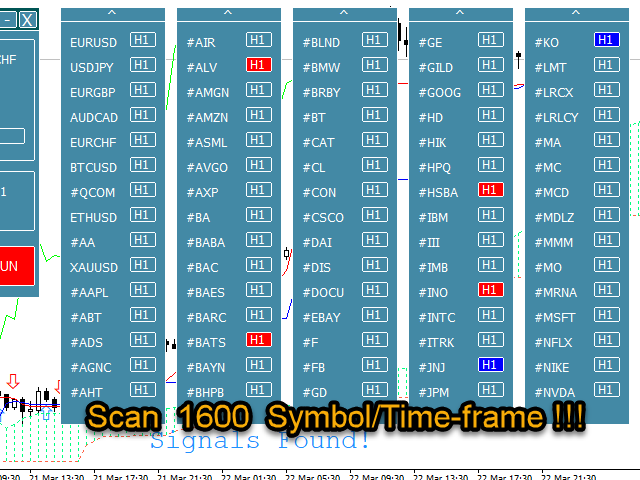
Find Ichimoku signals as easy as you can.

Ichimoku is one of the most powerful trends recognition indicators. And it has valid signals for the trades.

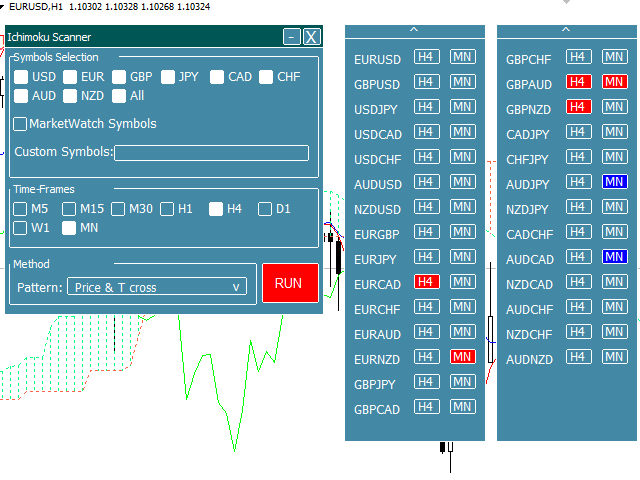
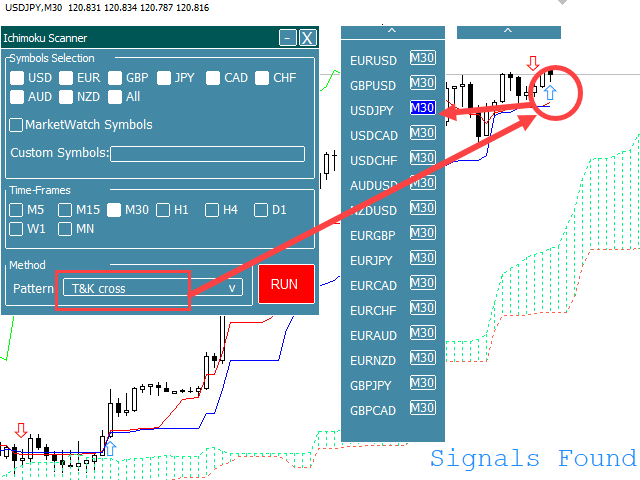
This indicator scans several symbols and time-frames by the Ichimoku to find all the signals that you want and show in a dashboard.

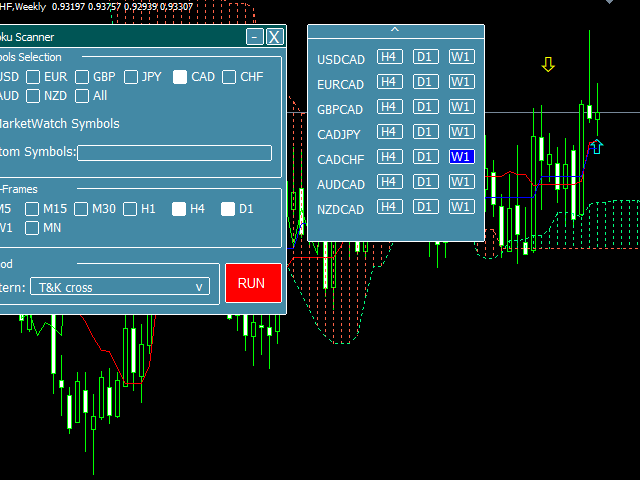
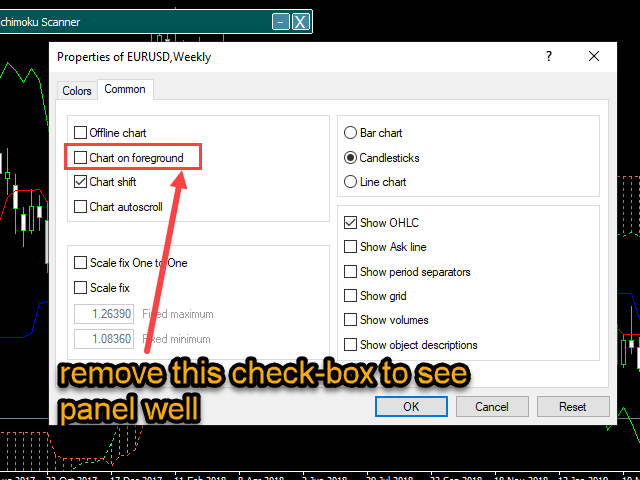
It's easy to use, just drag it onto the chart.

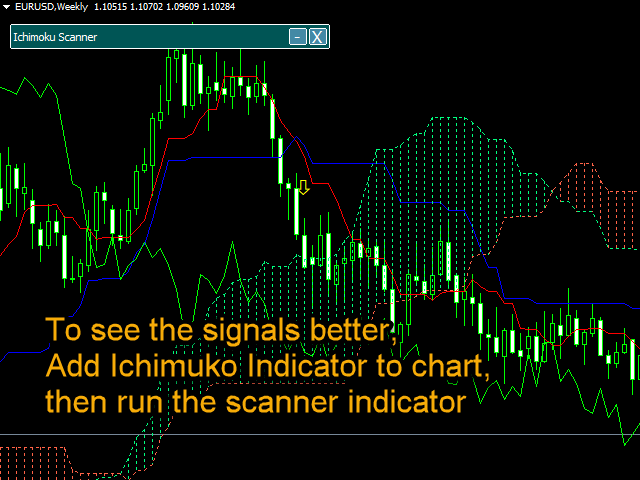
  • It's better to add Ichimoku indicator to chart before adding this indicator.

Ichimoku All Signals

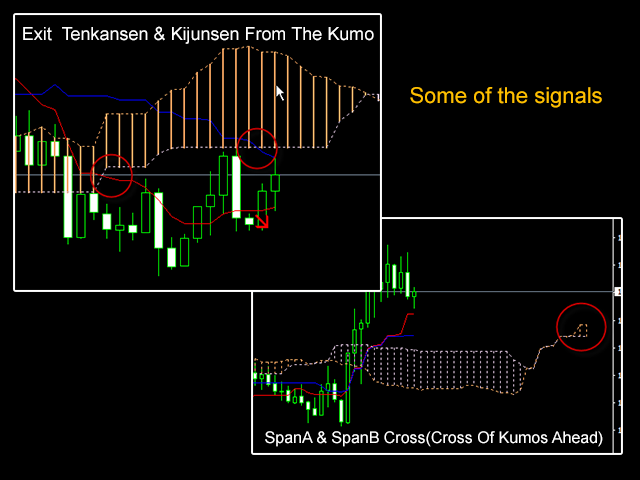
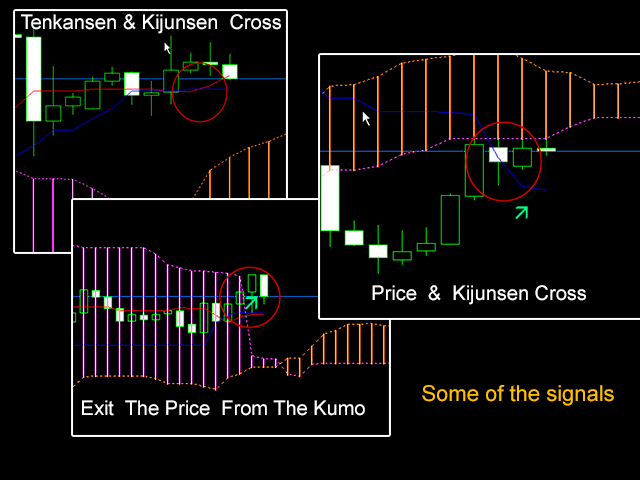
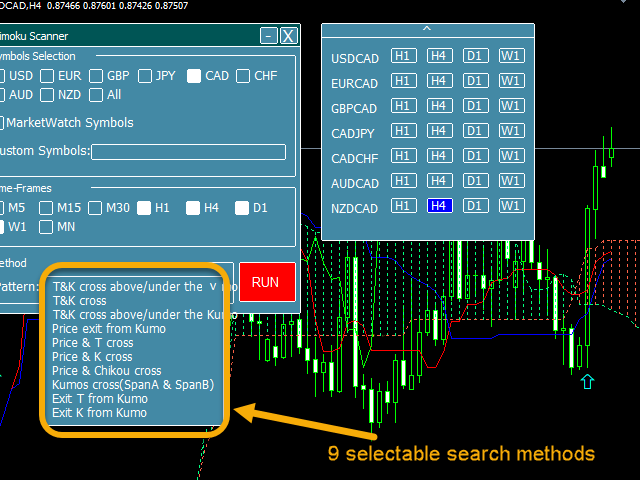
The indicator can detect 9 main Ichimoku signals. By push notification, you can quickly get notified when signals occur.

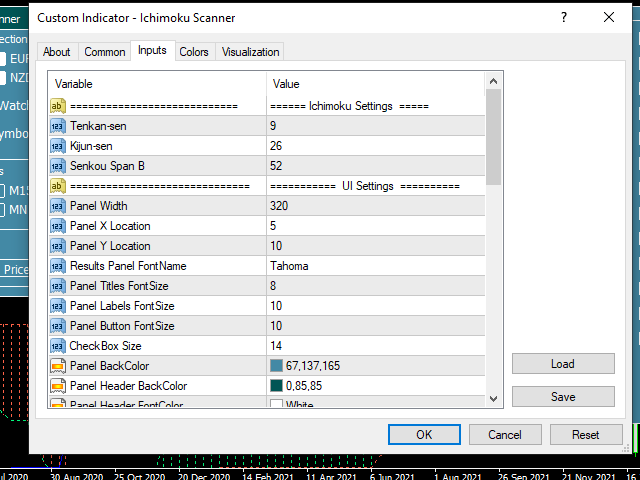
Indicator Parameters:

  • Symbols (separate them by the comma) -  Enter symbols and separate them by the  comma.
  • Timeframes (separate them by the comma) - Enter time-frames and separate them by the comma .
  • Signal Type:
    • Tenkansen & Kijunsen Cross
    • T & K cross Above/Under the Kumo
    • Exit the Price from the Kumo
    • Price & Tenkansen Cross
    • Price & Kijunsen Cross
    • Price & Chikou Cross
    • SpanA & SpanB Cross (Cross of Kumos Ahead)
    • Exit Tenkansen from the Kumo
    • Exit Kijunsen from the Kumo  
  • Colors Of Title of Rows & Columns - To change the color of the header of rows and columns.
  • Color Of Bull Signals
  • Color Of Bear Signals
  • Color Of No Signals
  • Color Of Descriptions
  • Font Name -  Indicator's Interface font.
  • Font Size
  • Sending Push Notifications - To send Push Notifications
  • Sending Push Notifications Period

Indicator Update:

The indicator will always be updated to improve the results and suggestions of users.

Good Luck.

评论 1
JACK_LE_CHAT
360
JACK_LE_CHAT 2023.03.17 02:39 
 

A simple tool to source opportunities falling into the category of Ichimoku trading without having to browse the entire market manually to find set-ups. Processing is a bit lengthy, the options are not many (only the basic Ichimoku configurations are covered without the possibility to combine them to achieve a multi-criteria search), and the dashboard is outdated, but this indicator is a good entry point to work out some strategies around Ichimoku. However, signals shall not be taken for granted and beginners shall bear in mind that the tool's effectiveness will directly depend on trading experience, additional filters and competent Money Management. Overall a not-too-expensive, good starting place, which shall be developed further to achieve higher grade performance against some of its direct competitors displaying more features and speed of execution.

推荐产品
This is a combination of multiple oscillators into a single divergence system that creates the impression of a more reliable divergence indicator. It is multi-currency based and works best on 15 minutes timeframe and above. Every time a signal is generated, it shows an alert to the user. It is more ideal if combined with other price action indicators or trading systems.
MACD Trend EA
Lachezar Krastev
4.5 (2)
MACD Trend EA is based on the popular forex indicator MACD (Moving Average Convergence Divergence). It is fully automated trading expert advisor and completely FREE!  As the name suggests, this expert advisor uses a trend-following strategy and uses the MACD indicator to detect the beginning of uptrends and downtrends. MACD Trend EA Top Features - Trend Following Strategy - Money Management - Advanced Exit System + TP and SL  - Trailing Stop System - Broker protection System - Custom Magic
FREE
Introducing the Consecutive Green/Red Candle Alert Indicator for MT4 - Your Trend Spotting Companion! Are you ready to take your trading to the next level? We present the Consecutive Green/Red Candle Alert Indicator, a powerful tool designed to help you spot trends and potential reversals with ease. Whether you're a new trader looking for clarity in the market or an experienced pro seeking additional confirmation, this indicator is your trusted companion. Key Features of the Consecutive Green/Re
FREE
The indicator detects and displays Shark harmonic pattern (see the screenshot). The pattern is plotted by the extreme values of the ZigZag indicator (included in the resources, no need to install). After detecting the pattern, the indicator notifies of that by a pop-up window, a mobile notification and an email. The indicator highlights the process of the pattern formation and not just the complete pattern. In the former case, it is displayed in the contour triangles. After the pattern is comple
Monalisa MACD
Valter Pegoraro
" MONALISA (acronym of MON itor A nd LIS t A ll) MACD" is an indicator based on the MACD Oscillator on all timeframes of any Currency Cross Pair. The indicator shows all Timeframes (from M1 to MN1) and colors in GREEN or RED that Timeframe that results in BUY or SELL based on the MACD Oscillator. This indicator is useful because it allows you to have a complete view of all Timeframes at the same time. Features Easy flexible settings: Detection of the MACD signal for all timeframes No setting l
VR Cub
Vladimir Pastushak
VR Cub 这是获得高质量切入点的指标。该指标的开发是为了促进数学计算并简化对仓位入场点的搜索。多年来,该指标所针对的交易策略已被证明其有效性。交易策略的简单性是其巨大的优势,即使是新手交易者也能成功进行交易。 VR Cub 计算开仓点以及获利和止损目标水平,这显着提高了效率和易用性。查看使用以下策略进行交易的屏幕截图,了解简单的交易规则。 设置、设置文件、演示版本、说明、问题解决,可以从以下位置获取 [博客] 您可以在以下位置阅读或撰写评论 [关联] 版本为 [MetaTrader 5] 计算入场点的规则 开仓 要计算入场点,您需要将 VR Cub 工具从最后一个高点拉伸到最后一个低点。 如果第一个点在时间上早于第二个点,交易者等待柱线收于中线上方。 如果第一个点在时间上晚于第二个点,交易者等待柱线收于中线下方。 根据上述条件,严格在 柱线收盘 后建仓。 换句话说,如果我们在小时图上进行交易,那么从最高点到最低点的时间距离必须超过24小时,最高点和最低点之间的点数必须大于或等于平均价格变动每天。 维持和改变市场地位 可以有多个未平仓头寸;每个头寸都可以单独修改。 VR Cu
基于具有标准参数的MACD指标波 在最后两个MACD波上分别对正面和负面交易斐波纳契水平, 如果负波浪在MACD指标上结束,则颜色为绿色, 如果正波在MACD指标上结束,那么颜色为红色。 Wave的终止标准是两个滴答,MACD的符号不同。 在最近四次MACD波浪中绘制趋势线。 与专家合作很好  Figures MACD   https://www.mql5.com/ru/market/product/42031 更多截图: https://www.mql5.com/ru/charts/10581596/audusd-h1-alpari-international https://www.mql5.com/ru/charts/10631979/usdjpy-m1-alpari-international https://www.mql5.com/ru/charts/10628704/gbpusd-m15-alpari-international
MACD Divergence MT4
KEENBASE SOFTWARE SOLUTIONS
KT MACD Divergence shows the regular and hidden divergences build between the price and oscillator. If your trading strategy anticipates the trend reversal, you can include the MACD regular divergence to speculate the potential turning points. And if your trading strategy based on the trend continuation, MACD hidden divergence would be a good fit. Limitations of KT MACD Divergence Using the macd divergence as a standalone entry signal can be a risky affair. Every divergence can't be interpr
This product is a part of  ON Trade Waves Patterns Harmonic Elliot Wolfe you can test free version on EURJPY from this link  Wolf Waves Indicator 探索 Wolf Waves - 您的终极交易工具! 您是否正在寻找一种强大的工具,能够轻松地在任何时间框架上识别 Wolf Waves?不用再找了!我们的 Wolf Waves 指标可以轻松完成这项任务。以下是为您呈现它的理由: 主要特点: 自动检测: 我们的 Wolf Waves 指标使用复杂的算法自动查找关键点并在您的图表上绘制相应的线条。不再需要手动搜索模式。 用户友好: 无论您是专业交易员还是对 Wolf Waves 还不熟悉,我们的指标都非常易于使用。 精准性: 它非常精确,降低了虚假信号的数量,提高了您的信心。 信息丰富: 该指标不仅限于模式检测。它还提供入场点、止损水平和利润目标等重要交易信息,帮助您做出明智的交易决策。 适用于 EA: 如果您进行自动化交易,此指标可以无缝集成
BeST Oscillators Collection EA is a Composite MT4 Expert Advisor that is based on the free corresponding BeST_Oscillators' Collection Indicator (that includes the Chaikin,Chande and TRIX Oscillators and has already with than 15000 downloads for MT4 and MT5) which can make trades according to it in a Reverse Mode  or not (as an Option) using in this 2nd Mode a smart Martingale based on the indicator’s Signals while it also applies Risk and Money Management features like Auto LotSize, SL,TP,BE,Tim
Expert MACD 4K
Wisam Oudah Radhi Al Musawi
It is a flexible and powerful MetaTrader expert advisor that trades with the MACD indicator and implements many useful features. The MACD base indicator is used for MetaTrader. It offers several customizable MACD trading scenarios and flexible position management settings, as well as many useful features such as customizable trading sessions. Trading only on EUR / USD. H4 _________________________________________________________________________________________ EUR / USD.   H4   Easy to use and
Introducing an indicator that creates signals! Triple Signal Finder displays signals on the chart according to the readings of indicators : from one to three simultaneously. You can use 3 indicators at once and the signals will be displayed when the signals of your indicators coincide !  You can include 3 indicators , which can be both standard and self-written . You will see the signals of your strategy on the chart and in the form of statistics . The number of signals and their success
RaysFX MACD Divergence Presentiamo RaysFX MACD Divergence, un indicatore di trading avanzato progettato per i trader moderni. Questo indicatore utilizza la divergenza MACD, uno dei metodi più affidabili nel mondo del trading, per fornirti segnali di trading precisi e tempestivi. Caratteristiche principali: Divergenza MACD: L’indicatore identifica e traccia le divergenze MACD, fornendo segnali di trading potenzialmente redditizi. Personalizzabile: Puoi personalizzare i parametri dell’EMA veloce
MACD Max
John Louis Fernando Diamante
A flexible 2-Line MACD indicator The default MACD indicator inside MT4, limits you to using the MACD with a fast-EMA, slow-EMA, and signal-SMA. This MACD indicator allows you to set your own MA-Method choices for these 3 components, separately! You can select from SMA-EMA-SMMA-LWMA-DEMA-TEMA, and can even use a separate method for each 3 fast-slow-signal periods. On-chart colored candles, with drawing condition types is included, with a show/hide button too. Features - MA Methods: SMA, EMA, S
RaysFX Supertrend Bar RaysFX Supertrend Bar è un indicatore personalizzato per MetaTrader 4. Utilizza l'indice di canale delle materie prime (CCI) per generare segnali di trading. L'indicatore mostra dei puntini in una finestra separata sotto il grafico principale per indicare i segnali di trading. Caratteristiche principali: Calcola il CCI per diversi periodi temporali. Visualizza puntini per indicare i segnali di trading. Permette all'utente di modificare i periodi temporali e la distanza tra
PZ Trend Trading
PZ TRADING SLU
4.8 (5)
许多盈利交易者不仅知道如何识别市场趋势,而且也能把握趋势建立后的交易机会。 Pz 趋势交易 指标设计用来在趋势行情中尽可能的赚取利润。 已建立的趋势提供了一揽子交易机会,但大多数趋势交易指标完全忽视了它们,让交易者在趋势行情时完全不知道该如何做!一般趋势指标只通知有关的趋势变化,但根本不足以得到卓越的回报. Pz 趋势交易 指标比一般趋势指标显示多达 20 倍的交易 , 因为它注重所谓的市场时机。它不仅显示当前的市场趋势,也有回调,内柱线的突破和调整。它令您在趋势回调之后介入,安全的柱线内突破金字塔加仓,以及发现潜在的反转,和已知的调整。 趋势改变 一个趋势改变在市场方向变化时发生。趋势变化在图表上用带数字的彩色圆圈显示。蓝色 (1) 信号为上涨开始, 而红色 (1) 信号为下跌开始。趋势变化并非评估当前价格动作的结果, 它意味着交易设置是不定时地。如果您正确使用本指标, 在趋势变化时, 您将将已经入场 (参看下面的调整)。 回调 但凡趋势在运动中,行情上下抖动,盈利者收割利润,且其它参与者入场。趋势回调代表好的买入机会,通常是由主力获利离场导致。如果行情在回调后回归上行, 指
Keltner Trend Pro - Unleash the Power of Price Action! Are you ready to transform your trading approach? Meet Keltner Trend Pro, an Expert Advisor meticulously crafted to harness the dynamic movements of the market using the renowned Keltner Channel and Average True Range (ATR) indicators. Limited-time Special Opportunity: Seize the moment! Be among the first 10 (Purchasing 0/10) to seize this unique opportunity, and not only will you acquire a top-tier trading algorithm but also enjoy an exclu
FREE
Trend MACD mw
DMITRII GRIDASOV
MT4 的 TREND MACD 指标 - 是伟大而高效的交易工具! 该指标对于专注于捕捉大幅价格变动的趋势交易者来说非常有用 趋势 MACD 由 3 条线组成:绿线 - 显示主要趋势方向,蓝色和洋红色线用于进场和出场。 指标允许利润最大化 - 不要过早退出有利可图的交易 指示器内置移动和 PC 警报 如何使用指示器(见图): 1) 检查蓝色和洋红色线是否都在绿色线上方。 2) 然后,一旦蓝线高于洋红色线 - 买入。 3) 一旦蓝线低于洋红色线,就退出交易。 4) 空头交易反之亦然。 // 这里提供更多优秀的 EA 交易和指标: https://www.mql5.com/en/users/def1380/seller // 也欢迎您加入盈利、稳定、可靠的信号 https://www.mql5.com/en/signals/1887493 它是仅在该 MQL5 网站上提供的原创产品。
Astin MT4
Novateq Pty. Ltd
Use Stochastic with oversold and overbought to find trading opportunities. Use RSI to identify strength of trend anf confirm the trend matches the stochastic overbought and oversold. Trade on MACD cross matching the trend identified by Stochastic and RSI. Set stop loss at a recent swing high or swing low. Set take profit as a ratio of stop loss. Exits are on take profit and stop loss only, there is no exit signal.
FREE
All in one divergence
Fatima Hosseini
5 (1)
Download the free version   here. Divergence Divergence refers to when the price of a currency pair moves in one direction while the trend indicator is moving in the opposite direction. With divergence, there can be positive and negative signals. Divergences in Forex trading are quite common signals of technical analysis. These are basic early Forex signals indicating the trend reversal and filter false signals. Application of this indicator It is usually not easy to detect divergences by the t
Ultimate Trend Finder (Multi Pair And Multi Time Frame) :   ---LIMITED TIME OFFER: NEXT 25 CLIENTS ONLY ---46% OFF REGULAR PRICE AND 2 FREE BONUSES ---SEE BELOW FOR FULL DETAILS Institutional traders use moving averages more than  any  other indicator. As moving averages offer a quick  and clear indication of the institutional order flow. And serve as a critical component in the decision making  within numerous institutional trading rooms. Viewing the market through the same lens as the i
Reversal Monster Mini
Abdulfattah Yahya Mohammed Alhazmi
The Most advanced and comprehensive EA to trade Trend Reversals/Pullbacks It is a very profitable EA, to trade trends breakout, and manage trades, takeprofit, stoploss, move to breakeven, and trailing stop. The   “Reversal Monster EA”   trades Reversal/Pullbacks when the current price of the pair pullback to a predefined horizontal level or trendline on the currency chart. The opening of the position can be immediate after pullback to the drawn trendline or after closing the candle below/abov
FREE
RSI TrendLine Divergency Message is an indicator for the MetaTrader 4 trading platform. Unlike the original indicator, this three in one version has a system of alerts that inform on market situation changes. It consists of the following signals: when the Main line crosses the levels of extreme zones and 50% level; when the Main line crosses the Trend line in the indicator window; divergence on the last bar. Parameters of levels of extremum, 50-level and divergence are adjustable. Parameters L
Осциллятор   Чайкина   ( Chaikin   Oscillator ) — это индикатор импульса, созданный Марком   Чайкиным , и, очевидно, индикатор назван в честь своего создателя. Он измеряет импульс линии распределения и накопления, используя формулу схождения-расхождения скользящих средних (MACD). На основе данных об этом импульсе мы можем получить представление о направленных изменениях в линии распределения и накопления.
MACDivergence MTF
Pavel Zamoshnikov
4.29 (7)
Advanced ideas of the popular MACD indicator: It detects and displays classic and reverse divergences (three methods of detecting divergences). It uses different color to highlight an uptrend and a downtrend. Two methods of determining a trend: а) MACD crosses the 0 level (classic signal); б) MACD crosses its own average (early signal). This is a multi-timeframe indicator: it can display MACD data from other timeframes. Two methods of drawing: classic histogram and line. It generates sound and v
Trend Helper
Siarhei Baranouski
The indicator should be used to confirm your trade system, it is not an independent thing for trading, you need to remember this. The indicator is as simple to use as possible and is based on the classic trend definition: 1. Each subsequent maximum is higher than the previous one for the uptrend. 2. Each subsequent low is lower than the previous one for a downtrend. 3. The trend changes when the last high / low breaks through. The indicator is MTF, i.e. if you are working on M30, you can cho
GTAS STrend
Riviera Systems
4 (4)
GTAS S-Trend is a momentum indicator that helps to determine trends using combination of MACD, RSI and moving averages. This indicator was created by Bernard Prats Desclaux, proprietary trader and ex-hedge fund manager, founder of E-Winvest. Description The indicator oscillates between -65 and +65 with a neutral zone between -25 and +25 around a 0 equilibrium line. S-Trend between -25 and +25 indicates congestion zones with a bullish bias between 0 and +25, and a bearish bias between 0 and -25
FREE
The Revolution Target Achiever FT -  Auto_Setting 1000 Points  Hi all Investors and traders, We've just updated this EA to a new version 3.0, which has a much more benefits , for Investors who want to run this EA 24 hours using vps can try the Auto_Setting to achieved 1000 Points or 10 %, for traders who have their own set up and target 1-100% can use the manual_setting, THE REVOLUTION Target Achiever is suitable for the investor who want to have a simple and ready to use Expert Advisor (EA). Th
Gecko
Profalgo Limited
4.4 (10)
NEW PROMO: Only a few copies copies available at 349$ Next price: 449$ Make sure to check out our " Ultimate EA combo package " in our   promo blog ! Gecko runs a simple, yet very effective, proven strategy.  It looks for important recent high and lows and will trade the breakouts.  The actual execution of this strategy however, is what makes this EA truly shine.  Entry calculations and exit algorithms are not only unique but also very advanced. LIVE RESULTS: https://www.mql5.com/en/signals/7
这种用于从无穷远衡量货币强弱的创新指标是长期交易的黄牛和交易者不可或缺的助手。 分析货币强弱的系统早已被世界领先的交易者所熟知并在市场上使用。 没有这种分析,任何套利交易都是不完整的。 我们的指标很容易确定基础货币相对于彼此的强弱。 它显示所有或当前货币对的折线图,允许即时分析和搜索最强的入口点。 该指标直观,允许您快速找到并切换到任何一对,具有可放置在地下室和主图表上的移动面板。 通知货币强度变化的计时器模式使交易者有机会在手机上收到通知。  使用货币功率计无穷大指示器的几种策略: 1. 使用货币强度的线性显示图表搜索交叉点作为新兴趋势的信号 2. 在趋势反转信号出现后,向强势货币方向反弹 3. 使用货币强度发散分析扭转当前趋势 4. 使用其他无限指标向强势货币方向交易 
FREE
该产品的买家也购买
Gann Made Easy
Oleg Rodin
4.93 (87)
Gann Made Easy 是一个专业且易于使用的外汇交易系统,它基于使用先生理论的最佳交易原则。 W.D.江恩。该指标提供准确的买入和卖出信号,包括止损和获利水平。您甚至可以使用推送通知在旅途中进行交易。 购买后请联系我!我将免费与您分享我的交易技巧和丰厚的红利指标! 您可能已经多次听说过江恩交易方法。通常 Gann 的理论不仅对于新手交易者而且对于那些已经有一定交易经验的人来说都是非常复杂的东西。这是因为江恩的交易方法在理论上并不那么容易应用。我花了几年时间来完善这些知识,并将最好的原则应用到我的外汇指标中。 该指标非常易于应用。您所需要的只是将其附加到您的图表并遵循简单的交易建议。该指标不断进行市场分析工作并寻找交易机会。当它检测到一个好的入口点时,它会为您提供一个箭头信号。该指标还显示止损和获利水平。 换句话说,当您像先生一样进行交易时,该指标会为您提供最佳江恩建议。江恩亲自告诉你此时此刻该做什么。但最好的部分是您不需要了解任何有关江恩交易原则的知识,因为该指标会为您完成整个市场分析工作。
Gold Stuff
Vasiliy Strukov
4.89 (263)
Gold Stuff 是专为黄金设计的趋势指标,也可用于任何金融工具。 该指标不会重绘,也不会滞后。 推荐时间框架 H1。 在它指标工作全自动专家顾问 EA Gold Stuff。 你可以在我的个人资料中找到它。 重要! 购买后立即与我联系,以获得说明和奖金!   您可以免费收到我们的强力支持和趋势扫描指标的副本,请私信。大部头书! 购买后立即联系我以获得设置和个人奖励!   设置 绘制箭头 - 打开关闭。 在图表上绘制箭头。 警报 - 打开关闭声音警报。 电子邮件通知 - 打开关闭。 电子邮件通知。 Puch-notification - 打开关闭。 推送通知。 接下来,调整色域。 Gold Stuff 是专为黄金设计的趋势指标,也可用于任何金融工具。 该指标不会重绘,也不会滞后。 推荐时间框架 H1。 在它指标工作全自动专家顾问 EA Gold Stuff。 你可以在我的个人资料中找到它。 购买后立即联系我以获得设置和个人奖励!   设置 绘制箭头 - 打开关闭。 在图表上绘制箭头。 警报 - 打开关闭声音警报。 电子邮件通知 - 打开关闭。 电子邮件通
Scalper Inside PRO
Alexey Minkov
4.75 (59)
An exclusive indicator that utilizes an innovative algorithm to swiftly and accurately determine the market trend. The indicator automatically calculates opening, closing, and profit levels, providing detailed trading statistics. With these features, you can choose the most appropriate trading instrument for the current market conditions. Additionally, you can easily integrate your own arrow indicators into Scalper Inside Pro to quickly evaluate their statistics and profitability. Scalper Inside
目前八折优惠! 对任何新手或专家交易者来说都是最好的解决方案! 这个仪表板软件适用于28种货币对。它基于我们的两个主要指标(高级货币强度28和高级货币冲动)。它对整个外汇市场提供了一个伟大的概述。它显示高级货币强度值,货币运动速度和28个外汇对在所有(9)时间段的信号。想象一下,当你可以使用图表上的单一指标观察整个市场,以确定趋势和或剥头皮的机会时,你的交易将得到改善 我们已经在这个指标中建立了一些功能,使你更容易识别强势和弱势货币,同时识别和确认潜在的交易。该指标以图形方式显示货币的强势或弱势是增加还是减少,以及它在所有时间段的表现。 增加的新功能是动态市场斐波那契水平,它适应当前的市场条件变化,这是一个已经在我们的高级货币强度28和高级货币冲动指标中使用的成熟的加分项。 在交易时,总是将弱势货币和强势货币配对,这个新指标将帮助你做到这一点。 用户手册:点击这里  https://www.mql5.com/en/blogs/post/708783 特点  显示每个时间段的ACS28和GAP-speed(冲动)的货币强度值。 列:颜色代码以7种颜色
TPSpro RFI Levels
Roman Podpora
4.86 (21)
Reversal First Impulse levels (RFI)    INSTRUCTIONS        RUS       -       ENG              R ecommended to use with an indicator   -   TPSpro  TREND PRO -  Version MT5 A key element in trading is zones or levels from which decisions to buy or sell a trading instrument are made. Despite attempts by major players to conceal their presence in the market, they inevitably leave traces. Our task was to learn how to identify these traces and interpret them correctly. Main functions: Displaying activ
AT Forex Indicator MT4
Marzena Maria Szmit
5 (2)
The AT Forex Indicator MT4 is a sophisticated trading tool designed to provide traders with a comprehensive analysis of multiple currency pairs. This   powerful indicator   simplifies the complex nature of the forex market, making it accessible for both novice and experienced traders. AT Forex Indicator uses   advanced algorithms   to detect trends, patterns and is an essential tool for traders aiming to enhance their forex trading performance. With its robust features, ease of use, and reliabl
TPSproTREND PrO
Roman Podpora
4.78 (18)
TPSpro TRENDPRO  - is a trend indicator that automatically analyzes the market and provides information about the trend and each of its changes, as well as giving signals for entering trades without redrawing! The indicator uses each candle, analyzing them separately. referring to different impulses - up or down impulse. Exact entry points into transactions for currencies, crypto, metals, stocks, indices!  -  Version MT5               DETAILED DESCRIPTION                R ecommended to use with
首先,值得强调的是,这个交易工具是非重绘、非重画和非滞后的指标,非常适合专业交易。 在线课程,用户手册和演示。 智能价格行动概念指标是一个非常强大的工具,既适用于新手,也适用于经验丰富的交易者。它将超过20个有用的指标合并到一个指标中,结合了高级交易思想,如内圈交易员分析和智能资金概念交易策略。该指标侧重于智能资金概念,提供有关大型机构交易方式的见解,帮助预测它们的动向。 它在流动性分析方面尤其擅长,有助于理解机构的交易方式。它擅长预测市场趋势,并仔细分析价格波动。通过将您的交易与机构策略对齐,您可以更准确地预测市场走向。该指标多才多艺,擅长分析市场结构,识别重要的订单区块,并识别各种模式。 它擅长识别BOS和CHoCH等模式,理解动量的转变,并突出显示供需强劲的关键区域。它还擅长发现强大的不平衡,并分析价格创造更高高点或更低低点的模式。如果您使用斐波那契回撤工具,该指标可以满足您的需求。它还可以识别相等的高点和低点,分析不同的时间框架,并通过仪表板显示数据。 对于使用更高级策略的交易者,该指标提供了工具,如公平价值差指标和优惠和折扣区域的识别。它特别关注高时间框架订单
FX Power MT4 NG
Daniel Stein
5 (11)
通过 mql5 和 Telegram 上 的晨间简报获取每日市场更新,包括详细信息和屏幕截图 ! FX Power MT4 NG 是我们长期以来非常受欢迎的货币强度计算器 FX Power 的下一代产品。 这款下一代强度计算器能提供什么?您所喜爱的原版 FX Power 的所有功能 附加功能 黄金/XAU 强度分析 更精确的计算结果 可单独配置的分析周期 可自定义计算限制,以获得更好的性能 为希望查看更多信息的用户提供特殊的多实例设置 无尽的图形设置,可在每个图表中设置您最喜欢的颜色 无数的通知选项,让您再也不会错过任何重要信息 采用 Windows 11 和 macOS 风格的全新圆角设计 神奇的移动指标面板 FX Power 主要功能 所有主要货币的完整强势历史 所有时间框架内的货币强弱历史 所有经纪商和图表的计算结果完全相同 100% 可靠的实时计算 -> 无重绘 可通过下拉列表选择分析时段 通过自定义模式单独配置分析时段 可在一个图表中使用多个实例 可移动 FX Power 显示屏(通过拖放) 适用于高分辨率 QHD、UHD 和 4K 显示器 自动终端配置 针对平板电脑
Trend Screener
STE S.S.COMPANY
4.83 (90)
趋势指标,趋势交易和过滤的突破性独特解决方案,所有重要趋势功能都内置在一个工具中! 它是 100% 非重绘多时间框架和多货币指标,可用于所有符号/工具:外汇、商品、加密货币、指数、股票。 趋势筛选器是有效的指标趋势跟踪指标,它在图表中提供带有点的箭头趋势信号。 趋势分析器指标中可用的功能: 1.趋势扫描仪。 2. 具有最大利润分析的趋势线。 3.趋势货币强度计。 4. 带有警报的趋势反转点。 5. 带有警报的强趋势点。 6. 趋势箭头 每日分析示例,每日信号表现...等与我们的趋势筛选指标,可以在这里找到: 点击这里 限时优惠:Trend Screener Indicator 仅售 50 美元且终身可用。原价 125$) 通过访问我们的 MQL5 博客,您可以找到我们所有的高级指标以及分析示例、每日信号表现...等。 : 点击这里 我们的趋势系统由 2 个指标组成: 1. Trend Screener Indicator:显示趋势仪表盘、图表中的趋势线、入场点...等。 2. Trend Line Map Indicator:显示买卖作为仪表板,活动信号盈利/亏损
Currency Strength Wizard
Oleg Rodin
4.91 (46)
货币强度向导是一个非常强大的指标,为您提供成功交易的一体化解决方案。该指标使用多个时间范围内所有货币的数据来计算这个或那个外汇对的力量。此数据以易于使用的货币指数和货币电力线的形式表示,您可以使用它们来查看这种或那种货币的力量。 您所需要的只是将指标附加到您要交易的图表上,该指标将向您显示您交易的货币的真实强度。该指标还向您显示买卖量压力的极值,您可以在顺势交易时利用这些压力。该指标还显示了基于斐波那契的可能目标。该指标可用于各种交易时间范围。该指标支持各种货币对的交易。 该指标为您提供所有类型的警报,包括推送通知。 购买后请联系我。我将与您分享我的交易技巧,并免费为您提供丰厚的红利指标! 祝您交易愉快,获利丰厚!
M1 Arrow
Oleg Rodin
5 (14)
M1 Arrow - 基于市场的两个基本原则的盘中策略。 该算法基于使用附加过滤器对交易量和价格波动的分析。该指标的智能算法仅在两个市场因素合二为一时才会发出信号。该指标使用较高时间框架的数据计算 M1 图表上某个范围的波浪。为了确认波浪,该指标使用了成交量分析。 从理论上讲,该指标可以与其他时间框架一起使用,但您需要考虑到该指标最初是为在 M1 上交易而开发的这一事实。 该指标是一个现成的交易系统。交易者所需要的只是跟随信号。此外,该指标可以成为您自己的交易系统的基础。交易仅在分钟图表上进行。 尽管指标使用 MTF 原理,但指标算法尽可能稳定。 购买后,一定要写信给我!我将与您分享我的交易设置和建议!祝您交易成功!感谢您的关注!
Indicator : RealValueIndicator Description : RealValueIndicator is a powerful tool designed specifically for trading on the EURUSD pair. This indicator analyzes all EUR and USD pairs, calculates their real currency strength values, and displays them as a single realistic value to give you a head start on price. This indicator will tell you moves before they happen if you use it right. RealValueIndicator allows you to get a quick and accurate overview of the EURUSD currency pair tops and bottoms,
Trend Punch
Mohamed Hassan
5 (16)
Manual guide:   Click here WEEK SALE PROMO:   $59 ONLY!  -- Next price is  $120 .  This indicator is unstoppable when combined with our other indicator called  Support & Resistance . After purchase, send us a message and you will get it   for  FREE as a BONUS! I like to use Trend Punch on XAUUSD on the M1 timeframe & higher ones!  Introducing Trend Punch , the revolutionary forex trend indicator that will transform the way you trade! Trend Punch is uniquely designed to provide pre
Atomic Analyst
Issam Kassas
5 (3)
首先值得强调的是,该交易指标是非重绘、非延迟的指标,这使其成为手动和机器人交易的理想选择。 用户手册:设置、输入和策略。 Atomic Analyst是一种PA价格行动指标,利用价格的力量和动量来寻找市场上更好的机会。配备了高级过滤器,可帮助去除噪音和假信号,并提高交易潜力。使用多层复杂的指标,Atomic Analyst扫描图表,并将复杂的数学计算转化为任何初学者都能理解并用来做出一致交易决策的简单信号和颜色。 “Atomic Analyst”是专为新手和经验丰富的交易者量身定制的综合交易解决方案。它将高级指标和一流功能融合为一体的交易策略,使其成为所有类型交易者的多功能选择。 日内交易和剥头皮策略:专为快速准确的日内交易和短期交易而设计。 日内和摆动交易策略:可用作追求价格大幅波动的日内和摆动交易者的可靠工具。 多货币和市场:凭借其可靠的精度,在不同的工具和市场上运作。 多个时间框架:可在多个时间框架上使用,性能良好。 稳定性:所有指标均不重绘、不重绘和不滞后,确保可靠的信号。 信号清晰度:提供箭头信号,用于清晰的入场和出场点。 实时警报:通过交易入场、SL和TP警报通知交
Advanced Currency Strength28 Indicator
Bernhard Schweigert
4.91 (665)
目前26%的折扣 任何新手或专家交易者的最佳解决方案! 这个指标是一个独特的、高质量的、可负担得起的交易工具,因为我们纳入了一些专有的功能和一个新的公式。只需一个图表,你就可以读出28个外汇对的货币强度!想象一下,你的交易将如何得到改善,因为你的交易是在你的手中进行的。想象一下,你的交易将如何改善,因为你能够准确地确定新趋势或剥头皮机会的触发点? 用户手册:点击这里  https://www.mql5.com/en/blogs/post/697384 这是第一本,原版的! 不要买一个毫无价值的崇拜者的克隆品。 特别的 子窗口中的箭头显示强劲的货币势头GAP将指导你的交易! 当基础货币或报价货币处于超卖/超买区域(外盘斐波那契水平)时,在个人图表的主窗口中出现警告信号。 当货币力量从外围区间回落时,回撤/反转警报。 十字星模式的特别警报 可选择多个时间框架,以快速查看趋势! 货币强度线在所有的时间框架中都非常平稳,当使用较高的时间框架来识别总体趋势,然后使用较短的时间框架来确定精确的入口时,效果非常好。你可以根据自己的意愿选择任何时间框架。每个时间框架都由其自身进
Quantum Trend Sniper Indicator MT4
Bogdan Ion Puscasu
4.6 (40)
介绍   量子趋势狙击指标 ,突破性的 MQL5 指标,正在改变您识别和交易趋势反转的方式!由拥有超过13年交易经验的资深交易员团队开发,     量子趋势狙击指标   旨在通过其创新的方式以极高的准确度识别趋势反转,将您的交易之旅推向新的高度。 ***购买量子趋势狙击指标,即可免费获得量子突破指标!*** 当量子突破指标识别出趋势反转时,它会向您发出警报和信号箭头,并建议您三个止盈水平。 它既适合新手交易者,也适合专业交易者。 量子 EA 通道:       点击这里 MT5版本:       点击这里 建议: 时间范围:  所有时间范围。为了获得最佳结果,我们建议在 M15、M30 和 H1 时间范围内使用它。 货币对:欧元兑美元、英镑兑美元、澳元兑美元、欧元兑英镑, EURAUD, XAUUSD 账户类型:ECN、Raw 或 Razor,点差极低 经纪时间:任意 经纪商:IC Markets、Pepperstone with Raw 和 Razor 的点差最低 建议止损:50 点 建议止盈水平:20 点、50 点和 1
Advanced Supply Demand
Bernhard Schweigert
4.92 (313)
现在优惠 33%! 任何新手或专业交易者的最佳解决方案! 该指标是一款独特、高质量、且价格合理的交易工具,因为我们已经整合了许多专有功能和新公式。 依据此更新,您将能够显示双重时间帧区域。 您不仅可以显示一个较高的时间帧,还可以同时显示图表时间帧,加上更高的时间帧:显示嵌套时区。 供需双方所有交易者都会喜欢它。 :) 重要信息披露 高级供需的最大潜力,请访问 https://www.mql5.com/zh/blogs/post/720245   想象您的交易如何得以改善,是因为您能够精准定位入场或目标位吗? 构建于新的底层算法,它可以更轻松地识别出买卖双方之间的潜在失衡。 这是因为它以图形方式展示供需最强劲区域,及其过去的表现(显示旧区域)。 这些功能旨在帮助您更轻松地发现最佳入场区域和价位。 现在您可以针对您的交易品种和时间帧来优化和编辑区域强度! 高级供需指标适用于所有产品和时间帧。 它是一个新的公式,非常新的功能是两个区域强度函数可由用户输入进行调整! 这在交易中是一大优势。 当您学习如何使用专有功能,例如带有价格游离最小 X 因子的区域强度时,您能够判断该区域强劲与否。 供
TrendMaestro
Stefano Frisetti
5 (3)
note: this indicator is for METATRADER4, if you want the version for METATRADER5 this is the link:  https://www.mql5.com/it/market/product/108106 TRENDMAESTRO ver 2.4 TRENDMAESTRO recognizes a new TREND in the bud, he never makes mistakes. The certainty of identifying a new TREND is priceless. DESCRIPTION TRENDMAESTRO identifies a new TREND in the bud, this indicator examines the volatility, volumes and momentum to identify the moment in which there is an explosion of one or more of these data a
Market Swing Index MSI
Elias Mtwenge
5 (1)
JULY OFFER 80% OFF next price for unlimited version will be 17000$. This is the only time you can get this institutional and professional indicator at this price for unlimited version. Don't dare to miss this. The tool I am about to introduce to you you can't compare it with other tools due to its strategy and accuracy level in predicting the next price directional movement . This tool is designed for serious traders who have decided to make a difference through trading. Be the next person to wi
Quantum Breakout Indicator PRO
Bogdan Ion Puscasu
4.96 (26)
介绍     Quantum Breakout PRO   ,突破性的 MQL5 指标,正在改变您交易突破区域的方式!   Quantum Breakout PRO 由拥有超过 13 年交易经验的经验丰富的交易者团队开发,旨在通过其创新和动态的突破区域策略将您的交易之旅推向新的高度。 量子突破指标将为您提供带有 5 个利润目标区域的突破区域的信号箭头,以及基于突破框的止损建议。 它既适合新手交易者,也适合专业交易者。 量子 EA 通道:       点击这里 MT5版本:   点击这里 重要的!购买后请私信我领取安装手册。 建议: 时间范围:M15 货币对:GBPJPY、EURJPY、USDJPY、NZDUSD、XAUUSD 账户类型:ECN、Raw 或 Razor,点差极低 经纪商时间:GMT +3 经纪商:IC Markets、Pepperstone with Raw 和 Razor 的点差最低 规格: 不重漆! 最多 5 个建议利润目标区域 建议止损水平 可定制的盒子。您可以设置自己的 Box Time Start 和 Box Time E
Enigmera
Ivan Stefanov
5 (4)
ENIGMERA:市场核心 https://www.enigmera.com 简介 该指标和交易系统是金融市场的一种非凡方法。ENIGMERA 利用分形周期精确计算支撑位和阻力位。它能显示真实的累积阶段,并给出方向和目标。 该系统无论在趋势中还是在修正中都能发挥作用。 它是如何运行的? ENIGMERA 由三条线组成:支撑/阻力线、目标线和偏离线。与一般市场指标将过去的数据推断为现在和未来的情况不同,该系统能提供当前的完整情况。如果你处于支撑位,这意味着真正的支撑;如果你处于阻力位,这意味着真正的阻力。如果突破某一水平,则表示趋势发生变化。没有重绘。 由于市场在不断变化,ENIGMERA 不断调整其评估工具,定期修改策略。  这保证了每种情况都能得到全面评估。这一市场指标的独特性显而易见,其能力不言而喻。  ENIGMERA 为金融分析师和咨询师提供服务,他们需要可靠的见解与客户分享,也为投资者提供服务,他们需要最精确和最可靠的保证。 该系统能够达到最佳精度,使交易者能够自信、清晰地评估他们的选择。 ENIGMERA 将 20 年的交易专长和知识整合到一个综合软件
ADR Reversal Indicator
LEE SAMSON
4.27 (15)
ADR 反轉指標一目了然地顯示當前價格相對於其正常平均每日範圍的交易位置。當價格超過您選擇的平均範圍和高於它的水平時,您將通過彈出窗口、電子郵件或推送獲得即時警報,以便您可以快速跳入回調和反轉。該指標在圖表上在平均每日範圍極值處繪製水平線,並在這些水平之上延伸,這些水平附加了價格超過它們的數學概率。下面的更多細節...... ADR 警報儀表板補充指標並監控所有配對也可在此處獲得: https://www.mql5.com/en/market/product/62756 MT5 版本也可在此處獲得: https://www.mql5.com/en/market/product/64477/ 大約 60% 的時間價格在其正常的平均每日範圍 (ADR) 內交易並推高這些水平通常是價格急劇波動的指標,通常會出現回調(獲利了結)走勢。您可以通過交易從每日範圍的頂部或底部回落到最近的支撐位或阻力位來利用這些急劇波動。 收集了超過 20 年的歷史數據,以找出主要外匯對和一系列交叉盤的價格超出特定 ADR 水平的平均百分比。該數據表明價格僅在 3% 的時間內超過其 ADR 的 20
Cycle Sniper
Elmira Memish
4.41 (37)
NEW YEAR SALE PRICE FOR LIMITED TIME!!! Please contact us after your purchase and we will send you the complimentary indicators to complete the system Cycle Sniper is not a holy grail but when you use it in a system which is explained in the videos, you will feel the difference. If you are not willing to focus on the charts designed with Cycle Sniper and other free tools we provide, we recommend not buying this indicator. We recommend watching the videos about the indiactor and system before pu
TrendDecoder Premium
Christophe Pa Trouillas
5 (6)
确定范围和下一步可能的走势   |  获得早期信号和趋势强度   |  在反转之前获得明确的退出   |  了解价格将测试哪些斐波水平 非重绘、非延迟指标 - 手动和自动交易的理想选择 - 适用于所有资产和所有时间单位 限时优惠 >>   50% OFF 购买后,  请联系我的频道  获取推荐设置 MT5   版本: 点击此处 使用   BladeSCALPER   和   PowerZONES   获取我们的完整方法 它是什么? TrendDECODER 集多种创新于一身,使趋势监测变得简单易行。 投射趋势线(Projective TrendLine)--快速参考即将到来的趋势 实时趋势线(RealTime TrendLine)与投射趋势线(Projective TrendLine)的对比 - 与之前的同方向走势相比,市场是加速还是放缓? 实时趋势线交叉 - 趋势正在偏离轨道 使用 GreyBox - 市场不再是趋势并进入新的过渡序列 使用 DecoderSignals 和 Blue/Orange Clouds - 利用作为动态支撑/阻力的 Blue/Orange
Trend Line Map Pro
STE S.S.COMPANY
4.73 (15)
趋势线图指标是趋势筛选器指标的插件。它用作趋势筛选器(趋势线信号)生成的所有信号的扫描仪。 它是基于趋势筛选器指标的趋势线扫描仪。如果您没有 Trend Screener Pro Indicator ,Trend Line Map Pro 将无法使用。 通过访问我们的 MQL5 博客,您可以下载趋势线图指标的免费版本。购买前试用,不受 Metatrader Tester 限制。 :    点击这里 1. 容易获得的优势 根据货币和时间范围显示买入和卖出信号。 评估自图表中出现箭头以来价格上涨或下跌的点数。 (趋势筛选指标箭头) 显示信号的时序。 获取多时间范围和多货币警报以购买和出售警报。 2. 如何使用趋势线图 如何显示买卖信号仪表板? 如果您有任何问题或需要帮助,请通过私信联系我。 作者 SAYADI ACHREF,金融科技软件工程师,Finansya 创始人。
Advanced Currency IMPULSE with ALERT
Bernhard Schweigert
4.91 (495)
目前31%的折扣!! 对任何新手或专家交易者来说都是最好的解决方案! 这个指标是一个独特的、高质量的、负担得起的交易工具,因为我们已经纳入了一些专有的功能和一个秘密的公式。只需一张图表,它就能给出所有28种货币对的警报。想象一下,你的交易将如何改善,因为你能够准确地确定新趋势或剥头皮机会的触发点 建立在新的基础算法上,它使识别和确认潜在交易变得更加容易。这是因为它以图形方式显示了一种货币的强势或弱势是否正在加速,并测量了这种加速的速度--把它想象成你汽车中的速度表。当你加速时,事情显然会发生得更快,这在外汇市场上也是一样的,即如果你配对的货币正在向相反的方向加速,你就会发现一个潜在的有利可图的交易。 货币动量的垂直线和箭头将指导你的交易! 动态的市场斐波那契23水平被用作警报触发器,将适应市场活动。如果冲动触及黄色触发线,您将在MetaTrader或您的电子邮件或推送警报中收到警报。然后你就知道作为一个交易员应该做什么。货币对和方向已经给出。只要点击警报按钮,就可以切换到该货币对或打开一个新的图表,以便进一步分析。警报级别可以通过用户输入来改变,可以选择3个敏感度级别
FX Volume
Daniel Stein
4.61 (36)
通过 mql5 和 Telegram 上 的 " 晨间简报 "获取每日市场更新,包括详细信息和屏幕截图 ! 外汇交易量(FX Volume)是第一个也是唯一一个从经纪商角度真正洞察市场情绪的交易量指标。 直接在您的图表上看到这些信息是真正改变游戏规则和突破性的交易解决方案。 受益于独特的市场数据洞察,如 比率(Ratios )显示货币多头和空头头寸的比率(百分比 比率变化 显示所选时间段内的多头比率及其百分比变化 总交易量 显示货币的总交易量(多头和空头),以手为单位 多头 交易量显示货币所有多头头寸的交易量 空头 交易量显示所有货币空头头寸的交易量 净多头 显示净多头交易量,即所有多头头寸减去所有空头头寸(以手为单位)。 净多头百分比 显示货币净多头交易量的变化 请阅读我们的基本教程 -> "如何使用外汇交易量进行交易 " 获取更多信息,如常见问题、交易技巧和教程视频,请访问我们的 外汇交易量公共信息频道 请 安装并运行 SI Connect 以建立与我们数据中心的持续连接 背景信息 我们都知道,外汇是一个分散的市场。这就是为什么我们必须打破常规思维,开发一个独
TakePropips Donchian Trend Pro
Eric John Pajarillaga Aldana
4.61 (18)
TakePropips Donchian Trend Pro   (MT4) 是一款功能强大且有效的工具,可使用 Donchian 通道自动检测趋势方向,并为您提供进场和退场交易信号! 这个多功能指标包括趋势扫描器、交易信号、统计面板、筛选器、交易时段和警报历史仪表板。它旨在为您提供交易信号并节省您分析图表的时间! 您可以在我们的博文中下载用户手册和安装指南:   https   :// www.mql5.com/en/blogs/post/751368 今天立减 50%!价格从 98 美元降到 49 美元! 您可以在 Strategy Tester 上测试该指标(启用可视模式) 视频教程也可在说明下方获得更多详细信息。 如果您有任何问题或需要任何帮助,请与我联系。 TakePropips Donchian Trend Pro 指标适用于所有外汇对、金属、商品、指数和加密货币。 主要特点 交易信号 - 检测多个时间范围内所有货币对的买卖机会。它将为您提供警报并在图表上绘制交易信号,最多 3 个止盈价和一个止损价。 Trend Scanner   - 用于快速扫描和识别跨多个时间
ICT, SMC, SMART MONEY CONCEPTS, SMART MONEY, Smart Money Concept, Support and Resistance, Trend Analysis, Price Action, Market Structure, Order Blocks, BOS/CHoCH,   Breaker Blocks ,  Momentum Shift,   Supply&Demand Zone/Order Blocks , Strong Imbalance, HH/LL/HL/LH,    Fair Value Gap, FVG,  Premium  &   Discount   Zones, Fibonacci Retracement, OTE, Buy Side Liquidity, Sell Side Liquidity, BSL/SSL Taken, Equal Highs & Lows, MTF Dashboard, Multiple Time Frame, BigBar, HTF OB, HTF Market Structure, 
作者的更多信息
Greedy Red
Mihails Babuskins
4.46 (28)
Contact me after payment to send you the user manual PDF file See the real monitoring signal in my profile. Real monitoring signals: Signal 1 Greedy Red is an Expert Advisor is designed based on Volume Profile FR . Volume Profile FR  calculates volume in price levels (typical volume indicator shows only candle volumes). With the volume of price levels, you can identify important areas that have the potential to reverse. You can also see the volume of support and resistance levels and decide on
Greedy Purple
Mihails Babuskins
5 (2)
Contact me after payment to send you the user manual PDF file See the real monitoring signal in my profile. Real monitoring signals: Signal 1 Greedy Purple is an Expert Advisor is designed based on Ichimoku kinko hyo . Ichimoku is a trend detection indicator, the robot detects support and resistance levels by the Ichimoku indicator and trades based on it. Greedy Purple’s algorithmalso  uses divergence   to open trades and manage them with Ichimoku. You can download the  Divergence  Indicator 
Greedy Green MT4
Mihails Babuskins
4.8 (82)
Contact me after payment to send you the user manual PDF file See the real monitoring signal in my profile. Real monitoring signals: Signal 1 Full Automated trading robot, for the first time on the market, an Expert Advisor is designed based on Volume Profile FR . Volume Profile FR  calculates volume in price levels (typical volume indicator shows only candle volumes). With the volume of price levels, you can identify important areas that have the potential to reverse. You can also see the volu
FREE
Quasimodo Pattern QM MT4
Mihails Babuskins
4.33 (45)
Contact me after payment to send you the User-Manual PDF File. ADVANCE PRICE ACTION TRADING CONCEPT. To test the indicator, you can download the demo version on my product list. it’s free (only shows patterns that have occurred in the past of the market). Quasimodo is  a reversal trading pattern  that appears at the end of an uptrend. As a price formation, the Quasimodo pattern is depicted by three peaks and two valleys, where: First, the middle peak is the highest, while the outside two peaks
Greedy Golden MT4
Mihails Babuskins
Important: Please use in accounts with lower swap or swap-free accounts. Real monitoring signals: Signal 1 Contact me after payment to send you the user manual PDF file See the real monitoring signal in my profile. Use only on gold and on the  BUY direction. Trading gold is attractive to many traders due to the high volatility and depth of the market. Should we invest in gold or just scalp it? Answering this question is a big challenge for many traders. X trading robot is the answer to this cha
Volume Profile MT5
Mihails Babuskins
5 (3)
Contact me after payment to send you the User-Manual PDF File. Volume Profile Indicator A functional and useful tool that can improve your trading plan. This indicator calculates volume in price levels(typical volume indicator shows only candle volumes). With the volume of price levels, you can identify important areas that have the potential to reverse. You can also see the volume of support and resistance levels and decide on them. Using volume profiles along with   Price Action   and  
Contact me after payment to send you the user manual PDF file. Introduction Introducing the Wolfe Pattern Indicator, a powerful tool designed to help traders identify and capitalize on the elusive Wolfe Pattern in financial markets. This innovative indicator uses advanced algorithms to scan for the Wolfe Pattern in all symbols and time frames, providing traders with a unique edge in the market. How to trade with the Wolfe Pattern The Wolf Pattern is a rare and lucrative trading opportunity that
Calculator of Lot Size
Mihails Babuskins
4.7 (20)
Calculation of Lot Size for many traders is a big challenge. A case that is very important in money management. What many traders ignore. Choosing an appropriate Lot Size in trades can improve results and it will ultimately lead to success. This indicator calculates the authorized Lot Size for your trades. The indicator uses the following values to get the appropriate Lot Size for positioning: The distance of Stop Loss. The Pip Value. The amount of Risk Allowed For Each Trade. T
FREE
Triangle Pattern Indicator MT4
Mihails Babuskins
4.75 (4)
Contact me after payment to send you the User-Manual PDF File. Triangle Pattern Sometimes the price cannot make higher highs or lower lows and it moves in a converging price range and waves are shorter than before until the movement creates a geometric shape of a symmetrical triangle, which indicates It is maybe the end of the trend. The triangle pattern is a well-known in forex and the trading plan and strategy of many traders is based on it. The Triangle Pattern Scanner Indicator It is
Advance 123 Pattern Scanner
Mihails Babuskins
3.91 (11)
Contact me after payment to send you the User-Manual PDF File. How To Test You can test the indicator by free version, to get the free version please contact me   (  the free version scans charts in W1 and MN1 time-frames )  it's free. 123 Pattern Breakout Trend is your friend, trade along the trend, but how do we identify trends? Sometimes the simplest methods have the best results. Pattern 123 is based on the breakout important price levels, when the price is trying to break the previou
See my other products here. One Click Order This product helps you to send your order as quickly and easily as possible. Send your order as fast as possible: Just set your position parameter values(Price, TP, SL, Ex Date) with just a few simple mouse drags. On the other hand, the calculation of the losses and profits value before ordering is always a big challenge for traders; This expert is very useful in taking a position and calculating the amount of the stop loss/the take profit(in the curr
FREE
Greedy Blue EA
Mihails Babuskins
Contact me after payment to send you the user manual PDF file See the real monitoring signal in my profile. Real monitoring signals: Signal 1 Full Automated trading robot, for the first time on the market, an Expert Advisor is designed based on  123 Breakout indicator . Breakout scanner   uses Fibonacci percentage to get PRZ(Price Reversal Zone)and opens trades. The Greedy Blue also uses   Volume Profile FR   to manage trades.  With the Volume of Profile the EA can identify important areas that
RSI Divergence Full
Mihails Babuskins
4.65 (37)
RSI Divergence Full   +10 other divergence indicators Contact me after payment to send you the User-Manual PDF File. Download the MT5 version here. Also you can download the >>>  Hybrid Trading EA  <<< that is designed and implemented based on RSI Divergence Indicator. RSI is a pretty useful indicator in itself but it's even more effective when you trade divergence patterns with that. Because the divergence signal of the RSI indicator is one of the most powerful signals among the indicators. D
Contact me after payment  to send you the  User-Manual PDF  File. Volume Profile Indicator A functional and useful tool that can improve your trading plan. This indicator calculates volume in price levels(typical volume indicator shows only candle volumes). With the volume of price levels, you can identify important areas that have the potential to reverse. You can also see the volume of support and resistance levels and decide on them. Using volume profiles along with   Price Action   and
Contact me after payment to send you the user manual PDF file. Monitoring the EA in real time: Signal 1 Full Automated trading robot, for the first time on the market, an Expert Advisor is designed based on divergence. Using divergences is one of the most common and practical trading methods. Because we see a divergence in most places where there is potential for price return. Diagnosis and trading based on them has a higher efficiency than many methods based on static indicators. You can down
Harmonic Pattern Dashboard
Mihails Babuskins
5 (5)
harmonic patterns   Harmonic patterns can be used to spot new trading opportunities and pricing trends – but only if you know exactly what you are looking for. Harmonic patterns are formed by combining geometric shapes and Fibonacci levels. As a result, Fibonacci levels are the key concept of these patterns. Identifying harmonic patterns requires more practice than other market classical patterns. But by learning these patterns, you can recognize the future trend of the price chart. These patter
RSI Signals Scanner
Mihails Babuskins
4.8 (5)
RSI Signal Scanner The primary trend of the stock or asset is an important tool in making sure the indicator's readings are properly understood. For example, some of the technical analysts, have promoted the idea that an oversold reading on the RSI in an uptrend is likely much higher than 30%, and an overbought reading on the RSI during a downtrend is much lower than the 70% level. This indicator notifies you of RSI important levels breakouts (30% and 70%) by searching among the symbols and chec
FREE
Contact me after payment to send you the User-Manual PDF File. Double Top/Bottom Pattern Double top and bottom patterns are chart patterns that occur when the underlying investment moves in a similar pattern to the letter "W" (double bottom) or "M" (double top). Double top and bottom analysis are used in technical analysis to explain movements in a security or other investment, and can be used as part of a trading strategy to exploit recurring patterns. Searching for this pattern among the c
Candle Time indicator
Mihails Babuskins
5 (2)
Sometimes a trader needs to know when a candle will close and a new one appears to make the right decisions, this indicator calculates and displays the remaining of current candle time . It is simple to use, just drag it on the chart. Please use and express your opinion, expressing your opinions will promote the products. To see other free products, please  visit  my page.  
FREE
MACD Divergence Full
Mihails Babuskins
5 (4)
Contact me after payment to send you the User-Manual PDF File. Divergence detection indicator with a special algorithm. Using divergences is very common in trading strategies. But finding opportunities for trading with the eyes is very difficult and sometimes we lose those opportunities. The indicator finds all the regular and hidden divergences. (RD & HD) It uses an advanced method to specify divergence. This indicator is very functional and can greatly improve the outcome of your trading. Thi
MACD Signals Dashboard
Mihails Babuskins
4 (4)
Download directly the indicator file here. (if you can't open on MT4) MACD Indicator is one of the most popular momentum indicators among users. Searching and detecting MACD signals by the eye may not be easy. Scan Full Charts Dashboard Indicator with simple user interface and search customization panel saves time and scans all charts for MACD signals search and notifies the user with high accuracy. After finding the signal, the user was aware of the result by alerts and notifications. This ind
FREE
Contact me after payment to send you the user manual PDF file. Introduction The moving average indicator is the most well-known and one of the most popular indicators among traders. It is very simple to work with, but a basic question has always become a big challenge among traders: What is the most optimal setting of the moving average for each chart-time frame? The answer to this question is very difficult, you have to try different settings of the moving average indicator for different chart
This utility manage your position risk by trailing stop with "Parabolic SAR" indicator value. Indicator Parameters SAR step(Parabolic SAR step value) SAR maximum(Parabolic SAR maximum value) Timeframes(Choose timeframes). Stop Place(put SL in current(open) candle or last close candle). Is the spread considered?(Set SL with considering to Spread or not, the choice is with you). Working with this utility is very simple, Just drag it onto the chart. There is no problem with multi-part trades. It is
FREE
Waves Follower
Mihails Babuskins
5 (1)
Contact me after payment to send you the User-Manual PDF File. This indicator gives a signal when the probability of starting a trend is high. To calculate entry points, it uses a combination of some indicators like "Moving Average", "ADX", RSI with support and resistance points. This indicator is a trend follower and it doesn't determine that TP because it is not necessary, it uses the stop-loss trailing system (Of course, the indicator determines the SL, but you have to move it yourself becau
Currency Strength Gauge incicator The currency strength gauge is an indicator to measure of the strength or weakness of currencies in the Forex market. Comparing the strength of currencies in a graphic representation will lead to a good overview of the market and its future trends. You will see in a graphic chart both the strength of the currencies and their correlation, and this will help you in your decisions to get better trades.   -To easy detection of over Overbought and Oversold point
Harmonic Patterns Scanner MT4
Mihails Babuskins
5 (3)
Contact me after payment to send you the User-Manual PDF File. Harmonic Trading The secret is the Fibonacci. It has been proven in the markets that price always reacts to Fibonacci levels. Fibonacci levels are one of the most important indicators of price changes. Sometimes the sequence of reactions to these levels in the chart make geometric shapes, which are called harmonic patterns. The price creates harmonic patterns with its fluctuation and reaction to Fibonacci levels. Harmonic patterns c
Pattern 5W Scanner
Mihails Babuskins
4.4 (10)
Contact me after payment to send you the User-Manual PDF File. 5W Pattern  introduction The 5W pattern occurs when the price forms an alternating 5-wave cycle with its volatility. In fact, the 5W  pattern is a price series of alternating HH or LL (higher high or lower low), which is the main characteristic of a trend. The pattern of 5W should have the characteristic of non-overlapping waves, also the points of the pattern are usually formed in Fibonacci levels. The completed pattern of 5W actua
Contact me after payment to send you the user manual PDF file. Download the MT4 version here. Unlocking Trading Insights Dive into the heart of market dynamics with Advance Divergence Scanner designed for traders seeking a competitive edge. The Divergence Indicator is your key to identifying crucial divergences across various charts, empowering you to make informed decisions in the dynamic world of financial markets. The Divergence A Divergence signals a potential reversal point because directi
筛选:
JACK_LE_CHAT
360
JACK_LE_CHAT 2023.03.17 02:39 
 

A simple tool to source opportunities falling into the category of Ichimoku trading without having to browse the entire market manually to find set-ups. Processing is a bit lengthy, the options are not many (only the basic Ichimoku configurations are covered without the possibility to combine them to achieve a multi-criteria search), and the dashboard is outdated, but this indicator is a good entry point to work out some strategies around Ichimoku. However, signals shall not be taken for granted and beginners shall bear in mind that the tool's effectiveness will directly depend on trading experience, additional filters and competent Money Management. Overall a not-too-expensive, good starting place, which shall be developed further to achieve higher grade performance against some of its direct competitors displaying more features and speed of execution.

回复评论
版本 1.3 2024.05.28
Some changes were made.
版本 1.2 2022.03.22
The user interface changed.