Extremum Average
- 指标
- Victor Golovkov
- 版本: 2.0
- 更新: 20 十月 2021
- 激活: 10
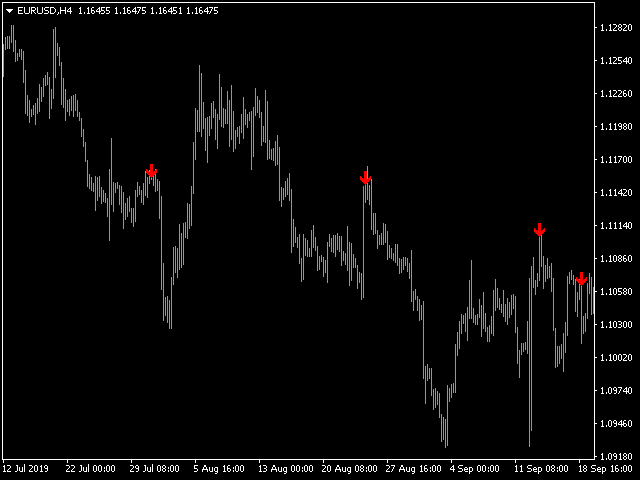
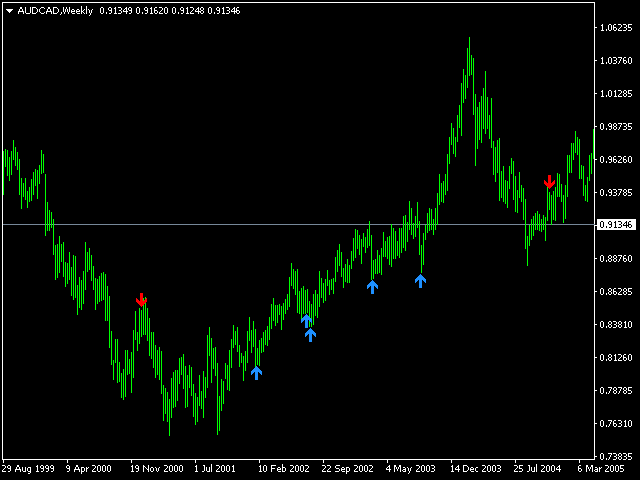
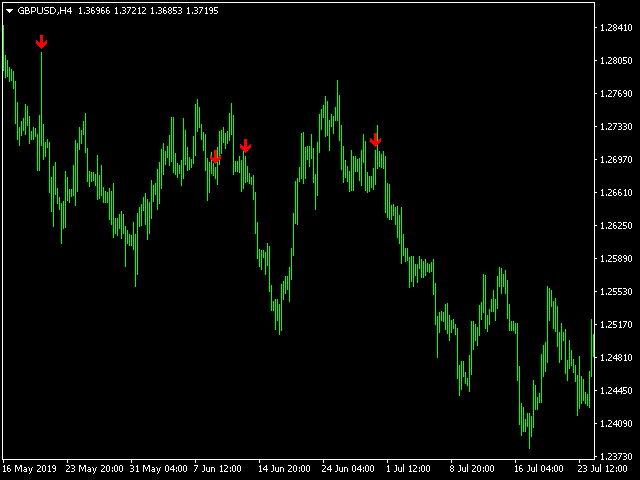
The Extremum Average signal indicator works on all timeframes and any markets.
Analyzes the smoothed data of extremums and gives signals to sell or buy.
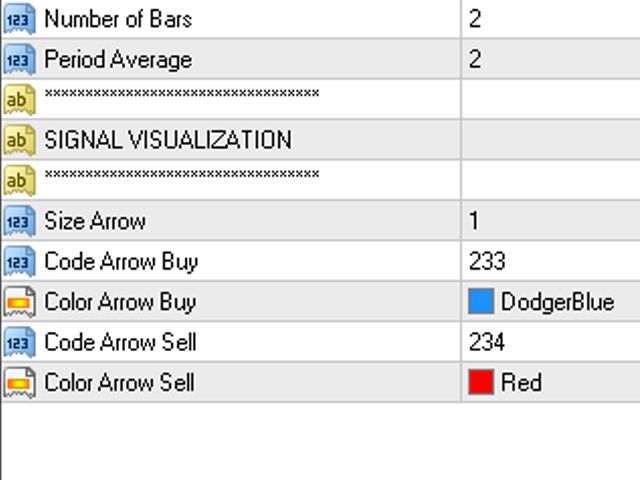
The indicator has only two settings:
- Number of Bars - the number of last bars to search for an extremum
- Period Average - Period (number of last bars) for data smoothing
For each timeframe and market, you need to select its own values.
Additionally, in the indicator settings, you can set your own style of signal display:
- Size Arrow
- Code Arrow Buy
- Color Arrow Buy
- Code Arrow Sell
- Color Arrow Sell
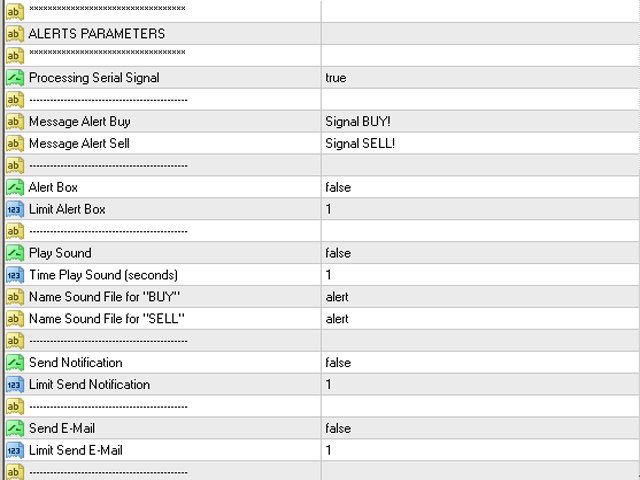
The indicator is equipped with a section for setting and sending alerts
- Processing Serial Signal - if "true", then alerts are processed on each successive signal
- Message Alert Buy - message text when a buy signal is triggered
- Message Alert Sell - text of the message when a sell signal is triggered
- Alert Box - enable / disable Alert box (pop-up window)
- Limit Alert Box - the number of Alert Box repetitions
- Play Sound - enable / disable sound playback
- Time Play Sound (seconds) - time in seconds during which the sound signal will repeat
- Name Sound File for "BUY" - the name of the sound file for purchase
- Name Sound File for "SELL" - the name of the sound file for sale
- Send Notification - enable / disable sending PUSH notifications
- Limit Send Notification - the number of notifications per signal
- Send E-Mail - enable / disable sending messages to e-mail
- Limit Send E-Mail - the number of messages per signal
The indicator is not redrawn.