Infrared Mode
- 指标
- IT MARKT LTD
- 版本: 2.2
- 更新: 16 十一月 2021
- 激活: 5
UPDATE 3 - Scan what you see - the indicator will scan and draw levels for all VISIBLE bars on the chart, rather than Current Bar - till first visible bar on the chart (historical bar on the left side). Assumption is, if you are going back in history and you want to check levels, you care about that specific moment in time and what the levels were during that moment (excluding data of the future which is not visible).
UPDATE 2 - version 2.1 introduces the "Always ON" feature. If enabled, you can switch time frames while the InfraredMode indicator will remain switched ON with levels being visible on the chart all the time.
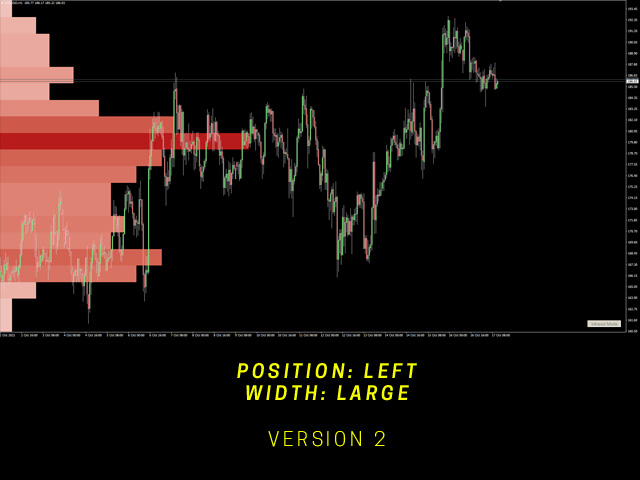
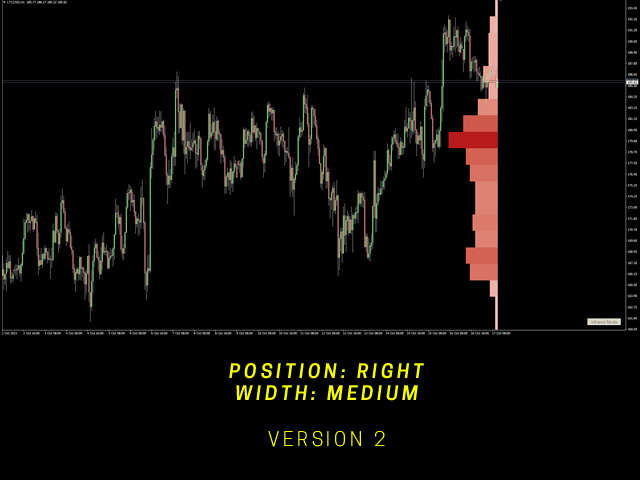
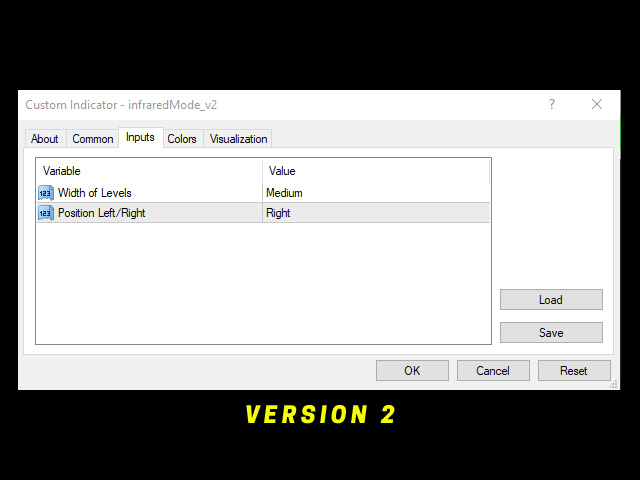
UPDATE - version 2 introduces a few more features that allow customization.
It all starts with level and ends with levels. Being able to identify key Support and Resistance zones is crucial to your success.
WHAT IT DOES?
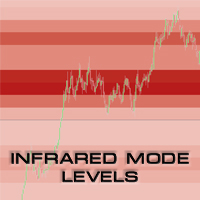
The Infrared Mode indicator finds the zones on the chart, where most of the orders took place. Real zones formed by real orders/volume. Those levels are natural support/resistances.
FEATURES
- Different colors (light red to dark red) show you where the zones of interest are (darkest color). This is usually where the price tends to bounce.
- Automatic adjustment. Simply zoom in or zoom out and the indicator will calculate the zones for the visible part of the chart.
HOW TO USE IT?
- Implement it in any trading strategy/method.
- Buy above the darkest zones
- Sell below the darkest zones
- If there are multiple zones - you can trade in between them.
It is pretty straightforward. If you have any question, please use the comment section.
