Harmonic Finder
- 指标
- Ezinne Judith Orji
- 版本: 3.2
- 激活: 5
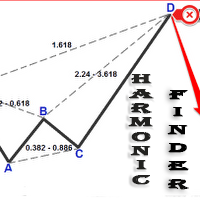
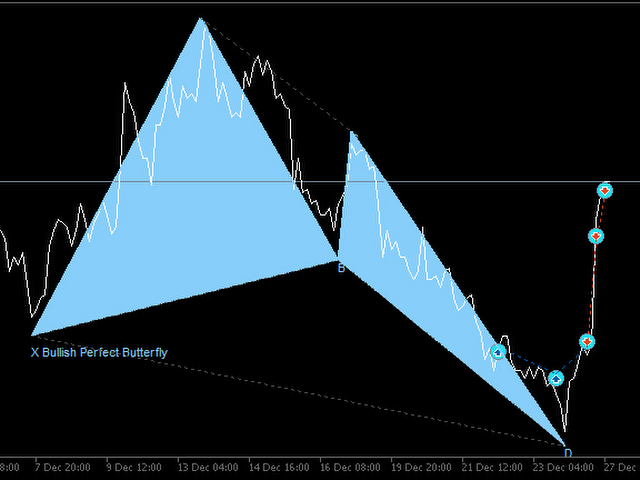
Automatically finding harmonic patterns has been made easy for traders.
For those who do not know harmonic patterns : it is a method of technical analysis based on Fibonacci ratios in the markets and patterns made of these. Kind of like patterns such as triangles and double tops, but with precise measurements which makes computerized measuring tools especially appealing for trading these patterns.
Some highlights from this Indicator include:
- Efforts to reduce the amount of screen clutter through adjustable means of selecting what should be displayed.
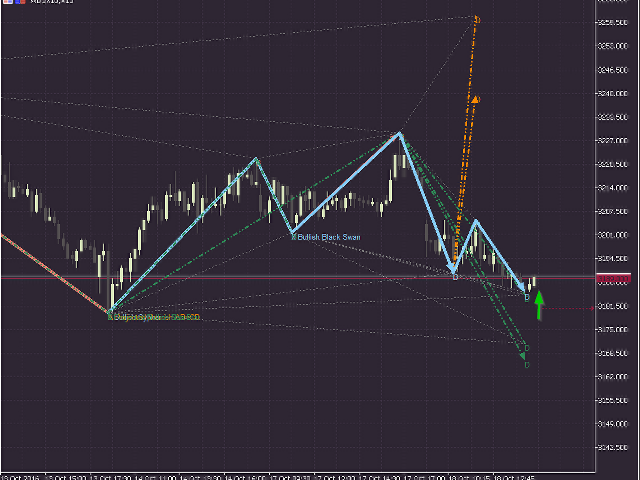
- Double clicking any part of a pattern will now highlight it along with detailed analytical information like harmonic reversal ratios and temporal aspects.
- Multiple zigzag selection has been dropped in favor of a single embedded one. This means that no one should face installation issues as long as all files are placed in the same folder.
- Collection of statistical information makes it possible to see how well a pattern has performed in the past.
- The ratios for "anti-patterns" should now be correct.
SCREEN CLUTTER REDUCTION
Apart from the interactivity features, one can in the settings choose if the indicator should:
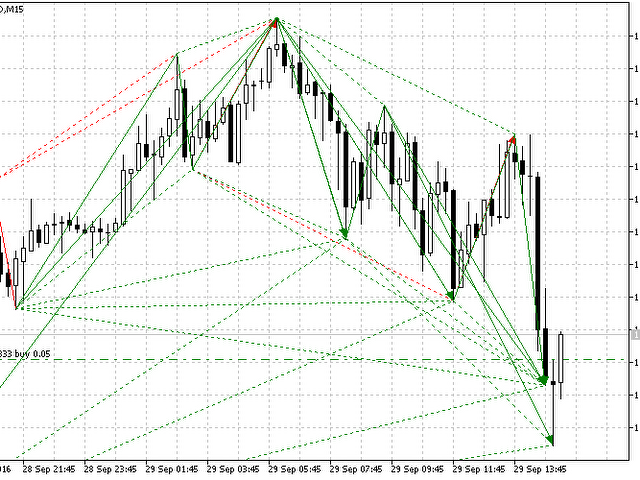
- Fill patterns visually or just show the line segments
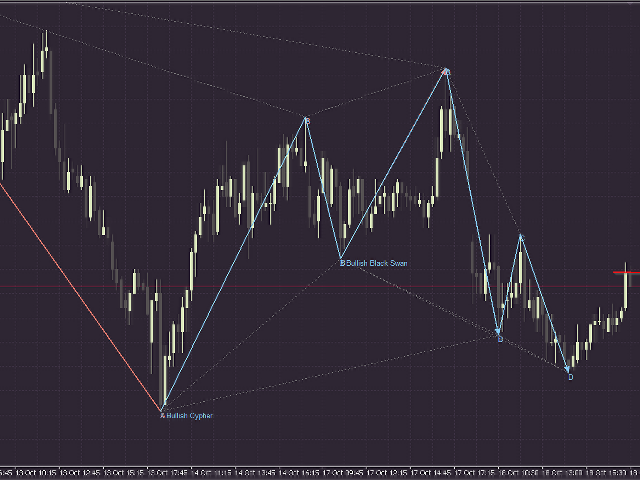
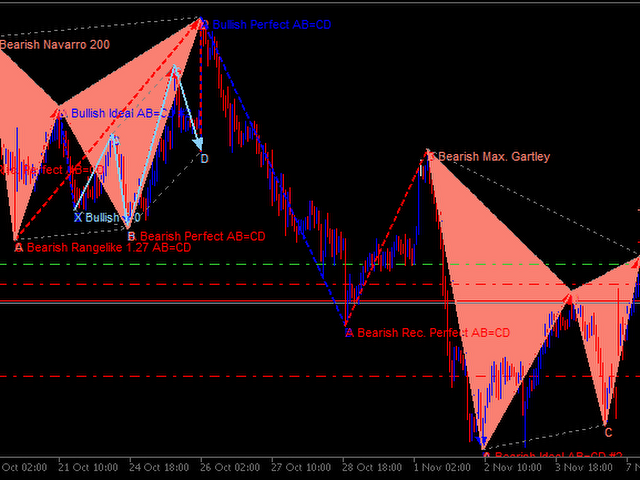
- Show pattern descriptions. Enabled by default which causes the specific names and points of a pattern to be drawn.
- Show emerging patterns. This is enabled by default and shows the future projections necessary to anticipate a trade opportunity.
- Show old patterns. This is enabled, but causes the indicator to draw already completed patterns – which strictly speaking is not always necessary.
- Show "one-ahead" projections. Though disabled by default, enabling this option causes the indicator to become more responsive than the zigzag and projects patterns ahead of the current swing
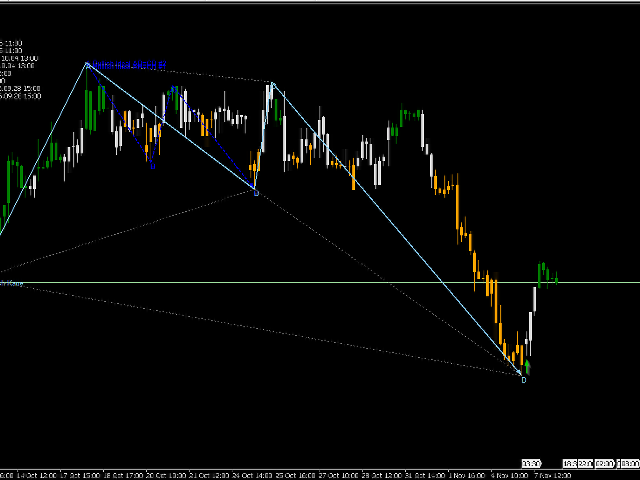
- Draw soft projections. This is a mode of visualizing projected patterns that is minimally cluttering using colors that blend in to the background scheme.
- Show the comment box. This occupies the upper left of the chart and gives statistical information.
So just go ahead and download it as its usage is pretty intuitive.
It is recommended to use a black background or else you will need to set a visible color scheme in the indicator settings.






用户没有留下任何评级信息