• 概述
  • 评论
  • 评论

Defense Line

Indicator that determines very accurately "future" where BUYERS and SELLERS will defend their positions.

DOES NOT use moving averages, Fibonacci or any other underlying indicators.

SIMPLE AND EFFICIENT !!

In these defense regions "DEFENSE LINE" is the best region for decision making to buy / sell.


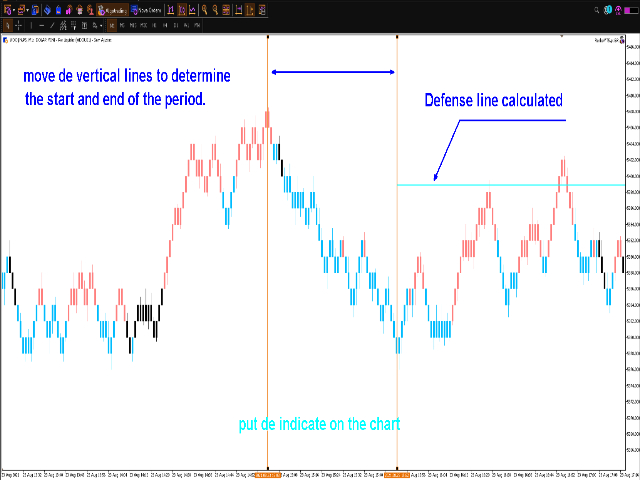
1- Place the indicator on the chart

2 - Move the Vertical lines to the period to be analyzed

3 - The Defense Line will be drawn automatically

4 - To erase the Defense Line, press the "R" key

5 - To keep the Defense Line on the graph, left-click on it to activate it and then right-click on it and go to DEFENSE_LINE PROPERTIES

6 - Change the NAME

7 - For long periods on the chart you can change the PROPERTY OF DEFENSE_LINE to greater thicknesses and different colors

8 - Wait for the graphic to arrive on the Defense Line ..... Good
推荐产品
CChart
Rong Bin Su
在外汇和金融市场中,快速反应和精准的决策至关重要。然而,常规的 MetaTrader 5 终端最低只支持 1 分钟图表,限制了交易者对市场波动的敏感度。为了解决这一问题,我们推出了全新的 秒级图表 K 线指标 ,让您在副图中轻松查看和分析 1 秒至 30 秒的市场动态。 主要功能 支持多种秒级周期 :该指标允许您选择以下周期,满足不同交易策略的需求: S1 : 1 秒 S2 : 2 秒 S3 : 3 秒 S4 : 4 秒 S5 : 5 秒 S10 : 10 秒 S15 : 15 秒 S20 : 20 秒 S30 : 30 秒 实时更新 :秒级图表将实时更新,确保您在每一刻都能获取到最新的市场信息,帮助您做出及时的交易决策。 用户友好的界面 :该指标在副图中显示,直观易用,您可以轻松切换不同的时间周期,快速分析市场走势。 适用人群 短线交易者 :适合高频交易和短线策略的交易者,通过秒级图表捕捉瞬息万变的市场机会。 技术分析师 :为技术分析提供更细致的数据支持,帮助您识别潜在的买入和卖出信号。 如何使用 将指标添加到您的图表上。 选择您希望观察的秒级时间周期。 实时监控市场动向,利用丰富
This code creates a custom indicator for the MetaTrader 5 platform. The indicator generates strong buy and sell signals using a combination of ZigZag, Moving Average (MA), and Relative Strength Index (RSI). Here’s a detailed explanation of the code: Indicator Definition and Features: The indicator is displayed in the chart window. It uses 5 indicator buffers and 3 plots. Separate graphs are defined for ZigZag, buy signals, and sell signals. Input Parameters: Various parameters are defined for Z
Trend Monitor VZ MT5
Sergey Ermolov
5 (1)
MT4版本  |   Valable ZigZag指標   |  FAQ 艾略特波浪理論是對金融市場過程的一種解釋,它基於價格圖表上波浪的視覺模型。 根據這個理論,我們可以確切地知道現在市場上盛行的趨勢是向上還是向下。  Valable ZigZag 指標 顯示了 市場的波浪結構 ,並指示了當前時間框架內當前主要趨勢的方向。 為方便起見,Trend Monitor VZ 指標將在圖表上顯示所有時間範圍的趨勢方向,以及您交易的整個貨幣對列表。 在一張圖表上全面了解所有工具的市場狀況,以做出正確的交易決策! Valable ZigZag 指標 非常穩定 ,不會像經典的 ZigZag 那樣經常改變方向,使交易者感到困惑。 這是通過使用分形來繪製指標的波浪來實現的。 Valable ZigZag 指標首先是一個趨勢指標 。 它設定了交易者應該交易的主要方向,Trend Monitor VZ 指標給出了當前市場正在發生的事情的總體思路。 例如: 如果 EURUSD 貨幣對的所有時間範圍內的指標都顯示向上箭頭,則表明上升趨勢已經確立。 現在入市為時已晚,因為很可能市場已經超過了足夠多的點,並且有
FRB Candle Counter
Fernando Baratieri
Candle Counter This product counts the candles and shows the result according to the configuration defined by the user. Professional traders use it to emphasize a specific candlestick. Settings Position - Choose whether the numbers will be displayed above or below the candle Distance - The distance that the number will have from the candle, referring to the minimum or maximum Font Size - Font Size Color - Font Color
Breaker Blocks
Navdeep Singh
Market structures, Market balance, Range breakouts This tools helps to identify areas of market ranges, structures and plots colored boxes on breakout of those areas. User is given the option to receive alerts and notifications on the formation of the blocks. The tool has the ability to become an essential part of a technical trading system or even pure price action trading. Usage:- An essential tool for price action or technical traders.  More information in the blog
Non-lagging VOLATILITY indicator A radical modification of the ATR indicator, which corrected all of its shortcomings (the picture shows the difference with ATR). The indicator shows the swing size of the current market movement. Features: does not have a time window period, i.e. any subjective settings non-delayed, the extremums of the indicator always coincide with the extremum of the price (note the picture) is normalized by means of a color solution, i.e. it has the properties of an oscillat
Just $10 for six months!!!. This will draw Order Blocks just by clicking on a candle with different colors for different time frames. It will use the body or the wicks. It can also draw the mean threshold of the candle open/close or high/low. As a drawing tool, it is not active all the time after adding it to the chart. Activate by pressing 'b' twice on the keyboard within a second. If activated but then decided not to draw, deactivate by pressing 'b' once.  Box color depends if candle is abo
About indicator > The indicator is a function based on one value (open/high prices up to now) and then it is a mathematical representation of the whole function that is totally independent from any else values. So, if you ask yourself will the future be as it is on the graph... I can tell you - as it was the same as the trading function up to the moment "now"... In conclusion, the point of the indicator is  to try to show the future of the trading function into eternity. The graphic is sometime
Utilities
Douglas Lucio De Araujo
Indicator with 3 features - Clock : Clock independent of the chart, counting continues even when the market is closed. - Template : After setting up a configuration in any graphic, be it color patterns, indicators, zoom ... The configuration will be copied to all active graphics. - TimeFrame : Set the TimeFrame on a chart, and with just one click all the active charts will be changed to the same TimeFrame.
Engulfing Candle Alert MT5
Prafull Manohar Nikam
This is a simple arrow system based on Engulfing Candlestick Pattern. It gives you alerts on your smartphone when there is an engulfing candlestick pattern happens. Which type of alerts available? 1. It paints on chart Up/Down Arrows. 2. Popup message and sound alert in trading terminal window. 3. Push notification or Alert on your Android and IOS mobile phones (requires MT4 or MT5 app installed!) *Note: Use it on higher timeframes like H4 (4 hours), D1 (1 Day) then find trade opportunities on s
Range Exhaustion MT5
Robert Gerald Wood
当价格达到或超过当前期间的预期范围时,范围耗尽就会发生。在这些水平上,价格开始失去相对于该时期早些时候的动力,因此最好确保您没有建立新头寸。 该指标将向您显示图表上可能发生这种情况的位置,显示每日、每周和每月的水平。 当您看到价格超过这些耗尽水平时,它告诉您移动背后的势头非常强劲,并且可能会走向更高的时间框架水平。 该指标可以使用平均真实范围 (ATR) 或平均范围 (ADR) 计算,具体取决于您的偏好。默认情况下,我们使用 ATR,因为我们发现它在外汇图表上效果更好,但 ADR 在基于股票的指数和符号上确实具有优势。 该指标有多种绘图模式,如下所述,您可以根据自己的需要对其进行定制。 设置 计算模式 选择 AverageTrueRange (ATR) 或 AverageDailyRange (ADR) 来计算水平。 绘图模式 该指标可以以不同的方式显示。 - 绘制价格调整线     - 水平根据达到的高点和低点在整个时期内进行调整。这是默认且最常用的方法。 - 绘制预期最大值     - 水平是一个固定值,是最后一个收盘价加上或减去 ATR 或 ADR 值。 - 绘制两条线    
Adaptive Volatility Range [AVR] -  is a powerful tool for identifying key trend reversals. AVR -   accurately displays the Average True Volatility Range taking into account the Volume Weighted Average price. The indicator allows you to adapt to absolutely any market volatility by calculating the average volatility over a certain period of time - this provides a stable indicator of positive transactions. Thanks to this , Adaptive Volatility Range   has a high   Winrate of 95% There are two ways t
KT Price Border MT5
KEENBASE SOFTWARE SOLUTIONS
KT Price Border creates a three-band price envelope that identifies potential swing high and low areas in the market. These levels can also be used as dynamic market support and resistance. The mid-band can also be used to identify the trend direction. As a result, it also functions as a trend-following indicator. In addition, its ease of use and more straightforward conveyance of trade signals significantly benefit new traders. Features It works well on most of the Forex currency pairs. It wo
(加密货币图表) 将 Binance Spot 中的所有符号保存到自定义符号中。 为 Binance Spot 中的符号添加“S”前缀。 它创建了可以跟踪 Binance Spot 中的符号的基础设施。 您应该允许来自工具菜单 >> 选项 >> 智能交易系统的 WebRequest 并添加 URL: https://api.binance.com 只需双击脚本。 您可以在几秒钟内获得整个列表。 在链接中查看产品 https://www.mql5.com/en/market/product/69001 如果在安装过程中或售后出现任何问题,请随时与我们联系。 如果在安装过程中或售后出现任何问题,请随时与我们联系。 如果在安装过程中或售后出现任何问题,请随时与我们联系。
FREE
Visual Book for MT5
Joao Luiz Savioli Filho
This MetaTrader 5 (MT5) indicator script is designed to create a visual book representation of the market order book, displaying buy and sell orders directly on the chart. The indicator uses the following features: Customizable Width and Colors : The width of the visual book can be adjusted, and different colors can be set for buy and sell orders. Market Book Data Handling : It retrieves the current market order book data for the symbol and visualizes this data as rectangles overlaid on the char
This indicator delves into using standard deviations as a tool in trading, specifically within the Inner Circle Trader (ICT) framework. Standard deviations are a statistical measure that helps traders understand the variability of price movements. These projections is use to forecast potential price targets, identify support and resistance levels, and enhance overall trading strategies. Key Concepts: Understanding Standard Deviations : Standard deviations measure how much a set of values (in thi
(加密货币图表) 它带来与您指定的柱线数量一样多的历史记录,并开始直接显示即时数据。 提供在所有时间范围内工作的机会。 允许您使用多个符号。 这个应用程序是一个后台服务。 它下载市场观察屏幕上以“S”开头的所有交易品种的历史记录并显示报价数据。 自动将币安现货实时交易数据传输至MT5。 运行链接中的脚本以使用该程序。 https://www.mql5.com/en/market/product/69000 此程序需要安装。 https://www.mql5.com/tr/market/product/73887 您应该允许来自工具菜单 >> 选项 >> 智能交易系统的 WebRequest 并添加 URL: https://api.binance.com https://fapi.binance.com
AO Trade
Ka Lok Louis Wong
AO Trade 系統是專門為趨勢交易而設計,利用競價時段或新聞時間作為參考點,與其他特定時間進行比較,以預測市場趨勢。 ** EA 中使用的所有時間參數均基於您的終端時間。不同的經紀人可能運作在不同的格林尼治標準時間區域,亦可能因夏令時調整而進一步變化。 請確保在實施之前對齊您終端的時間設置進行全面驗證。** 推薦設置: Use in   M1  timeframe HK50 / DE40 / ustec / UK100 在時間檢查期間,您將注意到價格檢查發生在特定檢查時間分鐘之後的1分鐘(1.2檢查時間分鐘)。這個設計是有意的,允許參考的柱子完成,從而確保開盤價、最高價、最低價和收盤價可以用於與訂單時間進行準確比較。 設置: -----------------1 Timers------------------- 1.1 Check time hour (HH)    --  用於記錄價格的時間戳。 1.2 Check time minute (MM) 1.3 Order time hour (HH)    -- 用於與檢查價格進行比較以開啟訂單的時間戳。 1.4 Order
Order Block Detector
Cao Minh Quang
5 (2)
Automatically detect bullish or bearish order blocks to optimize your trade entries with our powerful indicator. Ideal for traders following ICT (The Inner Circle Trader). Works with any asset type, including cryptocurrencies, stocks, and forex. Displays order blocks on multiple timeframes, from M2 to W1. Alerts you when an order block is detected, migrated, or a higher timeframe order block is created/migrated. Perfect for both scalping and swing trading. Enhanced by strong VSA (Volume Spread A
Fundamental Signals Indicator MT5
Kyra Nickaline Watson-gordon
Fundamental Signals Indicator is a Non-Repaint Indicator with a powerful calculation engine that can predict market movement over 3000 pips (30000 points). The indicator does not analyze the market fundamentally, it is named fundamental because it can predict trends with large movements, no complicated inputs and low risk. Also Indicator can alert on market trend changes. Using Indicator : The Indicator is very simple and without complicated input parameters. (No need to optimize anything.)T
Volume Delta Panel  is a very powerful indicator that read the supply on Market. It calculates the Delta from movement of the price and the difference of BUY volumes and SELL volumes. The Volumes are added to price and normalized to symbol points.  Its special structure allows you to get all Time Frames values available on the platform MT5. Panel can show 50 instruments simultaneously all customizable according to the offer of the Broker. A good observation of this instrument can suggest great e
Jabidabi Session Indicator The Market Session Indicator is a powerful tool used by traders to identify and track different trading sessions within the forex and stock markets. It visually highlights key trading periods, such as the Asian, European, and North American sessions, directly on the trading chart. This indicator is especially useful for traders who follow ICT (Inner Circle Trader) strategies, which emphasize the significance of various market sessions for optimal trading opportunities.
用强货币兑弱货币交易始终是最安全的做法。该指标衡量主要货币之间的相对强度,使工具选择更加容易,进出交易更加容易。基本思想是使用强势货币作为对冲货币来攻击弱势货币,反之亦然。买强反弱,短期买弱反强。 [ 安装指南 | 更新指南 | 故障排除 | 常见问题 | 所有产品 ] 一目了然地找到强弱货币 轻松将一种货币与另一种货币进行比较 货币升值了吗?寻找多头 货币在贬值吗?寻找短裤 它实现了一个多时间仪表板 这是交易的最高品质确认 该指标根本不需要优化 可定制的回溯期 指示器不重涂 解释指标非常容易。它比较了27种货币对的当前价格和以前的价格,并计算了每种货币兑其他所有货币获利或损失的次数。由于只有8种货币,因此最高得分为+7,这意味着相对于所有其他货币获得了一种货币,而最低得分为-7,这意味着相对于所有其他货币而言,该货币损失了。将为每个时间范围计算此逻辑,并将其显示在仪表板中,以帮助您找到所有时间范围内的强弱货币。 重要提示: 该指标在测试仪中不起作用,MT4不支持多币种背书。不要回测。 指标剖析 货币计量器指标评估几种货币对,并以绝对值确定在确定的时间段内哪种货币相对于所有其他货
Introducing Mito Velocity, a trading advisor built for serious traders who want a serious edge over the market. This advisor is the result of extensive research and testing, using a spatial AI algorithm to measure the deceleration of trends and enter at potential trend reversals. Every system has their own unique settings, combined into a single powerful portfolio. All strategies are built by using a smart pr edictive proprietary AI model I developed using multiple data inputs outside of normal
With Fixed Range Volume Profile,The traces left by the big players will not go unnoticed by you. Professional   Volume Profile   Indicator reveals Institutional order flow. This advanced market indicator will teach you to spot the buying and selling. Dont want to say more because its well known by most professionals  trader. This Indicator : -  Quickly Identify the Strongest Institutional S/R Zones. - W orks with all Trading Instruments (Forex, Futures, Indexes, Commodities, Stocks, Cryptocurr
币安是全球知名的加密数字货币交易所!为方便MT5用户直接进行币安期货交易,程序提供以下交易功能: 1、模仿币安期货交易风格,提供友好的操作面板; 2、自行输入api、secret(需要在币安api开通期货交易权限)即可获取杠杆,余额等信息; 3、支持limitOrder(限价订单), marketOrder(市价订单), stopLimit(限价止盈止损单), stopMarket(市价止盈止损单); 4、市价单时可根据最新价格算出最大开仓量和成本信息; 5、可显示所有的订单列表,并可取消订单; 6、可现实所有的仓位列表,并可按照市价订单清空仓位; 7、支持深度信息自动显示(需要深度Websocket产品,可参考: https://www.mql5.com/zh/market/product/68977 ); 8、支持api代理,适合于不能直接访问币安的用户。默认提供的代理为:trade.crossers.net,注意需要将地址放入:工具——选项——EA——WebRequest列表中; 如果需要在的EA中直接交易币安期货,可联系我们提供币安期货交易源代码库 注意:基于mt5开发的量化平
VolumesWithMedia
Jonathan Pereira
5 (1)
Volume is a widely used indicator in technical analysis, however there is a variation that is even more useful than Volume alone: the Moving Average of Volume. It is nothing more than a moving average applied to the popular Volume indicator. As the name says, Volume + MA serves to display the transacted volume (purchases and sales executed) of a certain financial asset at a given point of time together with the moving average of that same volume over time. What is it for? With the Volume + M
FREE
GridMartin Conqueror MT5
Konstantin Kulikov
4 (6)
An automated trading system with smart entry/exit algorithms that uses grid and martingale techniques to maximize profits. The expert has monitoring with a long history for many months, since this system, like all my other experts, is focused on long-term growth: https://www.mql5.com/en/signals/author/test-standart The best sets for currency pairs: GBPUSD, GBPCAD, EURJPY (timeframe М1). Download settings (sets):   https://www.mql5.com/en/blogs/post/747929 Description of EA parameters in comment
HTF Fair Value Gaps is an indicator which plots the bigger version of the higher time-frame Fair Value gaps  on the lower time-frame chart. The indicator plots only fair value gaps from closed candles, with no lag or repainting. i.e. Once the higher time-frame candle has closed, if it left behind a fair value gap, it is immediately plotted on the lower time-frame. The FVGs can be plotted in three ways, which can be selected via input. Only on last candle: In this case the FVG will be plotted on
The Gold-Euro Edge The Gold-Euro Edge is a powerful trading tool designed to provide real-time insights into the volatility of two major markets: XAUUSD (Gold/USD) and EURUSD (Euro/USD) . Key Features Comprehensive Market Analysis : Continuously analyzes price fluctuations in both XAUUSD and EURUSD, identifying periods of heightened or diminished volatility. Real-Time Alerts : Audible Alerts : Receive immediate audio notifications directly from your trading platform, alerting you to significant
该产品的买家也购买
Trend Screener Pro MT5
STE S.S.COMPANY
4.89 (74)
使用趋势筛选指标释放趋势交易的力量:由模糊逻辑和多货币系统提供支持的终极趋势交易解决方案! 使用趋势筛选器(由模糊逻辑提供支持的革命性趋势指标)提升您的趋势交易。 它是一个强大的趋势跟踪指标,结合了超过 13 种高级工具和功能以及 3 种交易策略,使其成为使您的 Metatrader 成为趋势分析器的多功能选择。 限时优惠:趋势筛选指标终身仅需 50 美元。 ( 原价 250$ ) (优惠延长) 体验趋势筛选器 100% 无需重新绘制的准确性,确保您的交易决策不受过去价格变化的影响。 释放多时间框架和多货币功能的多功能性,使您能够以无与伦比的信心在外汇、商品、加密货币和指数领域进行交易。 利用 Trend Screener 的综合策略套件增强您的交易: - 趋势跟踪策略和趋势延续策略 :趋势筛选器的趋势跟踪策略提供清晰的趋势延续信号,让您有效捕捉趋势走势并管理风险。 - 反转策略和早期入场点策略 :趋势筛选器的反转策略可检测市场方向的潜在变化,使您能够预测趋势反转并利用疲弱的市场趋势。通过早期入场点,您可以在潜在的趋势变化之前定位自己 获取可观的利润。 - 倒卖策略: 趋势筛选器的倒卖
Golden Trend Indicator MT5
Noha Mohamed Fathy Younes Badr
4.87 (15)
Golden Trend indicator  is The best indicator for predicting trend movement this indicator never lags and never repaints and never back paints    and give  arrow buy and sell    before the candle appear  and it will help you and  will make your trading decisions clearer its work on all currencies and  gold and crypto and all time frame This unique  indicator uses very secret algorithms to catch the  trends, so you can trade using this indicator and see the trend clear on charts  manual guide and
FX Volume MT5
Daniel Stein
4.82 (17)
FX Volume:从经纪商视角洞察真实市场情绪 简要概述 想要提升您的交易策略? FX Volume 可提供零售交易者和经纪商的持仓实时数据——远早于诸如 COT 之类的延迟报告。不论您希望获得持续稳定的收益,还是想在市场中多一分制胜的砝码, FX Volume 都能帮您识别重大失衡、确认突破以及完善风险管理。立即开启体验,让真实的成交量数据为您的交易决策带来革新! 1. 为什么 FX Volume 对交易者格外有用 极具准确度的早期预警 • 快速捕捉有多少交易者正在买入或卖出某个货币对——比大多数人提前一步。 • FX Volume 是 唯一 能够整合多家零售经纪商真实成交量数据并以简洁方式呈现的工具。 强力风险管理 • 及时识别多头或空头仓位的巨大不平衡,这往往预示着潜在的趋势反转,帮助您更自信地设置止损和目标位。 • 独家而真实的数据让每一次交易决策更具可靠性。 优化进场与出场点 • 发现“过度集中”的交易(大多数交易者都在同一方向),并通过真实成交量来确认突破。 • 避免依赖常见指标可能带来的误导信号,而是利用真实的实时成交量。 适配各种交易策略 • 将 FX
FX Levels MT5
Daniel Stein
5 (3)
FX Levels:适用于所有市场的高精度支撑与阻力 快速概览 想要精准确定适用于任何市场(外汇、指数、股票或大宗商品)的支撑与阻力吗? FX Levels 将传统的“Lighthouse”方法与前沿的动态分析相结合,实现近乎通用的准确性。依托真实经纪商经验和自动化的每日与实时更新, FX Levels 帮助您捕捉价格反转点、设置合理的盈利目标,并自信地管理交易。立即使用,体验更准确的支撑/阻力分析如何助力您的交易更上层楼! 1. 为什么 FX Levels 对交易者非常有利 极度精准的支撑 & 阻力区 • FX Levels 专为不同经纪商提供的行情源和时间设置而设计,可生成几乎相同的价位区,解决数据不一致的常见问题。 • 这意味着无论您在哪里交易,都能获得稳定一致的水平线,为策略打下更加牢固的基础。 结合传统与先进技术 • 通过将久经考验的“Lighthouse”方法与动态分析相融合, FX Levels 不仅限于每日刷新,还可针对新的价格波动进行即时更新。 • 您可以选择经典的静态方式,或实时捕捉新出现的水平,以贴近最新的市场行为。 识别清晰的反转点 • FX Lev
FX Power MT5 NG
Daniel Stein
5 (11)
FX Power:分析货币强度,助您做出更明智的交易决策 概述 FX Power 是一款专业工具,帮助您全面了解主要货币和黄金在任何市场条件下的真实强度。通过识别强势货币用于买入,弱势货币用于卖出, FX Power 简化了交易决策,并帮助您发现高概率的交易机会。不论您是想跟随趋势还是通过极端的 Delta 值预测反转,这款工具都能完美适应您的交易风格。别再盲目交易——用 FX Power 让您的交易更加智慧。 1. 为什么 FX Power 对交易者极具价值 实时货币和黄金强度分析 • FX Power 实时计算并显示主要货币和黄金的相对强度,助您全面了解市场动态。 • 监控领先或落后资产,轻松识别值得交易的货币对。 全面的多时间框架视图 • 跟踪短期、中期和长期时间框架的货币和黄金强度,以便将您的交易策略与市场趋势保持一致。 • 无论是快进快出的短线交易还是更长期的投资策略, FX Power 都能为您提供所需的信息。 Delta 动态分析用于趋势和反转 • 极端 Delta 值常常预示反转机会,而平缓的 Delta 变化则确认趋势延续。 • 使用 Delta 分析,轻
CBT Quantum Maverick 高效的二元期权交易系统 CBT Quantum Maverick 是一款精心设计的高性能二元期权交易系统,专为追求精准、简单和纪律的交易者打造。无需自定义,该系统经过优化,可直接使用并产生高效结果。只需遵循信号操作,稍加练习即可掌握。 主要特点: 信号精准度: 基于当前K线生成下根K线交易信号,无频繁重绘。 市场多样性: 专为二元期权交易设计,兼容多种经纪商和资产类别,适应不同交易偏好。 兼容性: Deriv Synthetic Charts :适用于任何时间框架。 OTC Charts :来自如 Quotex、PocketOption、Binomo、Stockity、IQOption、Exnova、OlympTrade、Deriv、Binolla 和 Homebroker 的经纪商,可导入 MT5(一周内提供免费导入支持,之后需支付服务费用)。 外汇、加密货币和商品市场 :扩展资产利用。 高收益二元资产 :建议使用90%以上的高回报率资产。 额外优势: 全面的交易计划: 提供系统化和纪律性交易的分步支持计划。 高效时间利用: 每天仅需一
IX Power MT5
Daniel Stein
4.83 (6)
IX Power:解锁指数、大宗商品、加密货币和外汇市场洞察 概述 IX Power 是一款多功能工具,可分析指数、大宗商品、加密货币和外汇市场的强弱表现。 FX Power 提供针对货币对的最高精度,利用所有可用货币对数据进行分析,而 IX Power 专注于基础资产的市场数据。这使得 IX Power 成为非外汇市场的理想选择,同时在需要简单外汇分析时也非常可靠。它可以无缝适用于任何图表,提供清晰的、有行动价值的洞察,帮助提升您的交易决策。 1. 为什么 IX Power 对交易者非常有价值 多市场强弱分析 • IX Power 分析指数、大宗商品、加密货币和外汇市场的强弱表现,为每个市场提供量身定制的洞察。 • 监控 US30、WTI、黄金、比特币等资产的表现,发现交易机会。 适用于更广泛的市场 • 对于外汇交易, FX Power 提供无与伦比的精度,通过分析所有相关货币对。 • IX Power 专注于基础资产的市场数据,非常适合非外汇市场及简化的外汇分析。 实时适应性 • 借助自适应算法, IX Power 实时响应市场数据变化,保持分析的最新性。 • 实时更新
Entry Points Pro for MT5
Yury Orlov
4.46 (130)
这款指标用于 MT5,可提供准确的入场交易信号,且无重绘。 它可应用在任何金融资产:外汇、加密货币、贵金属、股票、指数。 它将提供极其精准的评估,并告诉您何时开仓和平仓的最佳时机。 观看 视频 (6:22),其中包含一个仅处理单一信号的示例,该信号即可值回指标购价! 大多数交易者在 Entry Points Pro 指标的帮助下,在第一个交易周内即改善了他们的交易结果。 订阅我们的 Telegram 群 ! Entry Points Pro 指标的益处。 入场信号无重绘 如果信号出现,并得到确认,则它不会再消失;不像是重绘指标,它会导致重大的财产损失,因为它们可以在显示信号后再将其删除。 无差错开仓 指标算法可令您找到入场交易(买入或卖出资产)的理想时机,从而提高每位交易者的成功率。 Entry Points Pro 可操作任何资产 它允许您在 MT5 平台上交易任何经纪商的加密货币、股票、贵金属、指数、大宗商品和货币。 提供任何方向的信号 Entry Points Pro 指标提供针对任意价格走势的入场交易信号 - 上涨、下跌或横盘(横向)。 最大盈利潜力 离场信号
Quantum TrendPulse
Bogdan Ion Puscasu
5 (13)
介绍 Quantum TrendPulse   ,这是一款终极交易工具,它将 SuperTrend   、   RSI 和 Stochastic 的强大功能整合到一个综合指标中,以最大限度地发挥您的交易潜力。该指标专为追求精准和效率的交易者而设计,可帮助您自信地识别市场趋势、动量变化以及最佳进入和退出点。 主要特点: 超级趋势整合: 轻松跟随当前的市场趋势并乘上盈利浪潮。 RSI 精度: 检测超买和超卖水平,非常适合把握市场逆转时机,可用作 SuperTrend 的过滤器 随机精度: 利用随机振荡在波动的市场中寻找隐藏的机会, 用作超级趋势的过滤器 多时间范围分析: 从 M5 到 H1 或 H4,在不同时间范围内关注市场动态。 可定制的警报: 当您的自定义交易条件得到满足时收到通知,这样您就不会错过任何交易。 无论您是新手还是经验丰富的交易员,   Quantum TrendPulse 都能为您提供所需的优势,帮助您增强策略并自信地进行交易。借助这一强大的指标,将洞察力转化为利润 — 掌控您的交易! ***购买 Quantum TrendPulse,即可免费获得 Quantum Tr
FX Dynamic:借助可定制的 ATR 分析,追踪波动率与趋势 概述 FX Dynamic 是一款强大的工具,通过计算平均真实波幅(ATR)来为交易者提供日内和日间波动性方面的深度见解。通过设置 80%、100%、130% 等关键波动率阈值,您可以快速识别潜在的盈利机会,或者在市场超出常规范围时及时得到预警。 FX Dynamic 可根据您经纪商的时区进行调整,帮助您保持一致的波动率衡量标准,并能与 MetaTrader 平台完美结合,实现实时分析。 1. 为什么 FX Dynamic 对交易者极具价值 实时 ATR 洞察 • 仅需一眼便可了解日间与日内波动水平。当价格触及或突破 80%、100%、130% 的 ATR 阈值时,会发出提示,让您知道市场是否达到临界水平。 • 在波动完全爆发前预判可能的衰竭或突破走势。 多市场通用 • 适用于外汇、商品、指数等多种资产。 FX Dynamic 可以自动识别经纪商时区,也可手动进行调整。 • 您可选择只专注于某一特定品种,或在多市场保持一致的 ATR 标准。 更智能的风险管理 • 利用 ATR 门槛来优化止损或止盈位置。当市场
TPSpro RFI Levels MT5
Roman Podpora
4.53 (19)
指示       俄罗斯 -        英语   建议 与指示器一起使用     -       TPSpro 趋势专业版 -   MT4版本       交易中的一个关键要素是做出买卖交易工具决定的区域或水平。尽管主要参与者试图隐藏他们在市场中的存在,但他们不可避免地会留下痕迹。我们的任务是学习如何识别这些痕迹并正确解释它们。 主要功能: 向卖家和买家显示活跃区域! 该指标显示所有正确的初始买入和卖出脉冲水平/区域。激活这些水平/区域后,开始寻找切入点,水平会改变颜色并填充特定阴影。此外,还会显示箭头,以便更直观地了解情况。 显示更高时间范围内的级别/区域(MTF 模式) 添加了使用更高时间间隔显示级别/区域的功能。此外,该指标还具有自动趋势检测功能(   TPSproTREND PRO   )。 用于交易的单独专业的逐步算法。 该算法专为日内交易而设计,既可顺势交易,也可逆势交易。每个活动模板均提供详细说明。 适用于多种时间范围 。 TPSpro RFI 水平指标可用于图表上的任何时间范围,从一分钟(M1)开始一直到每月(MN)。 图形和声音警报。 该指标提供图形和声音指示,
Bill Williams Advanced
Siarhei Vashchylka
5 (9)
Bill Williams Advanced is designed for automatic chart analysis using Bill Williams' "Profitunity" system. The indicator analyzes four timeframes at once. Manual (Be sure to read before purchasing) Advantages 1. Automatically analyzes the chart using the "Profitunity" system of Bill Williams. The found signals are placed in a table in the corner of the screen. 2. Equipped with a trend filter based on the Alligator indicator. Most of the system signals are recommended to be used only according t
Basic Harmonic Patterns Dashboard MT5
Mehran Sepah Mansoor
4.57 (7)
该仪表盘显示所选符号的最新可用谐波形态,因此您可以节省时间并提高效率 /  MT4 版本 。 免费指标:  Basic Harmonic Pattern 指标列 Symbol:   显示所选符号 Trend:     看涨或看跌 Pattern:    形态类型(Gartley、蝴蝶、蝙蝠、螃蟹、鲨鱼、Cypher 或 ABCD) Entry:     入口价格 SL: 止损价 TP1: 第一止盈价 TP2: 第二次获利价格 TP3: 第三次获利价格 Current price:    当前价格 Age (in bars):   最后绘制的模式的年龄 主要输入 Symbols :   从 "28 种主要货币对 "或 "选定符号 "中选择。 Selected Symbols :   希望监控的符号,用逗号分隔("EURUSD,GBPUSD,XAUUSD")。如果您的经纪商为货币对设置了后缀或前缀,您必须在以下两个参数中添加(货币对前缀或货币对后缀)。 Max Iteration:   调整模式的最大迭代次数(如果该值越小,则模式越少,性能越快;如果该值越大,则模式越多,性能越慢)
Matrix Arrow Indicator MT5
Juvenille Emperor Limited
5 (13)
矩阵箭头指标 MT5   是一种独特的 10 合 1 趋势,遵循   100% 非重绘多时间框架指标 ,可用于所有符号/工具: 外汇 、 商品 、 加密货币 、 指数 、 股票 。 Matrix Arrow Indicator MT5 将在其早期阶段确定当前趋势,从多达 10 个标准指标中收集信息和数据,它们是: 平均定向运动指数 (ADX) 商品渠道指数 (CCI) 经典 Heiken Ashi 蜡烛 移动平均线 移动平均收敛散度 (MACD) 相对活力指数 (RVI) 相对强弱指数 (RSI) 抛物线SAR 随机振荡器 威廉姆斯的百分比范围 当所有指标给出有效的买入或卖出信号时,相应的箭头将打印在图表上,在下一根蜡烛/柱线开盘时,指示强劲的上升趋势/下降趋势。用户可以选择使用哪些指标,并可以单独调整每个指标的参数。 Matrix Arrow Indicator MT5 仅从选定的指标中收集信息,并仅根据其数据打印箭头。   Matrix Arrow Indicator MT5   还可以为所有新信号发送终端、推送通知或电子邮件警报。无论您是黄牛、日内交易者还是波段交易者, Mat
Gartley Hunter Multi
Siarhei Vashchylka
5 (9)
Gartley Hunter Multi - An indicator for searching for harmonic patterns simultaneously on dozens of trading instruments and on all possible timeframes. Manual (Be sure to read before purchasing) | Version for MT4 Advantages 1. Patterns: Gartley, Butterfly, Shark, Crab. Bat, Alternate Bat, Deep Crab, Cypher 2. Simultaneous search for patterns on dozens of trading instruments and on all possible timeframes 3. Search for patterns of all possible sizes. From the smallest to the largest 4. All fou
支撑和阻力筛选器是 MetaTrader 的一个级别指标,它在一个指标内提供多种工具。 可用的工具有: 1. 市场结构筛选器。 2. 看涨回调区。 3. 看跌回调区。 4.每日枢轴点 5.每周枢轴点 6. 每月枢轴点 7. 基于谐波形态和成交量的强大支撑和阻力。 8. 银行级区域。 限时优惠:HV 支撑和阻力指示器仅售 50 美元且终生可用。 (原价 125$) 通过访问我们的 MQL5 博客,您可以找到我们所有带有分析示例的高级指标: 单击此处 主要特点 基于谐波和音量算法的强大支撑和阻力区域。 基于谐波和成交量算法的看涨和看跌回调区域。 市场结构筛选器 每日、每周和每月的枢轴点。 文档 所有支持和阻力筛选器文档(说明)和策略详细信息均可在我们 MQL5 博客的这篇文章中找到: 单击此处。 接触 如果您有任何问题或需要帮助,请通过私信联系我。 作者 SAYADI ACHREF,金融科技软件工程师,Finansya 创始人。
介绍     Quantum Breakout PRO   ,突破性的 MQL5 指标,正在改变您交易突破区域的方式!由拥有超过13年交易经验的资深交易员团队开发,     量子突破 PRO     旨在通过其创新和动态的突破区域策略将您的交易之旅推向新的高度。 量子突破指标将为您提供带有 5 个利润目标区域的突破区域的信号箭头,以及基于突破框的止损建议。 它既适合新手交易者,也适合专业交易者。 量子 EA 通道:       点击这里 重要的!购买后请私信我领取安装手册。 建议: 时间范围:M15 货币对:GBPJPY、EURJPY、USDJPY、NZDUSD、XAUUSD 账户类型:ECN、Raw 或 Razor,点差极低 经纪商时间:GMT +3 经纪商:IC Markets、Pepperstone with Raw 和 Razor 的点差最低 规格: 不重漆! 最多 5 个建议利润目标区域 建议止损水平 可定制的盒子。您可以设置自己的 Box Time Start 和 Box Time End。 接触 如果您有任何疑问或需要帮助,请通过私人消息与我联系。
首先,值得强调的是,这个交易工具是非重绘、非重画和非滞后的指标,非常适合专业交易。 在线课程,用户手册和演示。 智能价格行动概念指标是一个非常强大的工具,既适用于新手,也适用于经验丰富的交易者。它将超过20个有用的指标合并到一个指标中,结合了高级交易思想,如内圈交易员分析和智能资金概念交易策略。该指标侧重于智能资金概念,提供有关大型机构交易方式的见解,帮助预测它们的动向。 它在流动性分析方面尤其擅长,有助于理解机构的交易方式。它擅长预测市场趋势,并仔细分析价格波动。通过将您的交易与机构策略对齐,您可以更准确地预测市场走向。该指标多才多艺,擅长分析市场结构,识别重要的订单区块,并识别各种模式。 它擅长识别BOS和CHoCH等模式,理解动量的转变,并突出显示供需强劲的关键区域。它还擅长发现强大的不平衡,并分析价格创造更高高点或更低低点的模式。如果您使用斐波那契回撤工具,该指标可以满足您的需求。它还可以识别相等的高点和低点,分析不同的时间框架,并通过仪表板显示数据。 对于使用更高级策略的交易者,该指标提供了工具,如公平价值差指标和优惠和折扣区域的识别。它特别关注高时间框架订单区块,并
RelicusRoad Pro MT5
Relicus LLC
4.78 (18)
现在$ 147(更新后增加到$ 499) - 无限帐户(PC或Mac) RelicusRoad 用户手册 + 培训视频 + 访问 Private Discord Group + VIP 身份 一种看待市场的新方式 RelicusRoad 是世界上最强大的外汇、期货、加密货币、股票和指数交易指标,为交易者提供保持盈利所需的所有信息和工具。我们提供技术分析和交易计划,帮助每一位交易者取得成功,从初学者到高级。它是一个关键的交易指标,可以提供足够的信息来预测未来的市场。我们相信一个完整的解决方案,而不是图表上几个没有意义的不同指标。这是一个多合一指标,显示无与伦比且非常准确的信号、箭头 + 价格行为信息。 RelicusRoad 基于强大的人工智能,提供缺失的信息和工具来教育您并使您成为交易专家,成为成功的交易者。 几乎所有技术指标都滞后,这意味着它们只能报告已经发生的事情。因此,他们只确认您过去可以看到的价格已经在哪里。我们相信领先指标可以预测未来价格,而无需重新绘制,也不要过度依赖可能改变并导致重新绘制的滞后指标。如果您根据滞后指标进行交易并建立头寸,您就知道您已经大部分时间
FxaccurateLS
Shiv Raj Kumawat
WHY IS OUR FXACCCURATE LS MT5 THE PROFITABLE ? PROTECT YOUR CAPITAL WITH RISK MANAGEMENT Gives entry, stop and target levels from time to time. It finds Trading opportunities by analyzing what the price is doing during established trends. POWERFUL INDICATOR FOR A RELIABLE STRATEGIES We have made these indicators with a lot of years of hard work. It is made at a very advanced level. Established trends provide dozens of trading opportunities, but most trend indicators completely ignore them! The
TW Trend Scalper Indicator: TW Scalper Shoot 为您提供独特的交易体验,利用最新的交易策略和人工智能技术。该产品满足剥头皮交易者的多样化需求,提供两种不同类别的信号: 今天就测试这个卓越的产品,开始您成为趋势剥头皮交易者的独特体验。 此外,获取价值 37 美元的赠品。 信号类别: 1. 长期和安全信号:这些信号使用价格行为策略(聪明资金规则)、斐波那契水平、支撑和阻力水平以及移动平均线进行识别。该类别中的信号用红色和蓝色箭头及特定目标显示,非常适合寻求长期和可靠交易的交易者。 2. 剥头皮信号(适合专业剥头皮交易者):除了上述策略外,这些信号还利用独特的 Trade Wizards 指标公式和人工智能降噪方法。剥头皮信号以白色箭头添加到第一类信号中,适合外汇剥头皮交易者。 剥头皮指标的独特功能: 1. 信号不变色:信号、SL 和 TP 完全不变且具有高准确性。 2. 精确检测变化趋势:使用两步过滤器高精度识别变化趋势。 3. 视觉和音频警报:警报以闪烁形式显示在图表上,并在图表旁的窗口中显示入场、TP 和 SL 的价格数字
ON Trade Gann Squares MT5
Abdullah Alrai
5 (2)
Gann 方块指标是一种强大的市场分析工具,基于 W.D. Gann 在其“市场预测数学公式”一文中介绍的数学概念。该指标融合了与平方数(如 144、90 和 52)有关的 Gann 技术,以及平方 9。此外,它还融入了  关于如何将平方 9 与通道和星形图案结合使用的方法。 用户手册和使用方式: 在使用该指标之前,我们建议您阅读用户手册,并与我们联系以获得任何澄清。您可以在我们的网站上找到完整的用户手册。 该指标提供了 MT5 的完整版本供购买,也提供了 MT4 的免费版本供测试。提供了两个版本的链接供您方便使用。 主要特点和功能: Gann 方块指标为您的交易环境提供了全套工具,使您能够基于几何图案和 Gann 的概念做出明智的决策。以下是主要特点: 平方 9 分析:   该指标可以绘制与平方 9 有关的各种元素,包括水平线、星形图案、网格、Gann 扇形等。这在您的图表上提供了 Gann 的几何概念的视觉表示。 Gann 方块:   该指标绘制了 Gann 方块 52、90 和 144,使您能够可视化和分析它们与价格走势的关系。 自由 Gann 星形图案:   该指标使您能够直接
Easy Breakout MT5
Mohamed Hassan
5 (3)
After your purchase, feel free to contact me for more details on how to receive a bonus indicator called VFI, which pairs perfectly with Easy Breakout for enhanced confluence!     Easy Breakout MT5   is a powerful price action trading system built on one of the most popular and widely trusted strategies among traders: the   Breakout strategy ! This indicator delivers crystal-clear Buy and Sell signals based on breakouts from key support and resistance zones. Unlike typical breakout indicators
BookMap HeatMap
Roberto Spadim
1 (2)
This Indicator creates a heatmap based on depth of market of the current symbol or another symbol. Other symbol is useful when you trade futures market and a contract has 'mini' and 'full' split. For example, in Brazil (B3 - BMF&Bovespa), WDO and DOL are future Forex contract of BRL/USD (where 1 DOL = 5 WDO) and big banks work mostly with DOL (where liquidity is important). Please use with M1 timeframe , objects are too small to be displayed at higher timeframes (MT5 limit). The number of level
Berma Bands
Muhammad Elbermawi
5 (3)
Berma 波段 (BBs) 指标对于寻求识别和利用市场趋势的交易者来说是一种有价值的工具。通过分析价格与 BBs 之间的关系,交易者可以辨别市场是处于趋势阶段还是区间波动阶段。 访问[ Berma Home Blog ] 了解更多信息。 Berma 带由三条不同的线组成:上 Berma 带、中 Berma 带和下 Berma 带。这些线围绕价格绘制,直观地表示价格相对于整体趋势的变动。这些带之间的距离可以洞察波动性和潜在的趋势逆转。 当 Berma Bands 线相互分离时,通常表明市场正在进入横盘或区间波动时期。这表明缺乏明确的方向性。交易者可能会发现在这些时期内很难识别趋势,因此可能需要等待更清晰的趋势出现。 当 Berma Bands 线汇聚成一条线时,通常表示趋势环境强劲。这种汇聚表明存在明显的方向性偏差,因为价格波动性足以随趋势而变化。交易者可能会发现在这些时期更容易识别潜在的入场点和出场点,因为趋势的势头可以提供有利的交易机会。然而,重要的是要注意整体趋势中的潜在回调或修正。 Berma 带根据价格蜡烛图与上带和下带的相互作用提供明确的买入和卖出信号。当价格蜡烛图首
Royal Scalping Indicator M5
Vahidreza Heidar Gholami
5 (6)
Royal Scalping Indicator is an advanced price adaptive indicator designed to generate high-quality trading signals. Built-in multi-timeframe and multi-currency capabilities make it even more powerful to have configurations based on different symbols and timeframes. This indicator is perfect for scalp trades as well as swing trades. Royal Scalping is not just an indicator, but a trading strategy itself. Features Price Adaptive Trend Detector Algorithm Multi-Timeframe and Multi-Currency Trend Low
ICT, SMC, SMART MONEY CONCEPTS, SMART MONEY, Smart Money Concept, Support and Resistance, Trend Analysis, Price Action, Market Structure, Order Blocks, BOS/CHoCH,   Breaker Blocks ,  Momentum Shift,   Supply&Demand Zone/Order Blocks , Strong Imbalance,   HH/LL/HL/LH,    Fair Value Gap, FVG,  Premium  &   Discount   Zones, Fibonacci Retracement, OTE, Buy Side Liquidity, Sell Side Liquidity, BSL/SSL Taken, Equal Highs & Lows, MTF Dashboard, Multiple Time Frame, BigBar, HTF OB, HTF Market Structure
Volumatic VIDyA MT5
Duc Hoan Nguyen
5 (1)
Special offer : ALL TOOLS , just $35 each! New tools   will be   $30   for the   first week   or the   first 3 purchases !  Trading Tools Channel on MQL5 : Join my MQL5 channel to update the latest news from me Volumatic VIDYA (Variable Index Dynamic Average) 是一款高级指标,旨在跟踪趋势并分析每个趋势阶段中的买卖压力。通过使用可变指数动态平均值 (Variable Index Dynamic Average) 作为核心动态平滑技术,该工具在关键市场结构水平上提供了关于价格和交易量动态的重要洞察。 查看更多 MT4 版本:  Volumatic VIDyA MT4 查看更多产品:    所有产品 To use iCustom for EA, please see here:  Create EA (iCustom) with VO
- Lifetime update free -   Real price is 80$   - 40% Discount ( It is 49$ now ) Contact me for instruction, any questions! Related Product:  Gold Trade Expert MT5 - Non-repaint - I just sell my products in Elif Kaya Profile, any other websites are stolen old versions, So no any new updates or support. Introduction The breakout and retest strategy is traded support and resistance levels. it involves price breaking through a previous level.  The break and retest strategy is designed to help trade
筛选:
无评论
回复评论