PSI Detailed Report
- 指标
- Damyan Malinov
- 版本: 2.1
- 更新: 2 十月 2023
- 激活: 5
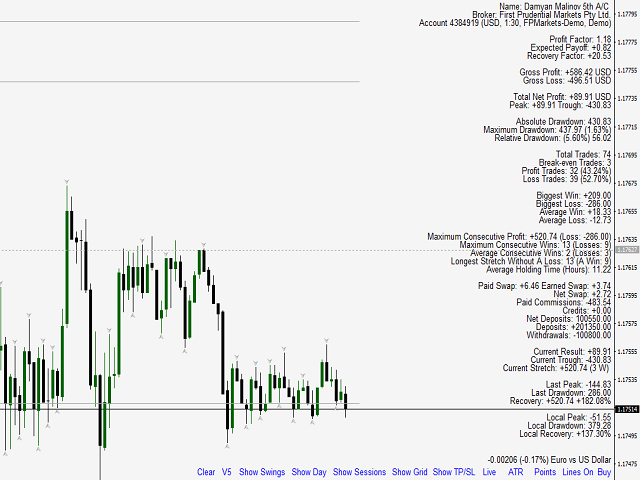
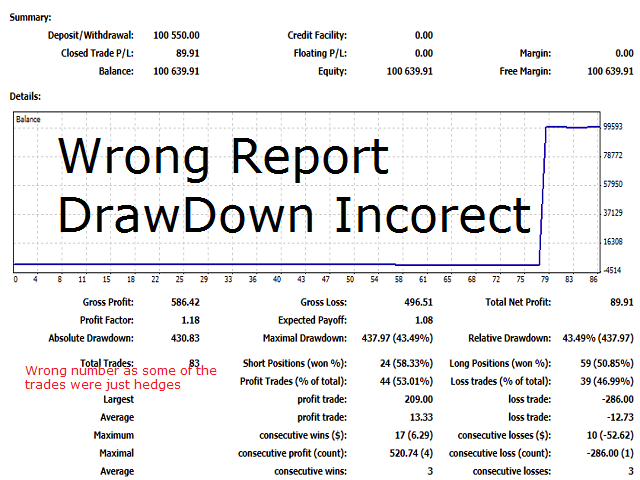
PSI tools delivers new special look aimed to bring Detailed Account Statement for all important statistics. The integrated MT4 is not accurate. It does not account correctly for Deposits, Withdrawals and completely ignores cases like hedged trades, break-even trades, other broker related credits, bonuses and so on events and as a result all statistics like draw-down, total trades, average win size, rate and so on are totally skewed.
PSI corrects these mistakes. In the example below a demo account was aimed to represent such case. The Maximal and Relative Draw-down according to MT4 were whooping 44% while the majority of this draw-down was achieved at time when the account was more then 10 times bigger after a huge deposit. So in a effect all trades were partitioned by their contribution at the account current state. So in reality the draw-down was much smaller in % terms at all times. In addition there are other tools and statistics. Like holding time, consecutive trades, two nearest Peaks and latest recovery against them. This is useful if you follow ICT recommended MM tactics to dial down risk after a loss and dial up only if you recover at least 50% of the latest drop in equity.
You can also target the Report for only one specific instrument and ignore others or add or subtract amounts from the balance to fit your specific needs. Let say you deposited only 20% of your dedicated money at the broker and leave the rest at your account but you trade as if you deposited them fully. So with this indicator your account statistics will be based on the full dedicated amount not what is shown in MT4.
In addition to the Account Report there is an option to totally ignore any Transfers (Deposits, Withdrawals, Broker related funds) and just focus on the statistics with Simulated Starting Amount. It works also in conjunction with focusing option on a particular pair only.
This tool is part of the Position Smart Indicator - a powerful Money Management tool (and much more) both useful for Price Action and Algo traders.
Both have tons of features like mapping Forex Sessions, Average Price, Institutional Levels Grid, Auto Maps Major Highs and Lows, All-time and Daily results, Exposure, Swap, Spread, Commissions, Margin, Stop-out Level and other concepts inspired by the Free YouTube Content of NNFX (No Nonsense Forex) and ICT (The Inner Circle Trader) Channels as well as some of the most popular funded programs and their requirements thus making it very useful and flexible for wide variety of users.
Highly recommended for funded accounts or challenges in order to observe lot size exposure or daily draw-down requirements.