AO unpaid divergences
- 指标
- Diego Arribas Lopez
- 版本: 1.2
- 更新: 1 三月 2024
- 激活: 10
[How to use the Demo version] [MT4 Version]
AO unpaid divergences MT5
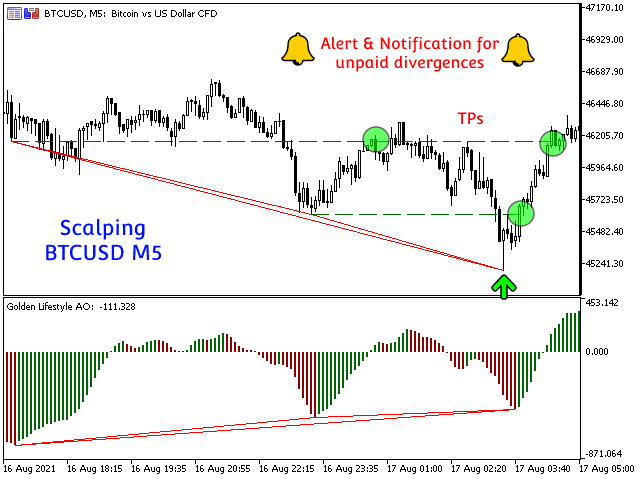
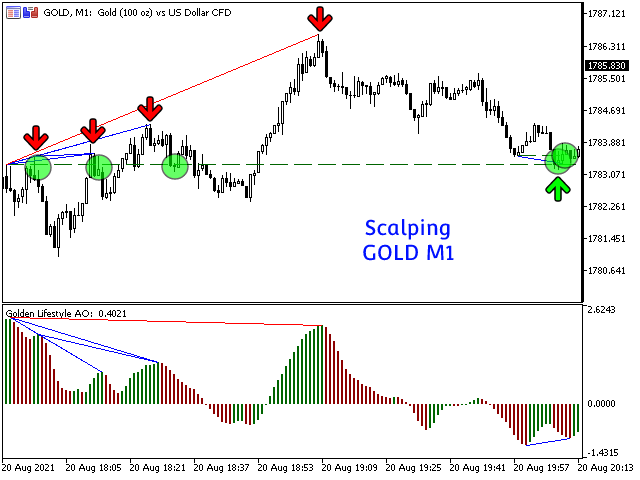
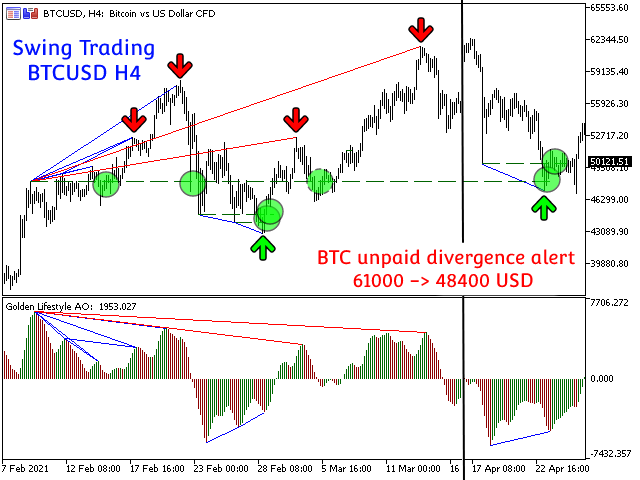
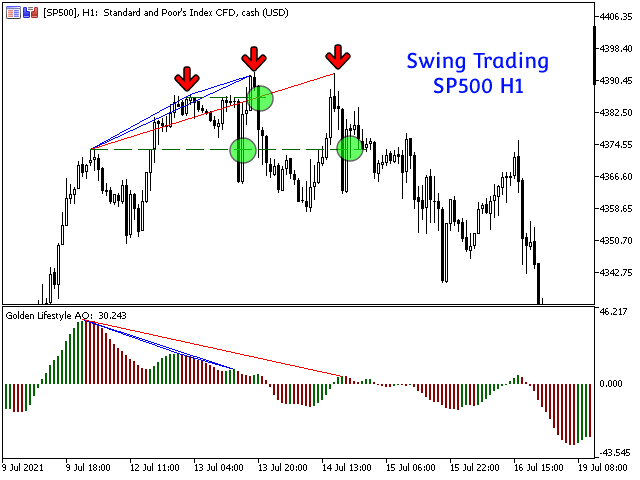
AO unpaid divergences is the first indicator developed to detailed analyze Regular and Hidden Divergences. It uses this analysis to find out possible entry points and targets.
Below some of the characteristics of this indicator:
- Time saving
- Highly customizable
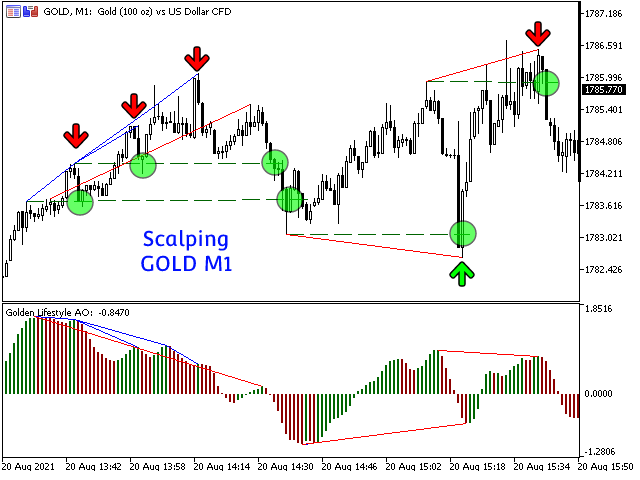
- Working for all pairs (Crypto, Forex, Stocks, Indices, Commodities...)
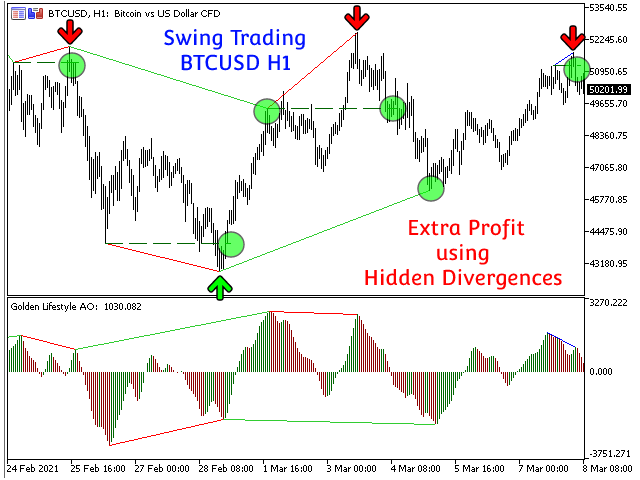
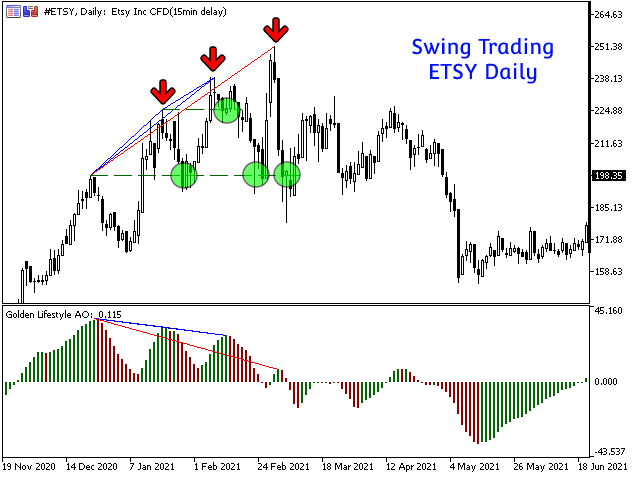
- Suitable for Scalping or Swing trading
- Possible reversal swings
- Alerts and Notifications on MT5 terminal or mobile App
- Non-repainting or backpainting
Input Parameters
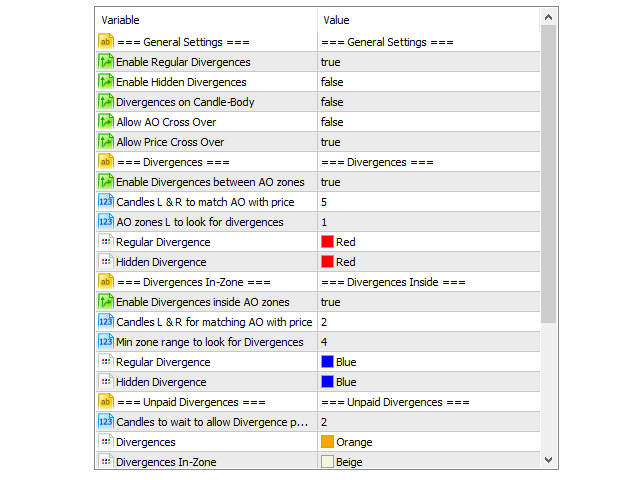
General Settings:
- Enable Regular Divergences - Enable this parameter to analyze Regular Divergences
- Enable Hidden Divergences - Enable this parameter to analyze Hidden Divergences
- Divergences on Candle-Body - True: Divergences are calculated on Candle's Body. False: Divergences are calculated on Candle's High-Low
- Allow AO Cross Over - Enable this parameter to allow Divergences to cross over AO bars
- Allow Price Cross Over - Enable this parameter to allow Divergences to cross over price candles
Divergences:
- Enable Divergences between AO zones - Enable this parameter to analyze Divergences
- Candles L & R to match AO with price - This parameter defines the tolerance in Candle number to match the best AO/price values
- AO zones L to look for divergences - This parameter defines the number of zones to the left of the current zone to look for Divergences
- Enable divergences inside AO zones - Enable this parameter to analyze In-Zone Divergences
- Candles L & R for matching AO with price - This parameter defines the tolerance in Candle number to match the best AO/price values in the In-Zone Divergences
- Min zone range to look for Divergences - This parameter defines the minimum amount of positive or negative consecutive bars of the AO to be considered a Zone
- Candles to wait to allow Divergence paying - This parameter defines the candles to wait before allowing the divergence to be paid. Less than 1 candle can lead to considering the Divergence paid at the moment it is created
- Divergences (Color) - Color for unpaid divergences
- Divergences In-Zone(Color) - Color for unpaid In-Zone divergences
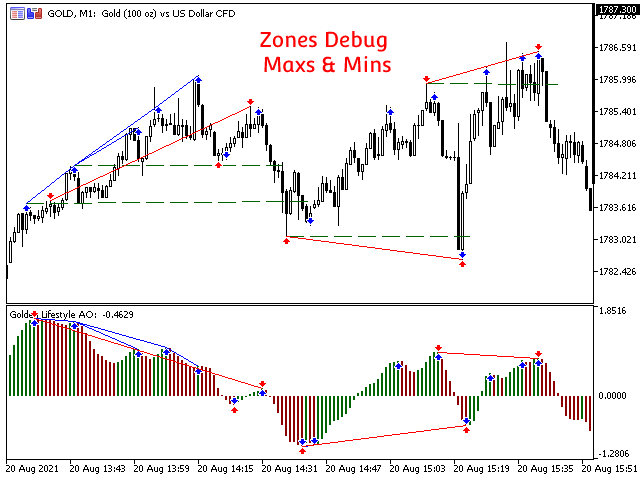
Debug:
- Debug Zones - Enable this parameter to display AO and Price Maxs/Mins recognized by the indicator
- Debug Divergences - Enable this parameter to display already paid divergences
Starting date
- Starting date - Select a starting date for the indicator
- Enable Alerts - Enable this parameter to get notify on your Metatrader terminal if a new unpaid divergence appears
- Enable Notifications - Enable this parameter to get notify Metatrader phone App if a new unpaid divergence appears
Support and questions
Do not hesitate to contact me for any questions and support
Author
Diego Arribas, private investor and speculator, automation engineer in the aerospace industry

отличный индикатор Если использовать вместе с Fear and Greed MT5 отличный союз для торговли