Abiroid MA Stack
- 指标
- Abir Pathak
- 版本: 1.7
- 更新: 8 六月 2023
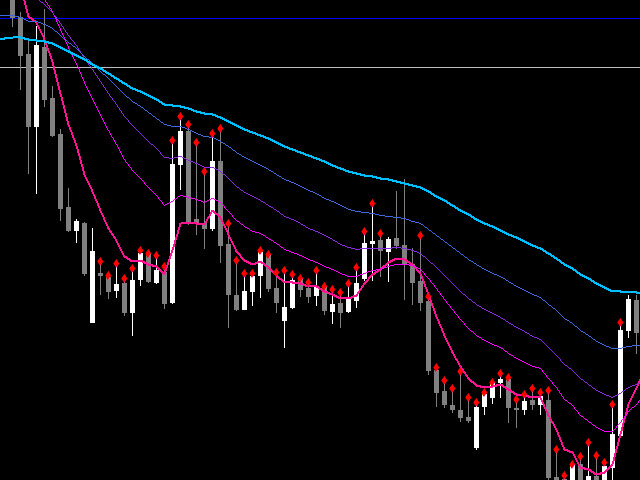
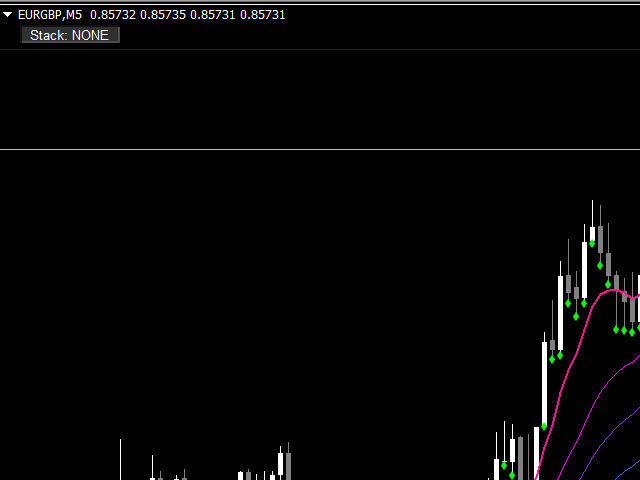
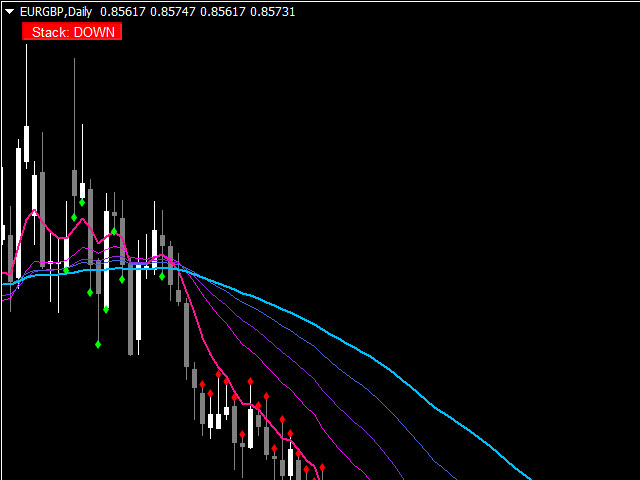
Moving Average Rainbow Stack:
- Free: Single Currency & Single Timeframe MA Stack
Very useful for finding current and higher timeframe trends. Best suited for long term trend based trading.
Use fewer MAs for quick scalping. And not suitable during low volatility. Only use during high volatility and steady trending markets.
Use this to enhance your existing Trend based strategies to find best trends.
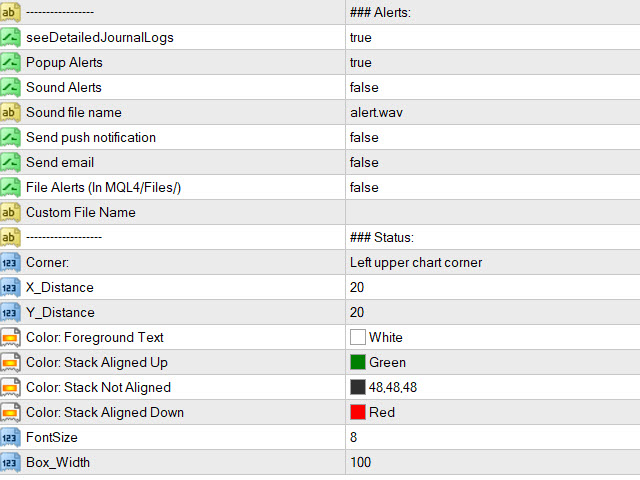
Read detailed description
https://abiroid.com/product/abiroid-ma-stack
Available MTF and Scanner versions.


REAL FANTASTIC TOOLS