Moving Average Crossover Sniper Scanner MT5
- 指标
- Elmira Memish
- 版本: 1.0
- 激活: 5
Moving Average Crossover Scanner and Dashboard For MT5
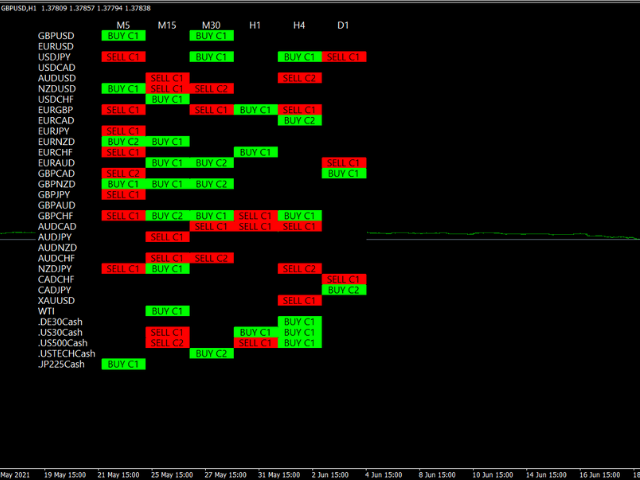
Advanced Moving Average Scanner
Moving Averages Crossover Dashboard
MT4 Version of the product can be downloaded: https://www.mql5.com/en/market/product/69260
The indicator scans the market and sends signals and alerts for Moving Average crossovers, death cross and golden cross.
Crossovers are one of the main moving average ( MA ) strategies.
MA Crossover ( cut ) strategy is to apply two moving averages to a chart: one longer and one shorter. When the shorter-term ( fast MA ) MA crosses above the longer-term ( slow MA ) MA, it's a buy signal, as it indicates that the trend is shifting up. Meanwhile, when the shorter-term MA crosses below the longer-term MA, it's a sell signal, as it indicates that the trend is shifting down.
Unlike some other MA scanners, the MA Crossover Sniper Scanner does not just show ONLY 2 MA crosses.
You can scan 4 different MA crossover conditions.
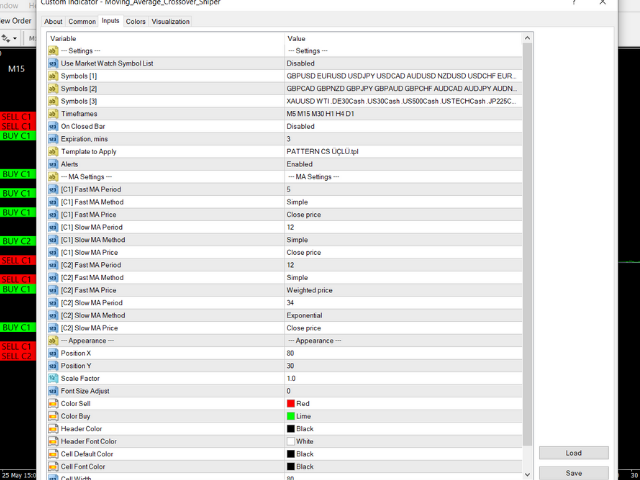
INPUTS:
Market Watch : True/False ( If true, symbols in the market watch will be scanned )
if Market Wacth is "False""
Symbols 1 , 2 and 3 : GBPUSD,EURUSD,USDJPY ( Leave a blank between the pairs. Max 15 symbols for each Symbols Raw)
Timeframes: M1 M5 M15 M30 H1 H4 D1 W1 MN1 ( You can choose the TF and enter manualy. Leave a blank between the TFs)
On Closed Bar: If "Enabled", the indicator waits for the bar close to send signal.
Expiration ( Minutes): Singal will be deleted from the dashboard.
Template to Apply: When you click on the cell, chart will be opened with your template.
Alerts: Desktop and Mobile alerts can be activated.
MA Settings:
C1 Fast and Slow MA. ( Crossover Condition 1 )
C2 Fast and Slow MA. ( Crossover Condition 2 )
Following Signals will be displayed on the dashboard.
"SELL C1" WHEN BEARISH CROSSOVER OF CROSSOEVER SETTING 1
"BUY C1" WHEN BULLISH CROSSOVER OF CROSSOEVER SETTING 1
"SELL C2" WHEN BEARISH CROSSOVER OF CROSSOEVER SETTING 2
"BUY C2" WHEN BULLISH CROSSOVER OF CROSSOEVER SETTING 2
WHEN BOTH C1 AND C2 happens at the same time, this can be considered as "DEATH CROSS" or "GOLDEN CUT"
" BUY GC" and "SELL GC" signals will be displayed on the dashboard.
Appearance: Display Options
You can set different colors, or place the dashboard on the chart by using those options.
It works for every instrument including Stocks, Indices, Commodities,Currencies,Cryptocurrencies
Amazing product with zero lag, and lots of amazing features. It's a must have utility for successful trading. Also the developer is too helpful and gave me absolutely satisfying service.