• 概述
  • 评论
  • 评论 (9)
  • 新特性

Abiroid Supertrend Scanner

Read detailed description and Get Free Demo and extra indicators:

https://abiroid.com/product/abiroid-supertrend-scanner

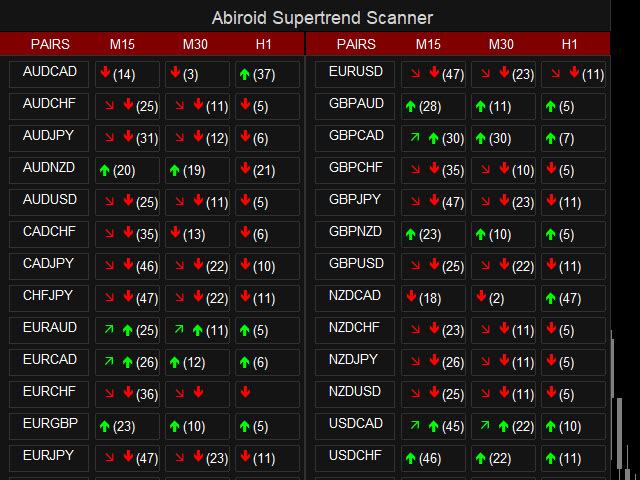
This is a very simplistic Supertrend scanner dashboard.


Features:

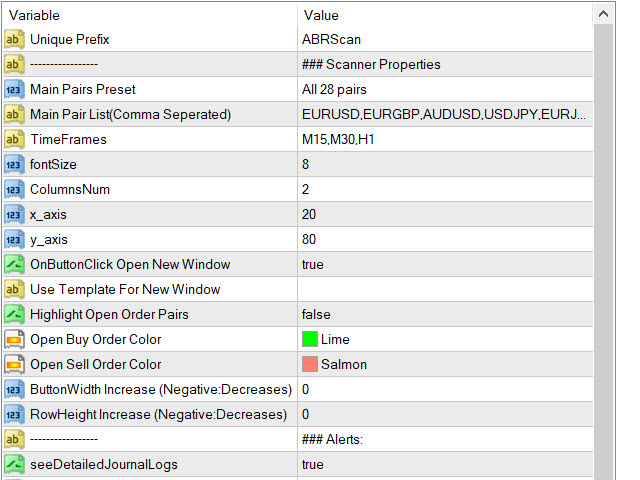
- Select one of In-Built Supertrend Indicators: xSupertrend or Supertrend_CCI (based on CCI).

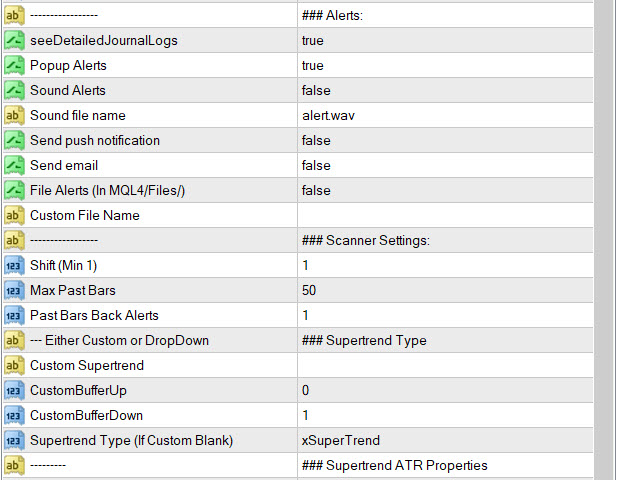
- Or select your own Custom Supertrend indicator. And specify the UpTrend and DownTrend Buffer numbers

- Supertrend Trend Direction Change Scan:

Scan Max Past Bars for Supertrend Change. Show how many bars back the change occurred in a bracket

- Past Bars Back Alerts: Num of bars back for which scanner will send alerts

- Supertrend HTF Align:

Scan Higher timeframes for Trend Direction of Supertrend Indicator and if trends align show a slanting Green/Red Arrow for Up/Down trend


Please note, that this is not a full trading system.

It will help you get initial Supertrend signals and higher timeframe trend alignments.

And it’s to be used with your own Supertrend Strategies.


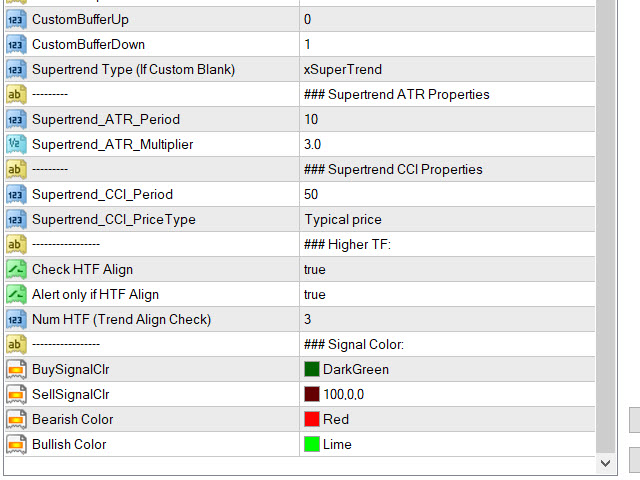
Check HTF Align:Keep true, if you want to check Higher timeframe's Supertrend direction

Num HTF:Number of Higher timeframes to check for trend alignment with current timeframe.

Suppose current TF is M15 and "Num HTF" is 2. And current Supertrend direction is Bullish. It will check M30 and H1 for Bullish Trend as well. And show a slanting Up Green Arrow if Bullish.

Slanting Down Red arrow is for Bearish Alignment.


推荐产品
EZ Binary USJP Pair
Tuan Anh Dao
4 (2)
The indicator allows you to trade binary options. The recommended time frame is М1 and the expiration time is 1,2,3 minutes. The indicator suitable for auto and manual trading. A possible signal is specified as a arrows above/under a candle. You should wait until the candle closes! Arrows are not re-painted Trade sessions: TOKYO section (Half-end) Currency pairs: USD/JPY Working time frame: M1 Expiration time: 1,2,3 minutes. The indicator also shows good results when using the martingale strateg
FREE
History Pattern Search
Yevhenii Levchenko
该指标建立当前报价,可以与历史报价进行比较,并在此基础上进行价格走势预测。指示器有一个文本字段,用于快速导航到所需日期。 选项: 符号 - 选择指标将显示的符号; SymbolPeriod - 选择指标从中获取数据的时段; IndicatorColor - 指示器颜色; HorisontalShift - 由指标绘制的报价移动指定的柱数; Inverse - true 反转引号,false - 原始视图; ChartVerticalShiftStep - 图表垂直移动(键盘上的向上/向下箭头); 接下来是文本字段的设置,您可以在其中输入日期,您可以通过按“回车”立即跳转到该日期。 接下来是文本字段的设置,您可以在其中输入日期,您可以通过按“回车”立即跳转到该日期。
VR Cub
Vladimir Pastushak
VR Cub 这是获得高质量切入点的指标。该指标的开发是为了促进数学计算并简化对仓位入场点的搜索。多年来,该指标所针对的交易策略已被证明其有效性。交易策略的简单性是其巨大的优势,即使是新手交易者也能成功进行交易。 VR Cub 计算开仓点以及获利和止损目标水平,这显着提高了效率和易用性。查看使用以下策略进行交易的屏幕截图,了解简单的交易规则。 设置、设置文件、演示版本、说明、问题解决,可以从以下位置获取 [博客] 您可以在以下位置阅读或撰写评论 [关联] 版本为 [MetaTrader 5] 计算入场点的规则 开仓 要计算入场点,您需要将 VR Cub 工具从最后一个高点拉伸到最后一个低点。 如果第一个点在时间上早于第二个点,交易者等待柱线收于中线上方。 如果第一个点在时间上晚于第二个点,交易者等待柱线收于中线下方。 根据上述条件,严格在 柱线收盘 后建仓。 换句话说,如果我们在小时图上进行交易,那么从最高点到最低点的时间距离必须超过24小时,最高点和最低点之间的点数必须大于或等于平均价格变动每天。 维持和改变市场地位 可以有多个未平仓头寸;每个头寸都可以单独修改。 VR Cu
TrendPlus
Sivakumar Subbaiya
4.21 (14)
Trend Plus   Trendplus  Indicator   Time Frame: Suitable for any time frame.  Purpose: Trend Prediction. Blue and red candle indicate the buy and sell call respectively. Buy: When the blue candle is formed buy call is initiated. close the buy trades when the next red candle will formed.   Sell: When the Red candle is formed Sell call is initiated. close the Sell trades when the next blue candle will formed.   Happy trade!!
FREE
Trend PA
Mikhail Nazarenko
5 (3)
The Trend PA indicator uses   Price Action   and its own filtering algorithm to determine the trend. This approach helps to accurately determine entry points and the current trend on any timeframe. The indicator uses its own algorithm for analyzing price changes and Price Action. Which gives you the advantage of recognizing, without delay, a new nascent trend with fewer false positives. Trend filtering conditions can be selected in the settings individually for your trading style. The indicator
这是一个预测蜡烛收盘价的指标。 该指标主要用于 D1 图表。 该指标适用于传统外汇交易和二元期权交易。 该指标可以用作独立的交易系统,也可以作为您现有交易系统的补充。 该指标分析当前蜡烛,计算蜡烛本身内部的某些强度因素,以及前一根蜡烛的参数。 因此,该指标预测市场走势的进一步方向和当前蜡烛的收盘价。 由于这种方法,该指标既适用于短期盘中交易,也适用于中长期交易。 该指标允许您设置指标在分析市场情况期间将产生的潜在信号的数量。 在指标设置中有一个特殊的参数。 此外,该指标可以通过图表上的消息、电子邮件以及推送通知的形式通知新信号。感谢您的关注!交易愉快! 购买后一定要写信给我! 我会给你我的交易指标的建议! 还可以获得奖金!
Sto Signal AM
Andriy Matviyevs'kyy
5 (1)
This indicator displays Stochastic osc signals on the price chart and allows the user to receive notifications of such signals. The Stochastic indicator is a classic and proven indicator of the technical analysis of the markets. Despite its age, it is still relevant today. Depending on the settings, the indicator allows you to work effectively on various TFs and any markets. Signals are given on fully formed bars and are not redrawn. Custom Parameters: Stochastic_Price (0-1) - The applied pric
FREE
Quantum Heiken Ashi PRO MT4
Bogdan Ion Puscasu
4.43 (7)
介绍     Quantum Heiken Ashi PRO 图表 Heiken Ashi 蜡烛旨在提供对市场趋势的清晰洞察,以其过滤噪音和消除虚假信号的能力而闻名。告别令人困惑的价格波动,迎接更流畅、更可靠的图表表示。 Quantum Heiken Ashi PRO 的真正独特之处在于其创新公式,它将传统烛台数据转换为易于阅读的彩色条。红色和绿色条分别优雅地突出了看跌和看涨趋势,让您能够以非凡的精度发现潜在的进入和退出点。 量子 EA 通道:       点击这里 MT5版本:       点击这里 这一卓越的指标具有以下几个关键优势: 增强清晰度:通过平滑价格波动,Heiken Ashi 金条可以更清晰地反映市场趋势,使您更容易识别有利的交易机会。 减少噪音:告别经常导致错误信号的不稳定价格变动。 Quantum Heiken Ashi 指标可过滤噪音,使您能够做出更明智的交易决策 无缝集成:Heiken Ashi 指标专为 MetaTrader 开发,可无缝集成到您的交易平台中。它用户友好、高度可定制,并且与您的其他交易指标和过滤器兼容 无论您是寻求新优势的经验
Trend Catcher with Alert
Issam Kassas
4.79 (63)
趋势捕捉器: 具有警示指标的趋势捕捉器策略是一种多功能的技术分析工具,可帮助交易员识别市场趋势和潜在的进出点。它采用动态趋势捕捉器策略,根据市场条件进行调整,清晰地呈现趋势方向。交易员可以自定义参数,以符合其偏好和风险容忍度。该指标有助于识别趋势,发出潜在的反转信号,充当跟踪止损机制,并提供实时警报,以便及时应对市场。 具有警示指标的趋势捕捉器策略是一种多功能的技术分析工具,可帮助交易员识别市场趋势和潜在的进出点。它采用动态趋势捕捉器策略,根据市场条件进行调整,清晰地呈现趋势方向。交易员可以自定义参数,以符合其偏好和风险容忍度。该指标有助于识别趋势,发出潜在的反转信号,充当跟踪止损机制,并提供实时警报,以便及时应对市场。 特点: 趋势识别:信号牛市趋势和熊市趋势。 趋势反转:当蜡烛颜色从牛市变为熊市,反之亦然时,提醒可能的反转。 实时警报:为新趋势识别生成警报。 建议: 货币和货币对:EURUSD,AUDUSD,XAUUSD... 时间框架:H1。 账户类型:任何ECN,低点差账户。
FREE
Email Drawdown Alert
Roman Starostin
5 (15)
Free informative Indicator-helper. It'll be usefull for traders who trade many symbols or using grid systems (Averaging or Martingale). Indicator counts drawdown as percent and currency separate. It has a number of settings: Count deposite drawdown according equity value and send e-mail or notifications to user if DD more than set; Sending e-mail when max open orders reached; Shows price and remaining pips amount before MarginCall on current chart and Account generally; Display summary trade lot
FREE
Title : UT_Bot - ATR-Based Trading Indicator Introduction : Discover the power of "UT_Bot," the ultimate trading indicator that leverages the Average True Range (ATR) to provide unparalleled accuracy in your trading decisions. If you're seeking a more reliable alternative to the Super Trend indicator, look no further. UT_Bot is your key to precision trading. Key Features : ATR-Powered Precision: UT_Bot uses the ATR to deliver accurate signals that adapt to market volatility. Enhanced Trend Detec
Trend Ray
Andriy Sydoruk
The indicator shows the potential trend direction by cyclical-wave dependence. Thus, all the rays of the intersection will be optimal rays, in the direction of which the price is expected to move, taking into account the indicator period. Rays can be used as a direction for potential market movement. But we must not forget that the approach must be comprehensive, the indicator signals require additional information to enter the market.
Rainbow MT4
Jamal El Alama
Rainbow MT4 is a technical indicator based on Moving average with period 34 and very easy to use. When price crosses above MA and MA changes color to green, it’s a signal to buy. When price crosses below MA and MA changes color to red, it’s a signal to sell. The Expert advisor ( Rainbow EA MT4) based on Rainbow MT4 indicator, as you can see in the short video below is now available here .
FREE
我们为您提供一个指标"蜡烛收盘台",它将成为您在贸易领域不可或缺的助手。 这就是为什么知道蜡烛何时关闭会有所帮助的原因: 如果你喜欢使用蜡烛花纹进行交易,你就会知道蜡烛何时关闭。 此指标将允许您检查是否形成了已知模式以及是否存在交易的可能性。 该指标将帮助您做好市场开放和市场关闭的准备。 可以设置一个计时器来创建计划新闻的预览,这样就可以检查市场对此的反应。 您可以设置指示灯,以便在蜡烛关闭前几秒钟发送警报/警告。 通知/警报/警报可以发送到: 屏幕警报 电子邮件 移动应用 MT4烛台计时器指示器为什么有用 那么烛台计时器什么时候有用呢?如果你长期交易,你可能不需要蜡烛计时器指示器,因为你的参赛不会受到一分钟或一小时的太大影响。但是,如果你在短时间内是黄牛或交易员,那么你知道时机非常重要。 外汇市场24小时开放,只在周末关门,有些策略可能会受到您入仓时出现错误时机的严重影响。 MT4蜡烛计时器指示器可以显示当前蜡烛中的剩余时间,以便为下一次蜡烛打开做好准备。 可以从这一指标中受益的一些情况例子有: 预定消息传出 地理市场开闭 预定发生的事件,通常是金融、经济或
Trendiness Index
Libertas LLC
5 (3)
"The trend is your friend" is one of the best known sayings in investing, because capturing large trendy price movements can be extremely profitable. However, trading with the trend is often easier said than done, because many indicators are based on price reversals not trends. These aren't very effective at identifying trendy periods, or predicting whether trends will continue. We developed the Trendiness Index to help address this problem by indicating the strength and direction of price trend
Owl smart levels
Sergey Ermolov
4.63 (54)
MT5版本  |  FAQ Owl Smart Levels Indicator   是一個完整的交易系統,包含   Bill Williams   的高級分形、構建正確的市場波浪結構的 Valable ZigZag 以及標記準確入場水平的斐波那契水平等流行的市場分析工具 進入市場和地方獲利。 策略的详细说明 指示灯使用说明 顾问-贸易猫头鹰助手助理 私人用户聊天 ->购买后写信给我,我会将您添加到私人聊天中,您可以在那里下载所有奖金 力量在於簡單! Owl Smart Levels   交易系統非常易於使用,因此適合專業人士和剛開始研究市場並為自己選擇交易策略的人。 策略和指標中沒有隱藏的秘密公式和計算方法,所有策略指標都是公開的。 Owl Smart Levels 允許您快速查看進入交易的信號,突出顯示下訂單的水平並向您發送有關已出現信號的通知。 優點很明顯: 清楚地顯示主要和更高時間框架的趨勢方向。 指示儀器信號的出現。 標記開單、止損設置和固定利潤的水平。 沒有多餘的,只有必要的結構! ZigZag   表示全球趨勢的方向,因此也表示貿易方向。 市場反轉點的短線清楚地表明在
MegaTrends
Sivakumar Subbaiya
1 (1)
Megatrends  Indicator   Time Frame: Suitable for any time frame.  Purpose: Trend Prediction. Blue and red color indicate the buy and sell call respectively. Buy: When the blue line is originating it is opened buy call. Sell: When the Red line is origination it is opened sell call Happy trade!! this indicator is suitable for all time frame, but our recommended time frame to use 1hour and 4 hours, suitable for any chart.
FREE
Binary Option Signal
Yaroslav Varankin
Indicator for binary options arrow is easy to use and does not require configuration works on all currency pairs, cryptocurrencies buy signal blue up arrow sell signal red down arrow tips do not trade during news and 15-30 minutes before their release, as the market is too volatile and there is a lot of noise it is worth entering trades one or two candles from the current period (recommended for 1 candle) timeframe up to m 15 recommended money management fixed lot or fixed percentage of the depo
Master scalping M1
Nataliia Marchuk
Master Scalping M1 is an innovative indicator that uses an algorithm to quickly and accurately determine the trend.The indicator calculates the time of opening and closing positions, the indicator's algorithms allow you to find the ideal moments to enter a deal (buy or sell an asset), which increase the success of transactions for most traders. Benefits of the indicator: Easy to assemble, does not overload the chart with unnecessary information. Can be used as a filter for any strategy. Works on
The indicator displays the data of the Stochastic oscillator from a higher timeframe on the chart. The main and signal lines are displayed in a separate window. The stepped response is not smoothed. The indicator is useful for practicing "manual" forex trading strategies, which use the data from several screens with different timeframes of a single symbol. The indicator uses the settings that are identical to the standard ones, and a drop-down list for selecting the timeframe. Indicator Parame
Cosmic Diviner X Planet
Olena Kondratenko
4 (2)
This unique multi-currency strategy simultaneously determines the strength of trends and market entry points, visualizing this using histograms on the chart. The indicator is optimally adapted for trading on the timeframes М5, М15, М30, Н1. For the convenience of users, the indicator renders the entry point (in the form of an arrow), recommended take profit levels (TP1, TP2 with text labels) and the recommended Stop Loss level. The take profit levels (TP1, TP2) are automatically calculated for
Noize Absorption Index MT4
Ekaterina Saltykova
5 (1)
Noize Absorption Index - is the manual trading system that measures the difference of pressure between bears forces and bulls forces. Green line - is a noize free index that showing curent situation. Zero value of index shows totally choppy/flat market.Values above zero level shows how powerfull bullish wave is and values below zero measures bearish forces.Up arrow appears on bearish market when it's ready to reverse, dn arrow appears on weak bullish market, as a result of reverse expectation. S
MT4 外汇指标 HTF Ichimoku Ichimoku 指标是最强大的趋势指标之一。HTF 表示 - 更高时间框架 此指标非常适合趋势交易者以及与价格行动条目的组合。 HTF Ichimoku 指标允许您将更高时间框架的 Ichimoku 附加到您当前的图表。 上升趋势 - 红线高于蓝线(并且两条线都在云层之上)/ 下降趋势 - 红线低于蓝线(并且两条线都在云层之下) 仅当价格突破 Ichimoku 云层顶部边界时才开买单 仅当价格突破 Ichimoku 云层底部边界时才开卖单 HTF Ichimoku 指标提供捕捉大趋势的机会 // 更多出色的专家顾问和指标可在此处获得: https://www.mql5.com/en/users/def1380/seller // 也欢迎您加入盈利、稳定和可靠的信号 https://www.mql5.com/en/signals/1887493 这是仅在此 MQL5 网站上提供的原创产品。
其中一个数字序列称为“森林火灾序列”。它被公认为最美丽的新序列之一。它的主要特点是该序列避免了线性趋势,即使是最短的趋势。正是这一属性构成了该指标的基础。 在分析金融时间序列时,该指标试图拒绝所有可能的趋势选项。只有当他失败时,他才会认识到趋势的存在并给出适当的信号。这种方法可以让人们正确地确定新趋势开始的时刻。然而,误报也是可能的。为了减少它们的数量,该指标添加了一个额外的过滤器。当新柱打开时会生成信号。在任何情况下都不会发生重绘。 指标参数: Applied Price - 应用价格常数; Period Main - 指标的主要周期,其有效值在 5 - 60 之间; Period Additional - 附加周期,此参数的有效值为 5 - 40; Signal Filter - 附加信号滤波器,有效值 0 - 99; Alerts - 启用后,指示器会在出现新信号时提醒您; Send Mail - 允许指标向电子邮件发送消息; Push - 允许您发送 Push 消息。
Forex Gump
Andrey Kozak
2.83 (6)
Forex Gump is a fully finished semi-automatic trading system. In the form of arrows, signals are displayed on the screen for opening and closing deals. All you need is to follow the instructions of the indicator. When the indicator shows a blue arrow, you need to open a buy order. When the indicator shows a red arrow, you need to open a sell order. Close orders when the indicator draws a yellow cross. In order to get the most effective result, we recommend using the timeframes H1, H4, D1. There
FreqoMeterForecast
Stanislav Korotky
The main idea of this indicator is rates analysis and prediction by Fourier transform. Indicator decomposes exchange rates into main harmonics and calculates their product in future. You may use the indicator as a standalone product, but for better prediction accuracy there is another related indicator - FreqoMaster - which uses FreqoMeterForecast as a backend engine and combines several instances of FreqoMeterForecast for different frequency bands. Parameters: iPeriod - number of bars in the ma
WaveMaster Pro : Advanced Market Analysis Indicator for MetaTrader 4 Overview WaveMaster Pro is an advanced MetaTrader 4 (MT4) indicator engineered to enhance trading strategies by offering a sophisticated analysis of market trends and price movements. By integrating sector analysis, micro wave detection, and price projection capabilities, WaveMaster Pro provides traders with actionable insights for better decision-making. Whether you are a novice trader or a seasoned professional, this tool is
Trend arrow Indicator
NGUYEN NGHIEM DUY
3.23 (13)
Trend arrow Indicator is an arrow Indicator used as an assistant tool for your trading strategy. The indicator analyzes the standard deviation of bar close for a given period and generates a buy or sell signals if the deviation increases. It good to combo with Martingale EA to follow Trend and Sellect Buy Only/Sell Only for EA work Semi-Automatic. You can use this  Indicator with any EAs in my Products.
FREE
This product is a part of  ON Trade Waves Patterns Harmonic Elliot Wolfe you can test free version on EURJPY from this link  Wolf Waves Indicator 探索 Wolf Waves - 您的终极交易工具! 您是否正在寻找一种强大的工具,能够轻松地在任何时间框架上识别 Wolf Waves?不用再找了!我们的 Wolf Waves 指标可以轻松完成这项任务。以下是为您呈现它的理由: 主要特点: 自动检测: 我们的 Wolf Waves 指标使用复杂的算法自动查找关键点并在您的图表上绘制相应的线条。不再需要手动搜索模式。 用户友好: 无论您是专业交易员还是对 Wolf Waves 还不熟悉,我们的指标都非常易于使用。 精准性: 它非常精确,降低了虚假信号的数量,提高了您的信心。 信息丰富: 该指标不仅限于模式检测。它还提供入场点、止损水平和利润目标等重要交易信息,帮助您做出明智的交易决策。 适用于 EA: 如果您进行自动化交易,此指标可以无缝集成
Wise Men Indicator demo
Bohdan Kasyanenko
3.67 (3)
The indicator displays signals according to the strategy of Bill Williams on the chart. Demo version of the indicator has the same features as the paid, except that it can work only on a demo account . Signal "First Wise Man" is formed when there is a divergent bar with angulation.  Bullish divergent bar - with lower minimum and closing price in the upper half. Bearish divergent bar - higher maximum and the closing price at the bottom half. Angulation is formed when all three lines of Alligat
FREE
该产品的买家也购买
Gann Made Easy
Oleg Rodin
4.88 (89)
Gann Made Easy 是一个专业且易于使用的外汇交易系统,它基于使用先生理论的最佳交易原则。 W.D.江恩。该指标提供准确的买入和卖出信号,包括止损和获利水平。您甚至可以使用推送通知在旅途中进行交易。 购买后请联系我!我将免费与您分享我的交易技巧和丰厚的红利指标! 您可能已经多次听说过江恩交易方法。通常 Gann 的理论不仅对于新手交易者而且对于那些已经有一定交易经验的人来说都是非常复杂的东西。这是因为江恩的交易方法在理论上并不那么容易应用。我花了几年时间来完善这些知识,并将最好的原则应用到我的外汇指标中。 该指标非常易于应用。您所需要的只是将其附加到您的图表并遵循简单的交易建议。该指标不断进行市场分析工作并寻找交易机会。当它检测到一个好的入口点时,它会为您提供一个箭头信号。该指标还显示止损和获利水平。 换句话说,当您像先生一样进行交易时,该指标会为您提供最佳江恩建议。江恩亲自告诉你此时此刻该做什么。但最好的部分是您不需要了解任何有关江恩交易原则的知识,因为该指标会为您完成整个市场分析工作。
Gold Stuff
Vasiliy Strukov
4.89 (265)
Gold Stuff 是专为黄金设计的趋势指标,也可用于任何金融工具。 该指标不会重绘,也不会滞后。 推荐时间框架 H1。 在它指标工作全自动专家顾问 EA Gold Stuff。 你可以在我的个人资料中找到它。 重要! 购买后立即与我联系,以获得说明和奖金!   您可以免费收到我们的强力支持和趋势扫描指标的副本,请私信。大部头书! 购买后立即联系我以获得设置和个人奖励!   设置 绘制箭头 - 打开关闭。 在图表上绘制箭头。 警报 - 打开关闭声音警报。 电子邮件通知 - 打开关闭。 电子邮件通知。 Puch-notification - 打开关闭。 推送通知。 接下来,调整色域。 Gold Stuff 是专为黄金设计的趋势指标,也可用于任何金融工具。 该指标不会重绘,也不会滞后。 推荐时间框架 H1。 在它指标工作全自动专家顾问 EA Gold Stuff。 你可以在我的个人资料中找到它。 购买后立即联系我以获得设置和个人奖励!   设置 绘制箭头 - 打开关闭。 在图表上绘制箭头。 警报 - 打开关闭声音警报。 电子邮件通知 - 打开关闭。 电子邮件通
Atomic Analyst
Issam Kassas
5 (3)
首先值得强调的是,该交易指标是非重绘、非延迟的指标,这使其成为手动和机器人交易的理想选择。 用户手册:设置、输入和策略。 Atomic Analyst是一种PA价格行动指标,利用价格的力量和动量来寻找市场上更好的机会。配备了高级过滤器,可帮助去除噪音和假信号,并提高交易潜力。使用多层复杂的指标,Atomic Analyst扫描图表,并将复杂的数学计算转化为任何初学者都能理解并用来做出一致交易决策的简单信号和颜色。 “Atomic Analyst”是专为新手和经验丰富的交易者量身定制的综合交易解决方案。它将高级指标和一流功能融合为一体的交易策略,使其成为所有类型交易者的多功能选择。 日内交易和剥头皮策略:专为快速准确的日内交易和短期交易而设计。 日内和摆动交易策略:可用作追求价格大幅波动的日内和摆动交易者的可靠工具。 多货币和市场:凭借其可靠的精度,在不同的工具和市场上运作。 多个时间框架:可在多个时间框架上使用,性能良好。 稳定性:所有指标均不重绘、不重绘和不滞后,确保可靠的信号。 信号清晰度:提供箭头信号,用于清晰的入场和出场点。 实时警报:通过交易入场、SL和TP警报通知交
Scalper Inside PRO
Alexey Minkov
4.75 (59)
An exclusive indicator that utilizes an innovative algorithm to swiftly and accurately determine the market trend. The indicator automatically calculates opening, closing, and profit levels, providing detailed trading statistics. With these features, you can choose the most appropriate trading instrument for the current market conditions. Additionally, you can easily integrate your own arrow indicators into Scalper Inside Pro to quickly evaluate their statistics and profitability. Scalper Inside
TPSpro RFI Levels
Roman Podpora
4.86 (21)
Reversal First Impulse levels (RFI)    INSTRUCTIONS        RUS       -       ENG              R ecommended to use with an indicator   -   TPSpro  TREND PRO -  Version MT5 A key element in trading is zones or levels from which decisions to buy or sell a trading instrument are made. Despite attempts by major players to conceal their presence in the market, they inevitably leave traces. Our task was to learn how to identify these traces and interpret them correctly. Main functions: Displaying activ
FX Power MT4 NG
Daniel Stein
5 (12)
通过 mql5 和 Telegram 上 的晨间简报获取每日市场更新,包括详细信息和屏幕截图 ! FX Power MT4 NG 是我们长期以来非常受欢迎的货币强度计算器 FX Power 的下一代产品。 这款下一代强度计算器能提供什么?您所喜爱的原版 FX Power 的所有功能 附加功能 黄金/XAU 强度分析 更精确的计算结果 可单独配置的分析周期 可自定义计算限制,以获得更好的性能 为希望查看更多信息的用户提供特殊的多实例设置 无尽的图形设置,可在每个图表中设置您最喜欢的颜色 无数的通知选项,让您再也不会错过任何重要信息 采用 Windows 11 和 macOS 风格的全新圆角设计 神奇的移动指标面板 FX Power 主要功能 所有主要货币的完整强势历史 所有时间框架内的货币强弱历史 所有经纪商和图表的计算结果完全相同 100% 可靠的实时计算 -> 无重绘 可通过下拉列表选择分析时段 通过自定义模式单独配置分析时段 可在一个图表中使用多个实例 可移动 FX Power 显示屏(通过拖放) 适用于高分辨率 QHD、UHD 和 4K 显示器 自动终端配置 针对平板电脑
Currency Strength Wizard
Oleg Rodin
4.91 (46)
货币强度向导是一个非常强大的指标,为您提供成功交易的一体化解决方案。该指标使用多个时间范围内所有货币的数据来计算这个或那个外汇对的力量。此数据以易于使用的货币指数和货币电力线的形式表示,您可以使用它们来查看这种或那种货币的力量。 您所需要的只是将指标附加到您要交易的图表上,该指标将向您显示您交易的货币的真实强度。该指标还向您显示买卖量压力的极值,您可以在顺势交易时利用这些压力。该指标还显示了基于斐波那契的可能目标。该指标可用于各种交易时间范围。该指标支持各种货币对的交易。 该指标为您提供所有类型的警报,包括推送通知。 购买后请联系我。我将与您分享我的交易技巧,并免费为您提供丰厚的红利指标! 祝您交易愉快,获利丰厚!
Quantum Breakout Indicator PRO
Bogdan Ion Puscasu
4.96 (26)
介绍     Quantum Breakout PRO   ,突破性的 MQL5 指标,正在改变您交易突破区域的方式!   Quantum Breakout PRO 由拥有超过 13 年交易经验的经验丰富的交易者团队开发,旨在通过其创新和动态的突破区域策略将您的交易之旅推向新的高度。 量子突破指标将为您提供带有 5 个利润目标区域的突破区域的信号箭头,以及基于突破框的止损建议。 它既适合新手交易者,也适合专业交易者。 量子 EA 通道:       点击这里 MT5版本:   点击这里 重要的!购买后请私信我领取安装手册。 建议: 时间范围:M15 货币对:GBPJPY、EURJPY、USDJPY、NZDUSD、XAUUSD 账户类型:ECN、Raw 或 Razor,点差极低 经纪商时间:GMT +3 经纪商:IC Markets、Pepperstone with Raw 和 Razor 的点差最低 规格: 不重漆! 最多 5 个建议利润目标区域 建议止损水平 可定制的盒子。您可以设置自己的 Box Time Start 和 Box Time E
Advanced Currency Strength28 Indicator
Bernhard Schweigert
4.91 (666)
目前26%的折扣 任何新手或专家交易者的最佳解决方案! 这个指标是一个独特的、高质量的、可负担得起的交易工具,因为我们纳入了一些专有的功能和一个新的公式。只需一个图表,你就可以读出28个外汇对的货币强度!想象一下,你的交易将如何得到改善,因为你的交易是在你的手中进行的。想象一下,你的交易将如何改善,因为你能够准确地确定新趋势或剥头皮机会的触发点? 用户手册:点击这里  https://www.mql5.com/en/blogs/post/697384 这是第一本,原版的! 不要买一个毫无价值的崇拜者的克隆品。 特别的 子窗口中的箭头显示强劲的货币势头GAP将指导你的交易! 当基础货币或报价货币处于超卖/超买区域(外盘斐波那契水平)时,在个人图表的主窗口中出现警告信号。 当货币力量从外围区间回落时,回撤/反转警报。 十字星模式的特别警报 可选择多个时间框架,以快速查看趋势! 货币强度线在所有的时间框架中都非常平稳,当使用较高的时间框架来识别总体趋势,然后使用较短的时间框架来确定精确的入口时,效果非常好。你可以根据自己的意愿选择任何时间框架。每个时间框架都由其自身进
GOLD Impulse with Alert
Bernhard Schweigert
4.56 (9)
这个指标是我们2个产品 Advanced Currency IMPULSE with ALERT  +   Currency Strength Exotics 的一个超级组合。 它适用于所有时间框架,并以图形方式显示8种主要货币和一种符号的强势或弱势冲动! 该指标专门用于显示任何符号的货币强度加速,如黄金、异国货币对、商品、指数或期货。这是它的第一个指标,任何符号都可以被添加到第9行,以显示黄金、白银、石油、DAX、US30、MXN、TRY、CNH等的真实货币强度加速(冲动或速度)。 建立在新的基础算法上,它使识别和确认潜在的交易更加容易。这是因为它以图形方式显示了一种货币的强势或弱势是否正在加速,并测量了这种加速的速度--把它想象成你汽车中的速度表。当你加速时,事情显然会发生得更快,这在外汇市场上也是一样的,即如果你配对的货币正在向相反的方向加速,你就会发现一个潜在的有利可图的交易。 动态市场斐波那契28水平被用作警报触发器,将适应市场活动。如果冲动击中黄色触发线,你将收到警报。然后你就知道作为一个交易员应该做什么。货币对和方向已经给出。只需点击警报按钮,就可以
首先,值得强调的是,这个交易工具是非重绘、非重画和非滞后的指标,非常适合专业交易。 在线课程,用户手册和演示。 智能价格行动概念指标是一个非常强大的工具,既适用于新手,也适用于经验丰富的交易者。它将超过20个有用的指标合并到一个指标中,结合了高级交易思想,如内圈交易员分析和智能资金概念交易策略。该指标侧重于智能资金概念,提供有关大型机构交易方式的见解,帮助预测它们的动向。 它在流动性分析方面尤其擅长,有助于理解机构的交易方式。它擅长预测市场趋势,并仔细分析价格波动。通过将您的交易与机构策略对齐,您可以更准确地预测市场走向。该指标多才多艺,擅长分析市场结构,识别重要的订单区块,并识别各种模式。 它擅长识别BOS和CHoCH等模式,理解动量的转变,并突出显示供需强劲的关键区域。它还擅长发现强大的不平衡,并分析价格创造更高高点或更低低点的模式。如果您使用斐波那契回撤工具,该指标可以满足您的需求。它还可以识别相等的高点和低点,分析不同的时间框架,并通过仪表板显示数据。 对于使用更高级策略的交易者,该指标提供了工具,如公平价值差指标和优惠和折扣区域的识别。它特别关注高时间框架订单
M1 Arrow
Oleg Rodin
5 (14)
M1 Arrow - 基于市场的两个基本原则的盘中策略。 该算法基于使用附加过滤器对交易量和价格波动的分析。该指标的智能算法仅在两个市场因素合二为一时才会发出信号。该指标使用较高时间框架的数据计算 M1 图表上某个范围的波浪。为了确认波浪,该指标使用了成交量分析。 从理论上讲,该指标可以与其他时间框架一起使用,但您需要考虑到该指标最初是为在 M1 上交易而开发的这一事实。 该指标是一个现成的交易系统。交易者所需要的只是跟随信号。此外,该指标可以成为您自己的交易系统的基础。交易仅在分钟图表上进行。 尽管指标使用 MTF 原理,但指标算法尽可能稳定。 购买后,一定要写信给我!我将与您分享我的交易设置和建议!祝您交易成功!感谢您的关注!
TPSproTREND PrO
Roman Podpora
4.78 (18)
TPSpro TRENDPRO  - is a trend indicator that automatically analyzes the market and provides information about the trend and each of its changes, as well as giving signals for entering trades without redrawing! The indicator uses each candle, analyzing them separately. referring to different impulses - up or down impulse. Exact entry points into transactions for currencies, crypto, metals, stocks, indices!  -  Version MT5               DETAILED DESCRIPTION                R ecommended to use with
Advanced Supply Demand
Bernhard Schweigert
4.92 (313)
现在优惠 33%! 任何新手或专业交易者的最佳解决方案! 该指标是一款独特、高质量、且价格合理的交易工具,因为我们已经整合了许多专有功能和新公式。 依据此更新,您将能够显示双重时间帧区域。 您不仅可以显示一个较高的时间帧,还可以同时显示图表时间帧,加上更高的时间帧:显示嵌套时区。 供需双方所有交易者都会喜欢它。 :) 重要信息披露 高级供需的最大潜力,请访问 https://www.mql5.com/zh/blogs/post/720245   想象您的交易如何得以改善,是因为您能够精准定位入场或目标位吗? 构建于新的底层算法,它可以更轻松地识别出买卖双方之间的潜在失衡。 这是因为它以图形方式展示供需最强劲区域,及其过去的表现(显示旧区域)。 这些功能旨在帮助您更轻松地发现最佳入场区域和价位。 现在您可以针对您的交易品种和时间帧来优化和编辑区域强度! 高级供需指标适用于所有产品和时间帧。 它是一个新的公式,非常新的功能是两个区域强度函数可由用户输入进行调整! 这在交易中是一大优势。 当您学习如何使用专有功能,例如带有价格游离最小 X 因子的区域强度时,您能够判断该区域强劲与否。 供
Trend Punch
Mohamed Hassan
5 (17)
Manual guide:   Click here WEEK SALE PROMO:   $59 ONLY!  -- Next price is  $120 .  This indicator is unstoppable when combined with our other indicator called  Support & Resistance . After purchase, send us a message and you will get it   for  FREE as a BONUS! I like to use Trend Punch on XAUUSD on the M1 timeframe & higher ones!  Introducing Trend Punch , the revolutionary forex trend indicator that will transform the way you trade! Trend Punch is uniquely designed to provide pre
Cycle Sniper
Elmira Memish
4.41 (37)
NEW YEAR SALE PRICE FOR LIMITED TIME!!! Please contact us after your purchase and we will send you the complimentary indicators to complete the system Cycle Sniper is not a holy grail but when you use it in a system which is explained in the videos, you will feel the difference. If you are not willing to focus on the charts designed with Cycle Sniper and other free tools we provide, we recommend not buying this indicator. We recommend watching the videos about the indiactor and system before pu
目前八折优惠! 对任何新手或专家交易者来说都是最好的解决方案! 这个仪表板软件适用于28种货币对。它基于我们的两个主要指标(高级货币强度28和高级货币冲动)。它对整个外汇市场提供了一个伟大的概述。它显示高级货币强度值,货币运动速度和28个外汇对在所有(9)时间段的信号。想象一下,当你可以使用图表上的单一指标观察整个市场,以确定趋势和或剥头皮的机会时,你的交易将得到改善 我们已经在这个指标中建立了一些功能,使你更容易识别强势和弱势货币,同时识别和确认潜在的交易。该指标以图形方式显示货币的强势或弱势是增加还是减少,以及它在所有时间段的表现。 增加的新功能是动态市场斐波那契水平,它适应当前的市场条件变化,这是一个已经在我们的高级货币强度28和高级货币冲动指标中使用的成熟的加分项。 在交易时,总是将弱势货币和强势货币配对,这个新指标将帮助你做到这一点。 用户手册:点击这里  https://www.mql5.com/en/blogs/post/708783 特点  显示每个时间段的ACS28和GAP-speed(冲动)的货币强度值。 列:颜色代码以7种颜色
Trend Screener
STE S.S.COMPANY
4.83 (90)
趋势指标,趋势交易和过滤的突破性独特解决方案,所有重要趋势功能都内置在一个工具中! 它是 100% 非重绘多时间框架和多货币指标,可用于所有符号/工具:外汇、商品、加密货币、指数、股票。 趋势筛选器是有效的指标趋势跟踪指标,它在图表中提供带有点的箭头趋势信号。 趋势分析器指标中可用的功能: 1.趋势扫描仪。 2. 具有最大利润分析的趋势线。 3.趋势货币强度计。 4. 带有警报的趋势反转点。 5. 带有警报的强趋势点。 6. 趋势箭头 每日分析示例,每日信号表现...等与我们的趋势筛选指标,可以在这里找到: 点击这里 限时优惠:Trend Screener Indicator 仅售 50 美元且终身可用。原价 125$) 通过访问我们的 MQL5 博客,您可以找到我们所有的高级指标以及分析示例、每日信号表现...等。 : 点击这里 我们的趋势系统由 2 个指标组成: 1. Trend Screener Indicator:显示趋势仪表盘、图表中的趋势线、入场点...等。 2. Trend Line Map Indicator:显示买卖作为仪表板,活动信号盈利/亏损
RelicusRoad Pro
Relicus LLC
4.73 (140)
现在$ 147(更新后增加到$ 499) - 无限帐户(PC或Mac) RelicusRoad 用户手册 + 培训视频 + 访问 Private Discord Group + VIP 身份 一种看待市场的新方式 RelicusRoad 是世界上最强大的外汇、期货、加密货币、股票和指数交易指标,为交易者提供保持盈利所需的所有信息和工具。我们提供技术分析和交易计划,帮助每一位交易者取得成功,从初学者到高级。它是一个关键的交易指标,可以提供足够的信息来预测未来的市场。我们相信一个完整的解决方案,而不是图表上几个没有意义的不同指标。这是一个多合一指标,显示无与伦比且非常准确的信号、箭头 + 价格行为信息。 RelicusRoad 基于强大的人工智能,提供缺失的信息和工具来教育您并使您成为交易专家,成为成功的交易者。 几乎所有技术指标都滞后,这意味着它们只能报告已经发生的事情。因此,他们只确认您过去可以看到的价格已经在哪里。我们相信领先指标可以预测未来价格,而无需重新绘制,也不要过度依赖可能改变并导致重新绘制的滞后指标。如果您根据滞后指标进行交易并建立头寸,您就知道您已
IX Power MT4
Daniel Stein
5 (6)
IX Power 终于将 FX Power 的无与伦比的精确性带到了非外汇交易符号中。 它能准确判断您喜爱的指数、股票、商品、ETF 甚至加密货币的短期、中期和长期趋势强度。 您可以 分析 终端提供的 一切 。试试吧,体验一下您在交易时如何把握 时机 。 IX Power 主要功能 100% 精确的非重绘计算结果 - 适用于您终端中的所有交易符号 下拉式选择预配置以及可单独配置的强度分析周期 通过电子邮件、消息和手机通知的无数种通知选项 可访问的 EA 请求缓冲区 可自定义计算限制,以获得更好的性能 为希望查看更多信息的用户提供特殊的多实例设置 无尽的图形设置,让您在每个图表中都能找到最喜欢的颜色 采用 Windows 11 和 macOS 风格的圆角新面板设计 神奇的移动指标面板,可在子窗口和主图表之间无缝移动 适用于高分辨率 QHD、UHD 和 4K 显示器,并针对平板电脑和触摸屏进行了优化 IX Power 参数 最重要的参数不言自明,但我们很快会在另一篇文章中为您提供所有 IX Power 参数的完整说明。 使用别名 "参数可为技术交易
Indicator : RealValueIndicator Description : RealValueIndicator is a powerful tool designed specifically for trading on the EURUSD pair. This indicator analyzes all EUR and USD pairs, calculates their real currency strength values, and displays them as a single realistic value to give you a head start on price. This indicator will tell you moves before they happen if you use it right. RealValueIndicator allows you to get a quick and accurate overview of the EURUSD currency pair tops and bottoms,
Advanced Currency IMPULSE with ALERT
Bernhard Schweigert
4.91 (495)
目前31%的折扣!! 对任何新手或专家交易者来说都是最好的解决方案! 这个指标是一个独特的、高质量的、负担得起的交易工具,因为我们已经纳入了一些专有的功能和一个秘密的公式。只需一张图表,它就能给出所有28种货币对的警报。想象一下,你的交易将如何改善,因为你能够准确地确定新趋势或剥头皮机会的触发点 建立在新的基础算法上,它使识别和确认潜在交易变得更加容易。这是因为它以图形方式显示了一种货币的强势或弱势是否正在加速,并测量了这种加速的速度--把它想象成你汽车中的速度表。当你加速时,事情显然会发生得更快,这在外汇市场上也是一样的,即如果你配对的货币正在向相反的方向加速,你就会发现一个潜在的有利可图的交易。 货币动量的垂直线和箭头将指导你的交易! 动态的市场斐波那契23水平被用作警报触发器,将适应市场活动。如果冲动触及黄色触发线,您将在MetaTrader或您的电子邮件或推送警报中收到警报。然后你就知道作为一个交易员应该做什么。货币对和方向已经给出。只要点击警报按钮,就可以切换到该货币对或打开一个新的图表,以便进一步分析。警报级别可以通过用户输入来改变,可以选择3个敏感度级别
Quantum Trend Sniper Indicator MT4
Bogdan Ion Puscasu
4.6 (40)
介绍   量子趋势狙击指标 ,突破性的 MQL5 指标,正在改变您识别和交易趋势反转的方式!由拥有超过13年交易经验的资深交易员团队开发,     量子趋势狙击指标   旨在通过其创新的方式以极高的准确度识别趋势反转,将您的交易之旅推向新的高度。 ***购买量子趋势狙击指标,即可免费获得量子突破指标!*** 当量子突破指标识别出趋势反转时,它会向您发出警报和信号箭头,并建议您三个止盈水平。 它既适合新手交易者,也适合专业交易者。 量子 EA 通道:       点击这里 MT5版本:       点击这里 建议: 时间范围:  所有时间范围。为了获得最佳结果,我们建议在 M15、M30 和 H1 时间范围内使用它。 货币对:欧元兑美元、英镑兑美元、澳元兑美元、欧元兑英镑, EURAUD, XAUUSD 账户类型:ECN、Raw 或 Razor,点差极低 经纪时间:任意 经纪商:IC Markets、Pepperstone with Raw 和 Razor 的点差最低 建议止损:50 点 建议止盈水平:20 点、50 点和 1
Trend Line Map Pro
STE S.S.COMPANY
4.73 (15)
趋势线图指标是趋势筛选器指标的插件。它用作趋势筛选器(趋势线信号)生成的所有信号的扫描仪。 它是基于趋势筛选器指标的趋势线扫描仪。如果您没有 Trend Screener Pro Indicator ,Trend Line Map Pro 将无法使用。 通过访问我们的 MQL5 博客,您可以下载趋势线图指标的免费版本。购买前试用,不受 Metatrader Tester 限制。 :    点击这里 1. 容易获得的优势 根据货币和时间范围显示买入和卖出信号。 评估自图表中出现箭头以来价格上涨或下跌的点数。 (趋势筛选指标箭头) 显示信号的时序。 获取多时间范围和多货币警报以购买和出售警报。 2. 如何使用趋势线图 如何显示买卖信号仪表板? 如果您有任何问题或需要帮助,请通过私信联系我。 作者 SAYADI ACHREF,金融科技软件工程师,Finansya 创始人。
Market Swing Index MSI
Elias Mtwenge
5 (1)
JULY OFFER 80% OFF next price for unlimited version will be 17000$. This is the only time you can get this institutional and professional indicator at this price for unlimited version. Don't dare to miss this. The tool I am about to introduce to you you can't compare it with other tools due to its strategy and accuracy level in predicting the next price directional movement . This tool is designed for serious traders who have decided to make a difference through trading. Be the next person to wi
TrendMaestro
Stefano Frisetti
5 (3)
note: this indicator is for METATRADER4, if you want the version for METATRADER5 this is the link:  https://www.mql5.com/it/market/product/108106 TRENDMAESTRO ver 2.4 TRENDMAESTRO recognizes a new TREND in the bud, he never makes mistakes. The certainty of identifying a new TREND is priceless. DESCRIPTION TRENDMAESTRO identifies a new TREND in the bud, this indicator examines the volatility, volumes and momentum to identify the moment in which there is an explosion of one or more of these data a
Legacy of Gann
Pavel Zamoshnikov
4.85 (13)
The indicator very accurately determines the levels of the possible end of the trend and profit fixing. The method of determining levels is based on the ideas of W.D.Gann, using an algorithm developed by his follower Kirill Borovsky. Extremely high reliability of reaching levels (according to K. Borovsky  - 80-90%) Indispensable for any trading strategy – every trader needs to determine the exit point from the market! Precisely determines targets on any timeframes and any instruments (forex, met
FX Volume
Daniel Stein
4.61 (36)
通过 mql5 和 Telegram 上 的 " 晨间简报 "获取每日市场更新,包括详细信息和屏幕截图 ! 外汇交易量(FX Volume)是第一个也是唯一一个从经纪商角度真正洞察市场情绪的交易量指标。 直接在您的图表上看到这些信息是真正改变游戏规则和突破性的交易解决方案。 受益于独特的市场数据洞察,如 比率(Ratios )显示货币多头和空头头寸的比率(百分比 比率变化 显示所选时间段内的多头比率及其百分比变化 总交易量 显示货币的总交易量(多头和空头),以手为单位 多头 交易量显示货币所有多头头寸的交易量 空头 交易量显示所有货币空头头寸的交易量 净多头 显示净多头交易量,即所有多头头寸减去所有空头头寸(以手为单位)。 净多头百分比 显示货币净多头交易量的变化 请阅读我们的基本教程 -> "如何使用外汇交易量进行交易 " 获取更多信息,如常见问题、交易技巧和教程视频,请访问我们的 外汇交易量公共信息频道 请 安装并运行 SI Connect 以建立与我们数据中心的持续连接 背景信息 我们都知道,外汇是一个分散的市场。这就是为什么我们必须打破常规思维,开发一个独
使用我们的自定义MT4指标发现成功外汇交易的秘诀! 您是否曾经想过如何在外汇市场上取得成功,一贯赚取利润,同时降低风险? 这是您一直在寻找的答案! 允许我们介绍我们的专有MT4指标,该指标将彻底改变您的交易方法。 独特的多功能性 我们的指标专为喜欢Renko和Rangebar Candle编队的用户而设计。 我们了解到,这些图表类型受到许多经验丰富的交易者的青睐,这就是为什么我们的指标与它们无缝集成,从而提供无与伦比的市场分析。 清晰的趋势信号 忘记复杂的分析! 我们的指标利用鲜艳的色彩和清晰的点结构来明确指示市场趋势。 红色和蓝色的点毫无疑问地对价格变动的方向留下了疑问,从而可以在您的交易中快速决策。 与HH/HL HL/LL策略对齐 如果您正在寻求一个指标,该指标无缝地与基于HH/HL和HL/LL结构的策略无缝合作,则不需要更多。 我们的工具不仅确定了这些形式,而且还促进了它们在投资过程中的有效利用。 绝对的清晰度和简单性 我们的首要任务是为您提供一种不仅有效而且易于使用的工具。 我们的指标是为了清晰而设计的,使您可以专注于做出投资决策,而不是
ICT, SMC, SMART MONEY CONCEPTS, SMART MONEY, Smart Money Concept, Support and Resistance, Trend Analysis, Price Action, Market Structure, Order Blocks, BOS/CHoCH,   Breaker Blocks ,  Momentum Shift,   Supply&Demand Zone/Order Blocks , Strong Imbalance, HH/LL/HL/LH,    Fair Value Gap, FVG,  Premium  &   Discount   Zones, Fibonacci Retracement, OTE, Buy Side Liquidity, Sell Side Liquidity, BSL/SSL Taken, Equal Highs & Lows, MTF Dashboard, Multiple Time Frame, BigBar, HTF OB, HTF Market Structure, 
作者的更多信息
Ichimoku Scanner Dashboard
Abir Pathak
4.78 (18)
Dashboard uses Ichimoku Strategy to find best trades. Get extra Indicators/Template: And read more about detailed Product Description and usage here: https://www.mql5.com/en/blogs/post/747457 Please note: I won’t be able to add new settings. It already has 72 settings  :) Some people are using it with their EAs. And iCustom function can only take Max 64 settings. So, I cannot let it grow any further. I’ll definitely be maintaining the code and solving issues. Don’t worry. Please check all
Scanner Dashboard for Best Heiken Ashi VQZZ Arrows Indicator here: https://www.mql5.com/en/market/product/45900 Check out this post for detailed description on How To Use All Indicator extras and template: https://www.mql5.com/en/blogs/post/758259 Please note that if you are using too many pairs/timeframes, then VQZZ calculations might slow down the dashboard. So be careful not to use too many VQZZ Higher timeframes if you are using too many pairs. Also, VQZZ is based on higher timeframes. e
How To Use Check out this post for detailed description on  All Indicator extras and template: https://www.mql5.com/en/blogs/post/758259 The Best Heiken Ashi System is a simple trading system for trading based only two indicators for generate signals: Heiken ashi smoothed and Vqzz indicator multi-timeframe. The system was created for scalping and day trading but can also be configured for higher time frames. As mentioned, the trading system is simple, you get into position when the two ind
FREE
Read detailed description and Get Free Demo and extra indicators: https://abiroid.com/product/abiroid-halftrend-scanner Features: - Halftrend Arrow Scan: Scan Max Past Bars for Halftrend arrows. Show how many bars back the arrow occurred in a bracket - Past Bars Back Alerts: Num of bars back for which scanner will send alerts - Halftrend HTF Align: Scan Higher timeframes for Trend Direction of Halftrend Indicator and if trends align show a slanting Green/Red Arrow for Up/Down trend - Semafor
Features: Get OB/OS Levels from Golden MA Levels Wait for Buy/Sell Start Level Cross Optional: Should price cross Mid Level in earlier bars Optional: Crossing bar High/Medium Volume Optional: MA Stacked to check up/down trend for current TF Optional: NRTR higher timeframes aligned Check Detailed blog post explained: https://www.mql5.com/en/blogs/post/758457 Levels with Buffers available here: Golden MA Levels Indicator: https://www.mql5.com/en/market/product/119515 Note: Arrows/Scanner do
FREE
This indicator is based on Guppy's GMMA Strategy. And shows arrows when GMMA lines cross up or down. To have this indicator and get alerts for Multiple Timeframes and multiple Pairs you can check out the demo of this GMMA Trend Scanner indicator: https://www.mql5.com/en/market/product/38747 About GMMA In Brief: GMMA attempts to identify trends by combining two groups of moving averages with differing time periods: The long-term EMAs (30, 35, 40, 45, 50, and 60) the behaviors of investors that
FREE
About: A Fibonacci indicator is best used with other indicators like Pivots, Support/Resistance etc. Price tends to use Fibo levels as Support or Resistance lines. So, this indicator is very useful to know when price might reverse or if a level is crossed, price might continue the trend. Also, to find the best Take Profit and StopLoss lines. Don't use Fibo Indicator alone for trading as it might not always be accurate. Use it to make your strategies better as a supporting indicator. Settings:
FREE
EMA Multi meter
Abir Pathak
4.92 (13)
How the Indicator Works: This is a Multi-timeframe MA multimeter indicator which studies if price is above or below a particular EMA range and shows Red/Green/Yellow signals. Red: Price Below EMA range Green: Price above range Yellow: Price within range Indicator Properties: EMA Settings: - Default Period is 200. You can change all MA Settings like Period, MA Method (SMA, EMA, etc) or MA Applied Price (Close, Open, etc). - EMA Range list is a comma separated value list for different timefr
FREE
TDI Multi Timeframe Scanner: This Dashboard indicator uses the TDI (Trader's Dynamic Index) Indicator to find best trades. Read detailed How to Use Guide: https://www.mql5.com/en/blogs/post/758252 Extra indicators also available in above post. Checks for: - SharkFin Pattern Free indicator for SharkFin: https://www.mql5.com/en/market/product/42405/ - TDI Trend: Strong/Weak Trend Up/Down - TDI Signal: Strong/Medium/Weak Signal for Buy/Sell - Consolidation - Overbought/Oversold - Volatilit
This is a Sharkfin Arrows Indicator. Get TDI extra indicators here: https://www.mql5.com/en/blogs/post/758252 This indicator will show only Arrows. It does not have TDI symbols on chart. Please get the extras from links above for TDI indicators. TDI Scanner Dash (paid): https://www.mql5.com/en/market/product/41826 About: This Indicator finds the Shark Fin Pattern. It will show an arrow in the current bar if RSI sharkfin is finished forming in previous bar. What is Shark Fin TDI Patt
FREE
3 Level ZZ Semafor Scanner: This is a Dashboard indicator which uses 3LZZ Indicator in the background to find semafors. It will give priority to the semafors3 because they specify a strong signal. So, even if there is a sem1 or 2 on current bar, and if Sem3 was within "Check Previous Bars for Sem 3". Then it will show Sem3 instead. Read about this in detailed post: https://www.mql5.com/en/blogs/post/758250 And get all extra Indicators/Template from above link. Please note: Number of setti
This Indicator uses Center of Gravity (COG) Indicator to find you the best trades. It is a reversal based Swing Indicator which contains an  Arrows Indicator. That you can buy here from Metatrader Market. Check out this blog post for detailed How to Use Guide and links to free scanner: https://www.mql5.com/en/blogs/post/758262 Scanner needs this arrows indicator in same directory to run Copy scanner ex4 in same folder as your Arrows Indicator: MQL4/Indicators/Market/ All extra indicators
This strategy is best used for Trend based trading. While market is trending, price still makes smaller ranges. Darvas boxes show breakouts from these small ranges, while still following the original market trend. Detailed Description: https://www.mql5.com/en/blogs/post/747919 Features: Darvas - Check Darvas Box Breakout -   Check Price Above/Below MA or Darvas Box has crossed MA -   Min, Max Box Height -   Max Distance Between Entry Price and Darvas Box Other Indicators: - NRTR Tren
Features: Find these engulfing patterns: Simple Engulf Stick Sandwich Engulf Three Line Strike Rising Three Morning Star Doji Scanner is useful to make your strategy better. Don't always go by Win/Loss percentage. Because this tool is not based on past results. Basic Settings: For All Patterns You can set: First:Last Candle Ratio This will make sure that the earlier opposite candle is at least this given ratio in height as compared to the engulfing candle. This is not checked for Three Line Stri
FREE
Abiroid Slope MA
Abir Pathak
4.5 (2)
Features: - Moving Average Slope for Max Past Bars - Slope Period - Slope Thresholds - Multiple Slope Type options - See slope visually as a histogram - Info Panel Show/Hide Slope Calculations and Types: The slope value is calculated using the Slope Period. Suppose Period is 5, it will check the MA value for bar (x) and bar (x+5). And find the slope angle between them. Read detailed description about Slope Types and Settings here: https://www.mql5.com/en/blogs/post/747651
FREE
Abiroid MA Stack
Abir Pathak
4.33 (3)
Moving Average Rainbow Stack: Free: Single Currency & Single Timeframe MA Stack Very useful for finding current and higher timeframe trends. Best suited for long term trend based trading. Use fewer MAs for quick scalping. And not suitable during low volatility. Only use during high volatility and steady trending markets. Use this to enhance your existing Trend based strategies to find best trends. Read detailed description https://abiroid.com/product/abiroid-ma-stack Available MTF and Scanner
FREE
Abiroid Multi Slope indicator allows you to calculate a Slope Histogram for any line of any indicator . Histogram is for 1 slope line only, but slope values can be calculated for 3 lines total. To have multiple histograms, add as many Slope indicators for custom indicators as you like on chart. You just need to provide the Indicator name, buffer value, slope's period and max number of bars back. By default it has slope calculation for TDI_v4.ex4 indicator. There is no way to specify parameters f
FREE
Description This scanner uses 3LZZ TRO ex4 and scans for Semafors at given “Shift” bar. Scanner Detailed Settings: https://www.mql5.com/en/blogs/post/747456 Other Settings: Set Periods for Semafor 1,2,3 Set alerts on/off for Semafor 1,2,3 Shift bar (Bar on which semafor is scanned) Refresh After Ticks (Number of ticks when dash is refreshed) This scanner is pretty simplistic version. And a more detailed version with a different strategy is available here: https://www.mql5.com/en/market/produ
FREE
Features: - Current TF GMMA Cross and Trend (Mandatory Check.. G-Up/G-Down) - HTF GMMA Trend Check (Optional.. slanting arrow) - TDI or NRTR Trend Check (Optional.. diamond) Read post for detailed description and downloading extra indicators: https://www.mql5.com/en/blogs/post/758264 Scanner: This is a Dashboard Scanner for finding good trades using the GMMA method as base and TDI method for trend verification. All buttons for all Pairs and Timeframes are clickable and will change the ch
Extreme TMA System with Arrows Indicator And Buy/Sell Boxes with Take Profit & Stop Loss This is a Non-Repainting Arrows Indicator based on the Extreme TMA System. It shows TMA cross signals and the best BUY/SELL signals. Along with the most predicted TakeProfit. And StopLoss based on TakeProfit ratio. Please note: This is an Arrows only Indicator. Dashboard is sold separately here: https://www.mql5.com/en/market/product/44825 About Indicator: This indicator shows BUY/SELL Signal Arrows a
This Scanner Dashboard uses the Extreme TMA System Arrows Indicator to show good BUY/SELL signals. This Product contains dashboard only. It does not contain the Abiroid_Arrow_Extreme_TMA.ex4 indicator. Arrows indicator is not necessary for dashboard to work.  To see arrows, you can buy the arrows indicator separately if you like: https://www.mql5.com/en/market/product/44822 Dash shows Slopes for current and Higher Timeframes. - 1st diamond is current TF. Next diamonds are higher TFs (Please N
Abiroid Profit Percent Series 1: Arrows Indicator Stochastic Ichimoku with ATR Get the Scanner for free. For getting Profit Percentages for Multiple Timeframes and Multiple Pairs. And read detailed description about this indicator and all the settings here. And get extra Indicators, Templates and settings for download: https://abiroid.com/product/profit-percent-stoch-ichimoku-with-atr Watch the tutorial video here: https://youtu.be/C45-9kWPE2Q About The Strategy: This strategy has 3 main
Profit Percent Series 2 The scanner dashboard available here (for  Free) : https://abiroid.com/product/profitpercent-arrows-ma-confluence Read detailed information about MA Confluence here: https://www.mql5.com/en/blogs/post/747474 Here's a post about Common Settings for all Profit Percent Series Indicators: https://www.mql5.com/en/blogs/post/747456 Strategy: Main Signal Indicators (Any One): MA Cross (In-built) or Hull, OBV Cross, Heiken Ashi Cross Validation Indicators (Preferably l
Free scanner available here: https://abiroid.com/product/abiroid-ema-scalper Basic Strategy: 1: MA Crossover Up/Down Arrow (Mandatory Check) Optional Checks: 2: If NRTR Check On (Optional): For BUY: Check if NRTR blue and For SELL: NRTR Red If NRTR Shadow Distance On (Optional): Check price for 'x' bars back: at Shadow distance (ATR Multiplier distance) from NRTR line. 3: If High Volume bar On: Check if High Volume or if Medium (if on) Volume bar 'x' bars back 4: If HTF Trend Align On (Option
This is a Multi-currency multi-timeframe Support/Resistance Scanner Dashboard for Metatrader 4 (MT4) platform. Get all extras and download free demo here: https://abiroid.com/product/abiroid-support-resistance-scanner Read detailed description in post above. Features: Scan Support/Resistance zones (also called Supply/Demand zones) Show alert when price is inside these zones and highlights the pair/timeframe Show or hide SR zones price nearest to current price (Price_Close) Show or hide cur
This strategy is useful for small timeframe scalping and binary options. Best timeframes: M5,M15,M30 M1 timeframe is too unpredictable. So be careful with that. Read Detailed Description and Get All: - Free Demo - Free Scanner - Extra Indicators ex4 files from https://abiroid.com/product/abiroid-donchian-scanner-and-arrows Arrows Demo only works in strategy tester. So, Arrows Demo won't work with the free scanner. Scanner needs "Abiroid Donchian Arrow.ex4" to work. So make sure both arrows a
Get Free Scanner and example Strategies And understand detailed description here: https://abiroid.com/product/abiroid-customizer-arrows-and-scanner And get example wrapper here: https://abiroid.com/indicators/customizer-sample-wrappers You can make your own wrappers if your indicators have complex conditions or for In-Built MT4 indicators. Features: - Specify your own Custom Indicator - Specify Buffer values and create Variables - Use those Variables to create your own Buy/Sell Conditions
This is a multi-timeframe multi-currency Fibo (Fibonacci levels) and Pivots scanner which also shows Missed Pivot count and Fibo Golden Ratio Zones. Select separate Pivot Timeframes for each Dashboard Timeframe Check when price is near a Pivot point Check for Price Crossing Pivot Point Use Mid Pivots (Optional) Show Missed Pivots (Optional) Show High Volume Bar Use Fibo (Optional) Use Fibo Golden Ratio (Optional) Set your preferred Timeframe for Fibo or Pivots Check out   Common Scanner Settin
This strategy is best used for Scalping and Binary Options. Strategy: There are 3 EMAs: Faster, Medium and Slower. When Price is Trending, wait for Price to bounce an EMA and scalp at each bounce. Features: - Check if 3 MAs are Stacked - Check Price Bounce Off MAs (Faster, Medium, Slower) - Min Distance Between Faster and Medium MA Filter - Max Distance Between Entry Price and Faster MA Filter - High Volume Check - Heiken Trend Check - Volatility Check - Higher/Lower Timeframes MA Stacked check
Bollinger Bands Breakout Strategy has an Arrows and Scanner Dashboard indicator set. It is for MT4 (Metatrader 4) platform. When price breaks out of a Bollinger Outer Band in a powerful way, it becomes a great position for scalping. Because the next few bars will most likely keep going in the same direction. Especially if Middle band is also sloping towards that breakout. It's also great for Binary options when using 2-3 next few bars. Strategy: BUY  Bollinger Bands: - Price breaks out of
筛选:
无评论
回复评论
版本 1.2 2023.01.10
v1.2 Added option to Alert and Highlight only if HTF Align
And added Refresh After Ticks option to refresh more often
版本 1.1 2021.07.07
v1.1 Fixed Bug: Supertrend CCI not updating Buy values properly