• 概述
  • 评论
  • 评论 (3)
  • 新特性

YFX Currency Strength

Overview

This is a very simple indicator that displays the relative strength values of the currencies on te current chart and timeframe. The strength is only calculated for the currencies:

  • AUD - Australian Dollar
  • CAD - Canadian Dollar
  • CHF - Swiss Franc
  • EUR - European Union Euro
  • GBP - Great Britain Pound
  • JPY - Japanese Yen
  • NZD - New Zealand Dollar
  • USD - United States Dollar
These are considered the major currencies in the world. There are 28  distinct combinations of major currency pairs. Other currency values are not included in the calculation. Sometimes, there are no direct quotes for some currency pairs. Quotes in this situation are then derived from other currency pairs. If derived values are use then only a few real quotes are needed for  major currency pairs. In derived mode, quotes are only need for:
  • AUD/USD
  • EUR/USD
  • GBP/USD
  • NZD/USD
  • USD/CAD
  • USD/CHF
  • USD/JPY

These are the main pairs that are quoted directly against the USD. All the other currency pair values are derived from the above pairs. If using the derived values, then only the main pairs are required to be included in the terminal. Else all pairs are required if not using the derived mode. If the derived mode is used then estimated values are created in cases where a currency pair is not available. 


Usage

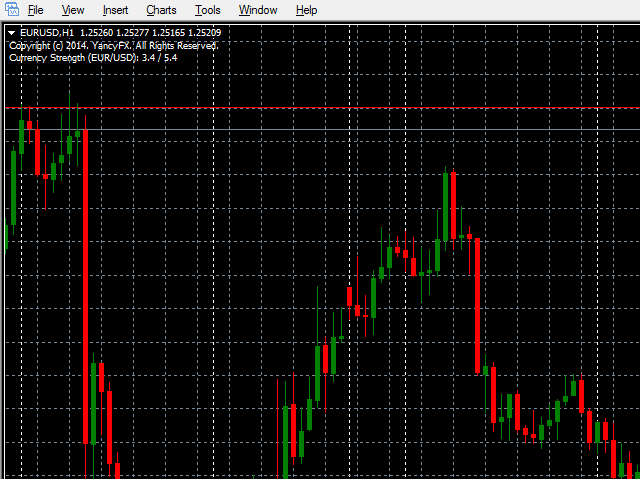
Using the indicator is very simple. Add it to any chart containing one of the 28 supported currency pairs. The indicator shows the currency pair and strength values, e.g.

Currency Strength (EUR / USD) 3.4 / 5.4

The first number, e.g. 3.4, is the relative strength of the first (base) currency, e.g. EUR. The second number, e.g. 5.4, is the relative strength of the second (quote) currency. Only the current timeframe is used in calculations.

Relative strength values range between 9.0 and 0.0. Higher values are stronger. In the above example, USD's value of 5.4 is greater than the EUR's 3.4 and thus USD is stronger than the EUR. The amount of the difference between relative strength values is important. A large difference usually indicates a trend moving in the direction of the stronger currency. Smaller differences will usually indicate range-bound conditions.

Notifications are available for this indicator. The spread, i.e. absolute difference, between the relative strength values is used for notifications where an e-mail can be sent when the spread reaches a certain level. For example, if the spread alert level is set at 1.0 for the above example, an e-mail would be sent because the absolute difference is 2.0.


Notes

  • Only The current symbol and current timeframe are used for all calculations.
  • Changing the symbol or timeframe will cause all calculations to re-calculate.
推荐产品
Black series MT4
Dmitriy Kashevich
1 (1)
Black series MT4 - The indicator is designed for trading on binary options with Timeframe M1-M5-M15 Multicurrency (Works on cryptocurrency and currency pairs) The signal appears when the candle opens Up to 90% correct signals There is no signal redrawing at all Can be used with other indicators. Good for scalping! In Settings there is: -Indicator working methods -I Allert Arrow color Red signal down Blue signal up Also watch the video how the indicator works and signals appear or te
Alpha Trend sign Alpha Trend sign 是我么长期以来非常受欢迎的交易工具,它可以验证我们的交易系统,并且明确的提示交易信号,并且信号不会漂移。 主要功能: •  根据市场显示活跃区域,根据指标可以很直观的判断当前行情是属于趋势行情,还是震荡行情。    并根据指标的指示箭头切入市场,绿色箭头提示买入,红色箭头提示卖出。 •  建议使用5分钟以上的时间周期进行交易,避免因为小周期波动出现频繁的交易信号。 •  您也可以开启信号提示,以免错过最佳的交易时机。 •  本指标不但可以很好的预测趋势行情,也可以在宽幅震荡行情中获利。 •  本指标本着大道至简的原则,适合不同阶段的交易者使用。 注意事项: •  Alpha Trend sign 有明确的进出场信号,不建议逆势操作,以免造成损失。 •  Alpha Trend sign 是特别成熟的指标,我们团队人手一个,使用它可以实现稳定盈利。     
PABT Pattern Indicator - it's classical system one of the signal patterns. Indicator logic - the Hi & Lo of the bar is fully within the range of the preceding bar, look to trade them as pullback in trend. In the way if indicator found PABT pattern it's drawing two lines and arrow what showing trend way.  - First line - it's entry point and drawing at: 1. On the high of signal bar or on middle of the signal bar (depending from indicator mode) for buy; 2. On the low of signal bar or on middle of t
VR Cub
Vladimir Pastushak
VR Cub 这是获得高质量切入点的指标。该指标的开发是为了促进数学计算并简化对仓位入场点的搜索。多年来,该指标所针对的交易策略已被证明其有效性。交易策略的简单性是其巨大的优势,即使是新手交易者也能成功进行交易。 VR Cub 计算开仓点以及获利和止损目标水平,这显着提高了效率和易用性。查看使用以下策略进行交易的屏幕截图,了解简单的交易规则。 设置、设置文件、演示版本、说明、问题解决,可以从以下位置获取 [博客] 您可以在以下位置阅读或撰写评论 [关联] 版本为 [MetaTrader 5] 计算入场点的规则 开仓 要计算入场点,您需要将 VR Cub 工具从最后一个高点拉伸到最后一个低点。 如果第一个点在时间上早于第二个点,交易者等待柱线收于中线上方。 如果第一个点在时间上晚于第二个点,交易者等待柱线收于中线下方。 根据上述条件,严格在 柱线收盘 后建仓。 换句话说,如果我们在小时图上进行交易,那么从最高点到最低点的时间距离必须超过24小时,最高点和最低点之间的点数必须大于或等于平均价格变动每天。 维持和改变市场地位 可以有多个未平仓头寸;每个头寸都可以单独修改。 VR Cub
Gioteen Volatility Index (GVI)   - your ultimate solution to overcoming market unpredictability and maximizing trading opportunities. This revolutionary indicator helps you in lowering your losing trades due to choppy market movements. The GVI is designed to measure market volatility, providing you with valuable insights to identify the most favorable trading prospects. Its intuitive interface consists of a dynamic red line representing the volatility index, accompanied by blue line that indicat
Owl smart levels
Sergey Ermolov
4.28 (36)
MT5版本  |  FAQ Owl Smart Levels Indicator   是一個完整的交易系統,包含   Bill Williams   的高級分形、構建正確的市場波浪結構的 Valable ZigZag 以及標記準確入場水平的斐波那契水平等流行的市場分析工具 進入市場和地方獲利。 策略的详细说明 指示灯使用说明 顾问-贸易猫头鹰助手助理 私人用户聊天 ->购买后写信给我,我会将您添加到私人聊天中,您可以在那里下载所有奖金 力量在於簡單! Owl Smart Levels   交易系統非常易於使用,因此適合專業人士和剛開始研究市場並為自己選擇交易策略的人。 策略和指標中沒有隱藏的秘密公式和計算方法,所有策略指標都是公開的。 Owl Smart Levels 允許您快速查看進入交易的信號,突出顯示下訂單的水平並向您發送有關已出現信號的通知。 優點很明顯: 清楚地顯示主要和更高時間框架的趨勢方向。 指示儀器信號的出現。 標記開單、止損設置和固定利潤的水平。 沒有多餘的,只有必要的結構! ZigZag   表示全球趨勢的方向,因此也表示貿易方向。 市場反轉點的短線清楚地表明在什
Indicador Taurus All4
Fabio Oliveira Magalhaes
Taurus All4 Taurus All4 is a high-performance indicator, it will tell you the strength of the trend, and you will be able to observe the strength of the candle. Our indicator has more than 4 trend confirmations. It is very simple and easy to use. Confirmation Modes Candle Trend Confirmations: When the candle switches to light green the trend is high. When the candle switches to light red the trend is reverting down. When the candle changes to dark red the trend is low. Trendline Trend Confirm
價格反轉 Pro - 價格將以 95% 的概率反轉的點。這些信息將幫助每個交易者有效地進行交易。圖表上的指標繪製了價格將反轉的位置和方向的箭頭。您需要等待指標畫出箭頭並在指示方向開單,這是最簡單的交易策略。該指標不會重新繪製箭頭並顯示中長距離的價格反轉。這意味著在箭頭出現後,價格將朝著指示的方向發展許多點。 指標的好處: 給出所有貨幣對的信號 用箭頭顯示價格反轉點 信號准確度高達 95% 不重繪信號 適用於所有時間範圍 交易建議: 任何貨幣對 任何時間範圍 任何經紀人 適合剝頭皮和長期交易 如何使用指標進行交易: 當出現紅色箭頭時,打開賣單。 當一個藍色箭頭出現時,打開一個買單。 止損設置在距離箭頭最多 30 點的位置。 止盈設置在 10 到 50 點的距離(取決於時間範圍)。 指標設置: period_one - 用於確定反轉點的短波計算週期。 period_two - 用於確定反轉點的長波計算週期。 period_rsi - 使用 rsi 過濾虛假信號的周期。 .type - 價格類型(開盤,收盤); 信號 - 向手機發送信號。 arrow_size - 箭頭大小。
交易水平指标是一个交易系统,旨在确定入场点、持有仓位和趋势方向。 包括在一个复合体中工作的多种机制、趋势方向的波浪分析、构建信号时的水平分析、显示可能的 TP 和 SL 目标。 指标能力 信号箭头出现在当前蜡烛上并且不会重新着色。 使用特殊算法来搜索价格反弹的水平。 根据趋势进行工作。 该系统具有通用性,可适用于各种交易工具。 箭头警报有多种类型。 信号箭头的输入参数在自动模式下配置和运行。 根据时间范围更改“趋势波周期”参数 “目标水平 SL TP”参数是针对主要货币对定义的;用于其他交易工具时,可以增加 10 或更多。 指标如何工作 判断趋势,该指标有一条波浪线;如果它高于价格,则趋势看跌;如果低于价格,则趋势看涨。 红色信号箭头用于购买,黄色信号箭头用于销售。 水平虚线是构建信号的电平;构建该线时,信号处于活动状态。 目标水平 SL 和 TP 的存在是为了方便技术分析和选择趋势参数。
Trend Oscillator mw
DMITRII GRIDASOV
趋势振荡器 - 是一种高级自定义 Crypto_Forex 指标,高效的交易工具! - 使用高级新计算方法 - 参数“计算价格”有 20 个选项。 - 有史以来最平滑的振荡器。 - 绿色表示上升趋势,红色表示下降趋势。 - 超卖值:低于 5,超买值:超过 95。 - 使用此指标,有很多机会升级标准策略。 - 具有 PC 和移动警报。 .................................................................................................................... // 更多出色的专家顾问和指标可在此处获得: https://www.mql5.com/en/users/def1380/seller 这是仅在此 MQL5 网站上提供的原创产品。
Crosskalp1
Mikhail Bilan
Добрый День уважаемые трейдеры!  Вашему вниманию индикатор созданный и работающий на базе трендовика ADX,  для торговли на смене направления движения который учитывает коррекцию и даёт возможность на ней заработать.  Применяю этот индикатор для скальпинга. Рекомендую таймфреймы от 15 ти минутного(М15) до часового (Н1) периодов.  Красный кружок сигнал на продажу- Sell) Зелёный кружок  сигнал на покупку Buy) Чем меньше ваш таймфрейм тем меньше пунктов вы зарабатываете.   Важно выставлять стопы! !В
El indicador "MR BEAST ALERTAS DE LIQUIDEZ" es una herramienta avanzada diseñada para proporcionar señales y alertas sobre la liquidez del mercado basándose en una serie de indicadores técnicos y análisis de tendencias. Ideal para traders que buscan oportunidades de trading en función de la dinámica de precios y los niveles de volatilidad, este indicador ofrece una visualización clara y detallada en la ventana del gráfico de MetaTrader. Características Principales: Canal ATR Adaptativo: Calcula
Trade History Drawer
David Leander Tschacher
Trade History Drawer is an indicator for MetaTrader 4. It shows trades on the chart and draws them in customized colors. Furthermore, the indicator shows a trade summary and saves a CSV history file for either one selected pair or all pairs. Inputs General Settings Number Trades : Number of trades to be drawn on the chart, if -1 then all trades Magic Number : Only trades with this magic number, if -1 then ignore Line Style : Line Style Line Thickness : Line Thickness Arrow Size : Arrow Size
Crypto_Forex 指标 HTF Ichimoku 适用于 MT4。 - Ichimoku 指标是最强大的趋势指标之一。HTF 表示 - 更高时间框架。 - 此指标非常适合趋势交易者以及与价格行动条目的组合。 - HTF Ichimoku 指标允许您将更高时间框架的 Ichimoku 附加到当前图表。 - 上升趋势 - 红线高于蓝线(并且两条线都在云层上方)/ 下降趋势 - 红线低于蓝线(并且两条线都在云层下方)。 - 仅当价格突破 Ichimoku 云层顶部边界时才打开买入订单。 - 仅当价格突破 Ichimoku 云层底部边界时才打开卖出订单。 - HTF Ichimoku 指标提供了捕捉大趋势的机会。 // 更多出色的专家顾问和指标可在此处获得: https://www.mql5.com/en/users/def1380/seller 它是仅在此 MQL5 网站上提供的原创产品。
Prophet
Andriy Sydoruk
Prophet is a trend indicator. Shows the direction of turning points. Can be used with an optimal risk-to-profit ratio. The arrows indicate favorable moments and directions for entering the market. Uses one parameter for setting (adjust from 1 to 3). The probability of a successful trend is very high. In the course of work, the take-profit is much larger than the stop-loss! Works on all currency pairs and on all timeframes.
Heiken Ashi Smoothed Strategy is a very simple but powerful system to get forex market trend direction. This indicator is actually 2 indicators in 1 pack, Heiken Ashi and Heiken Ashi Smoothed Moving Average both included. Because HA (Heiken Ashi) and HAS (Heiken Ashi Smoothed) are calculated in the same one system event with necessary buffers and loop only, so it is the FAST, OPTIMIZED and EFFICIENT HA having the combined indicator of MetaTrader 4. You can choose to display HA and HAS in the sam
GeoWprPro
Georgij Komarov
WPR by Profile, or WPR for Professionals Geo_WprPro is one of the well-known currency profile indicators. It simultaneously displays two WPR indicators with different parameters in the matrix form on all timeframes of multiple currency pairs forming the currency profile . As follows from the description, " WPR is a leading indicator that often goes ahead of the price chart. The oscillator frequently reaches extreme values before the price reversal as if anticipating that event: it almost always
Signal From Level
Yaroslav Varankin
Binary Options Support Resistance Indicator This indicator is designed for binary options trading and effectively shows retracements from support and resistance levels. Signals appear on the current candle. A red arrow pointing downwards indicates a potential selling opportunity, while a blue arrow pointing upwards suggests buying opportunities. All that needs adjustment is the color of the signal arrows. It is recommended to use it on the M1-M5 timeframes as signals are frequent on these timef
Dynamic Forex28 Navigator
Bernhard Schweigert
5 (4)
Dynamic Forex28 Navigator - 下一代外汇交易工具。 当前 49% 折扣。 Dynamic Forex28 Navigator 是我们长期流行的指标的演变,将三种功能合二为一: 高级货币强度 28 指标 (695 条评论)+ 高级货币 IMPULSE 带警报 (520 条评论)+ CS28 组合信号(奖励)。 有关指标的详细信息 https://www.mql5.com/en/blogs/post/758844 下一代强度指标提供什么? 您喜欢的原始指标的一切,现在通过新功能和更高的精度进行了增强。 主要特点: 专有货币强度公式。  所有时间范围内的平滑和准确的强度线。 非常适合识别趋势和精确进入。 动态市场斐波那契水平(市场斐波那契)。  此指标独有的独特功能。 斐波那契应用于货币强度,而不是价格图表。 适应实时市场活动以获得准确的反转区域。 实时市场动量。  第 9 行显示市场是活跃还是被动。 对于定时交易至关重要。 全面的警报和显示。  每种货币最强的买入和卖出动量。 ​​28 对的双重动量买入和卖出。 超买/超卖警告外部范围和止损。 反转
新的、更準確的 Xmaster 指標版本。來自世界各地的 200 多名交易者在他們的 PC 上對該指標的不同組合進行了 15,000 多次測試,以獲得最有效和最準確的公式。在這裡,我們向您展示“Xmaster 公式指標外匯無重繪”指標,它顯示準確的信號且不重繪。該指標還通過電子郵件和推送向交易者發送信號。隨著每個新報價的到來,它不斷地通過超過 75 個參數分析市場,並向交易者顯示準確的買入和賣出信號。此外,在該指標的幫助下,您可以看到趨勢現在朝著哪個方向發展,以便在正確的方向上進行交易。 新的“Xmaster 公式指標外匯無重繪”指標如何工作,它與舊版本有何不同? 首先,它是最優化的市場分析算法,已被全球不同交易者測試超過 15,000 次。 其次,該指標配備了針對錯誤信號的獨特算法過濾器,這使其成為每個交易者非常有用的工具。它特別適合使用剝頭皮策略進行交易,因為了解價格的每日方向非常重要。而這個新指標很好地說明了這一點。 第三,與舊版本不同,這個新指標“Xmaster 公式指標外匯無重繪”向電子郵件發送信號並推送。為您的交易策略配備如此專業的工具,您一定會在交易中獲得巨大優勢,並能
Auto Fibo Pro m
DMITRII GRIDASOV
“Auto FIBO Pro” Crypto_Forex 指标 - 是交易中的绝佳辅助工具! - 指标自动计算并放置在图表斐波那契水平和局部趋势线(红色)上。 - 斐波那契水平指示价格可能反转的关键区域。 - 最重要的水平是 23.6%、38.2%、50% 和 61.8%。 - 您可以将其用于反转剥头皮或区域网格交易。 - 还有很多机会可以使用 Auto FIBO Pro 指标来改进您当前的系统。 - 它具有信息价差掉期显示 - 它显示所连接的外汇对的当前价差和掉期。 - 显示屏还显示账户余额、净值和保证金。 - 可以将信息价差掉期显示定位在图表的任何角落: 0 - 左上角,1 - 右上角,2 - 左下角,3 - 右下角。 // 出色的交易机器人和指标可在此处获得: https://www.mql5.com/en/users/def1380/seller 这是仅在此 MQL5 网站上提供的原创产品。
Impulsive Trade AM
Andriy Matviyevs'kyy
This indicator is designed for trading based on the trading strategy presented by Alexander Elder. The thick and thin color histograms of the indicator correspond to the values ​​of MACD and OsMA with the parameters set by the user. If the indicator histogram is greater than zero, then the MACD or OsMA value is greater than zero. If the indicator histogram is less than zero, then the MACD or OsMA value is less than zero. As an additional element, the indicator indicates the direction of the mo
Sto Signal AM
Andriy Matviyevs'kyy
This indicator displays Stochastic osc signals on the price chart and allows the user to receive notifications of such signals. The Stochastic indicator is a classic and proven indicator of the technical analysis of the markets. Despite its age, it is still relevant today. Depending on the settings, the indicator allows you to work effectively on various TFs and any markets. Signals are given on fully formed bars and are not redrawn. Custom Parameters: Stochastic_Price (0-1) - The applied price
Noize Absorption Index MT4
Ekaterina Saltykova
5 (1)
Noize Absorption Index - is the manual trading system that measures the difference of pressure between bears forces and bulls forces. Green line - is a noize free index that showing curent situation. Zero value of index shows totally choppy/flat market.Values above zero level shows how powerfull bullish wave is and values below zero measures bearish forces.Up arrow appears on bearish market when it's ready to reverse, dn arrow appears on weak bullish market, as a result of reverse expectation. S
PipFinite Exit EDGE
Karlo Wilson Vendiola
4.83 (115)
Did You Have A Profitable Trade But Suddenly Reversed? In a solid strategy, exiting a trade is equally important as entering. Exit EDGE helps maximize your current trade profit and avoid turning winning trades to losers. Never Miss An Exit Signal Again Monitor all pairs and timeframes in just 1 chart www.mql5.com/en/blogs/post/726558 How To Trade You can close your open trades as soon as you receive a signal Close your Buy orders if you receive an Exit Buy Signal. Close your Sell orders if
Galactic VSA
Jhon Martinez
Galactic Volume spread analysis (VSA), is an indicator designed for the visualization of the Volume, and the proportion in which it affects the volatility of the spread of the different pairs. The strategy consists of the following: Bull Trend: Always going in favor of the trend, open buying operations at the lows of the trend, provided that it coincides with a high volume shown by the Galactic VSA indicator. Downtrend: Always going in favor of the trend, open sales operations at the highs of
Trendiness Index
Libertas LLC
5 (3)
"The trend is your friend" is one of the best known sayings in investing, because capturing large trendy price movements can be extremely profitable. However, trading with the trend is often easier said than done, because many indicators are based on price reversals not trends. These aren't very effective at identifying trendy periods, or predicting whether trends will continue. We developed the Trendiness Index to help address this problem by indicating the strength and direction of price trend
GENERAL OVERVIEW Introducing our new KDE Optimized RSI Indicator! This indicator adds a new aspect to the well-known RSI indicator, with the help of the KDE (Kernel Density Estimation) algorithm, estimates the probability of a candlestick will be a pivot or not. For more information about the process, please check the "HOW DOES IT WORK ?" section. Features of the new KDE Optimized RSI Indicator : A New Approach To Pivot Detection Customizable KDE Algorithm Realtime RSI & KDE Dashboard Alert
Strong Retracement Points Pro demo edition! SRP (Strong Retracement/Reversal Points) is a powerful and unique support and resistance indicator. It displays the closest important levels which we expect the price retracement/reversal! If all level are broken from one side, it recalculates and draws new support and resistance levels, so the levels might be valid for several days depending on the market! If you are still hesitating to start using this wonderful tool, you can check this link to see h
该产品的买家也购买
Scalper Inside PRO
Alexey Minkov
4.75 (61)
!SPECIAL SALE!  An exclusive indicator that utilizes an innovative algorithm to swiftly and accurately determine the market trend. The indicator automatically calculates opening, closing, and profit levels, providing detailed trading statistics. With these features, you can choose the most appropriate trading instrument for the current market conditions. Additionally, you can easily integrate your own arrow indicators into Scalper Inside Pro to quickly evaluate their statistics and profitability
Currency Strength Exotics
Bernhard Schweigert
4.87 (31)
目前8折优惠! 对任何新手或专家交易者来说都是最好的解决方案! 这个指标是专门用来显示任何符号的货币强度,如异国货币对、商品、指数或期货。它是同类产品中的第一个,任何符号都可以添加到第9行,以显示黄金、白银、石油、DAX、US30、MXN、TRY、CNH等的真实货币强度。这是一个独特的、高质量的、负担得起的交易工具,因为我们已经纳入了一些专有的功能和一个新的公式。想象一下,你的交易将如何改善,因为你能够准确地确定新趋势或剥头皮机会的触发点? 用户手册:点击这里   https://www.mql5.com/en/blogs/post/708876 它适用于所有时间框架。你将很快能够看到TREND! 根据新的基础算法设计,它使识别和确认潜在交易变得更加容易。这是因为它以图形方式显示了8种主要货币和一种符号的强弱。 该指标显示了8种主要货币(澳元加元瑞士法郎欧元英镑日元新西兰美元)的强弱线,再加上一个符号! 该指标显示了符号的真实价值。例如:对于XAUUSD(黄金):价格以美元报价。如果黄金在上涨,你怎么能知道是黄金的强势还是美元的弱势?只有当黄金走强时,我们才会进行交易。该指
Golden Trend Indicator
Noha Mohamed Fathy Younes Badr
4.9 (10)
Golden Trend indicator  is The best indicator for predicting trend movement this indicator never lags and never repaints and never back paints    and give  arrow buy and sell    before the candle appear  and it will help you and  will make your trading decisions clearer its work on all currencies and  gold and crypto and all time frame This unique  indicator uses very secret algorithms to catch the  trends, so you can trade using this indicator and see the trend clear on charts  manual guide and
TPSpro RFI Levels
Roman Podpora
4.85 (27)
指示       俄罗斯 -        英语   建议 与指示器一起使用     -       TPSpro 趋势专业版 -   MT4版本       交易中的一个关键要素是做出买卖交易工具决定的区域或水平。尽管主要参与者试图隐藏他们在市场中的存在,但他们不可避免地会留下痕迹。我们的任务是学习如何识别这些痕迹并正确解释它们。 主要功能: 向卖家和买家显示活跃区域! 该指标显示所有正确的初始买入和卖出脉冲水平/区域。激活这些水平/区域后,开始寻找切入点,水平会改变颜色并填充特定阴影。此外,还会显示箭头,以便更直观地了解情况。 显示更高时间范围内的级别/区域(MTF 模式) 添加了使用更高时间间隔显示级别/区域的功能。此外,该指标还具有自动趋势检测功能(   TPSproTREND PRO   )。 用于交易的单独专业的逐步算法。 该算法专为日内交易而设计,既可顺势交易,也可逆势交易。每个活动模板均提供详细说明。 适用于多种时间范围 。 TPSpro RFI 水平指标可用于图表上的任何时间范围,从一分钟(M1)开始一直到每月(MN)。 图形和声音警报。 该指标提供图形和声音指示,
Beast Super Signal
Dustin Vlok
4.73 (89)
正在寻找可以帮助您轻松识别有利可图的交易机会的强大外汇交易指标? Beast Super Signal 就是您的不二之选。 这个易于使用的基于趋势的指标持续监控市场状况,寻找新的发展趋势或跳入现有趋势。当所有内部策略一致且彼此 100% 融合时,Beast Super Signal 会发出买入或卖出信号,无需额外确认。当您收到信号箭头警报时,只需买入或卖出。 购买后给我留言,让我加入我的私人 VIP 群组! (仅限购买完整产品)。 购买后给我发消息以获取最新的优化设置文件。 此处提供 MT5 版本。 在此处 获取 Beast Super Signal EA。 查看评论部分以查看最新结果! Beast Super Signal 根据您偏好的 1:1、1:2 或 1:3 风险回报率建议入场价、止损和获利水平,让您放心交易。这个 Beast Super Signal 是 100% 不可重新绘制的,这意味着它永远不会重新计算或重新绘制,每次都能为您提供可靠的信号。 Beast Super Signal 指标适用于所有时间范围,包括货币对、指数、商品和加密货币对。 Beast Su
PZ Harmonacci Patterns
PZ TRADING SLU
3.17 (6)
可以说,这是您可以为MetaTrader平台找到的最完整的谐波价格形成自动识别指标。它检测19种不同的模式,像您一样认真对待斐波那契投影,显示潜在的反转区域(PRZ),并找到合适的止损和获利水平。 [ 安装指南 | 更新指南 | 故障排除 | 常见问题 | 所有产品 ] 它检测19种不同的谐波价格形态 它绘制了主要,衍生和互补的斐波那契投影(PRZ) 它评估过去的价格走势并显示每个过去的形态 该指标分析其自身的质量和性能 它显示合适的止损和获利水平 它使用突破来表明合适的交易 它在图表上绘制所有样式比率 它实现了电子邮件/声音/视觉警报 受斯科特·M·卡尼(Scott M. Carney)的书的启发,该指标旨在满足最纯粹和最熟练的交易者的需求。但是,它采取了一种使交易更容易的方式:在向交易发出信号之前,它会等待Donchian朝正确方向突破,从而使交易信号非常可靠。 斐波那契投影与向量无关 它实现了电子邮件/声音/推送警报 它绘制了ABCD投影 重要提示: 为了符合 Scott M. Carney先生 的商标申诉,某些图案名称已重命名为不言自明的替代方式, Scott M.
System Trend Pro
Aleksandr Makarov
5 (2)
System Trend Pro - This is the best trend trading indicator!!! You can get this indicator for free -  Quantum Entry PRO The indicator no repaint!!!   The indicator has   MTF   mode, which adds confidence to trading on the trend (   no repaint   ). How to trade? Everything is very simple, we wait for the first signal (big arrow), then wait for the second signal (small arrow) and enter the market in the direction of the arrow. (See screens 1 and 2.) Exit on the opposite signal or take 20-30 pips
TPSproTREND PrO
Roman Podpora
4.71 (28)
TPSpro TREND PRO 是一个趋势指标,可以自动分析市场并提供有关趋势及其每次变化的信息,并给出进入交易的信号而无需重新绘制! 该指标使用每根蜡烛,分别对其进行分析。指不同的脉冲——向上或向下脉冲。货币、加密货币、金属、股票、指数交易的准确切入点! MT5版本                 指标的完整描述   我们建议将其与 指示器 -   RFI LEVELS 一起使用 主要功能: 准确的输入信号,无需渲染! 如果出现信号,它仍然相关!这是与重提指标的一个重要区别,重提指标可以提供信号然后改变信号,这可能导致存款资金的损失。现在您可以以更高的概率和准确度进入市场。还有一个功能是在箭头出现后为蜡烛着色,直到达到目标(止盈)或出现反转信号。 显示止损/获利区域 为了提高搜索切入点时的视觉清晰度,创建了一个模块,该模块最初显示买入/卖出区域,在该区域中搜索进入市场的最佳点。用于处理止损水平的附加智能逻辑有助于随着时间的推移减小其大小,从而降低进入交易(移动 sl)时的初始风险。 显示较高时间范围内的最小值/最大值(MTF 模式) 添加了一项功能,可以显示较高时间间隔的最小/最
TrendMaestro
Stefano Frisetti
5 (3)
note: this indicator is for METATRADER4, if you want the version for METATRADER5 this is the link:  https://www.mql5.com/it/market/product/108106 TRENDMAESTRO ver 2.4 TRENDMAESTRO recognizes a new TREND in the bud, he never makes mistakes. The certainty of identifying a new TREND is priceless. DESCRIPTION TRENDMAESTRO identifies a new TREND in the bud, this indicator examines the volatility, volumes and momentum to identify the moment in which there is an explosion of one or more of these data a
这是最赚钱的指标。它的表现非常出色。无论市场上有什么兴趣,你都能看到。 几乎在所有情况下,它都只会给你一个长期的市场观点,但不要被愚弄,以为它是受事件约束的。不是这样的。它能找到市场上最大的利益所在,并将其展示给你。别忘了,最大的资金(利益)每天都不会在市场上出现。这是您没有遇到过的情况。月租金可能会给您一到两个信号,仅此而已。但当我们谈论大资金时,他们就是这样行事的。 如果您想了解更多,请点击这里。 这是最赚钱的指标。它的表现非常出色。无论市场上有什么兴趣,你都能看到。 几乎在所有情况下,它都只会给你一个长期的市场观点,但不要被愚弄,以为它是受事件约束的。不是这样的。它能找到市场上最大的利益所在,并将其展示给你。别忘了,最大的资金(利益)每天都不会在市场上出现。这是您没有遇到过的情况。月租金可能会给您一到两个信号,仅此而已。但当我们谈论大资金时,他们就是这样行事的。 如果您想了解更多,请点击这里。
GOLD Impulse with Alert
Bernhard Schweigert
4.6 (10)
这个指标是我们2个产品 Advanced Currency IMPULSE with ALERT  +   Currency Strength Exotics 的一个超级组合。 它适用于所有时间框架,并以图形方式显示8种主要货币和一种符号的强势或弱势冲动! 该指标专门用于显示任何符号的货币强度加速,如黄金、异国货币对、商品、指数或期货。这是它的第一个指标,任何符号都可以被添加到第9行,以显示黄金、白银、石油、DAX、US30、MXN、TRY、CNH等的真实货币强度加速(冲动或速度)。 建立在新的基础算法上,它使识别和确认潜在的交易更加容易。这是因为它以图形方式显示了一种货币的强势或弱势是否正在加速,并测量了这种加速的速度--把它想象成你汽车中的速度表。当你加速时,事情显然会发生得更快,这在外汇市场上也是一样的,即如果你配对的货币正在向相反的方向加速,你就会发现一个潜在的有利可图的交易。 动态市场斐波那契28水平被用作警报触发器,将适应市场活动。如果冲动击中黄色触发线,你将收到警报。然后你就知道作为一个交易员应该做什么。货币对和方向已经给出。只需点击警报按钮,就可以切换到该货
Please follow the "How To Trade" instructions exactly for best results Wycoff theory is vastly used by institutional traders but when it comes to retail traders the concept isn't well understood by most. It is even more difficult to implement in intraday & swing trading. This No REPAINT indicator helps you in analyzing the market cycles and plots buy/sell signals at the start of trending phase. It studies the market strength of bulls and bears and does a effort Vs reward matrix calculation befor
CyberZingFx Volume Plus
Afsal Meerankutty
4.93 (15)
Advanced version of CyberZingFx Volume Plus, the ultimate MT4 indicator for traders seeking highly accurate buy and sell signals. With an additional strategy and price action dot signals that enhances its effectiveness, this indicator offers a superior trading experience for professionals and beginners alike. The CyberZingFx Volume Plus Advanced version combines the power of volume analysis and historical price data with an additional strategy, resulting in even more precise and reliable signals
Scalper Boss
Andrey Kozak
5 (1)
Scalper Boss 是一个先进的分析工具,旨在通过多层逻辑框架评估市场状况并识别最佳的进场和出场点。它能够适应不断变化的市场环境,为交易者提供清晰的视觉信号和趋势线。其主要价值在于通过过滤市场噪音并捕捉有意义的波动,提高市场分析效率,这在短线交易和日内交易中尤为有用。 虽然 Scalper Boss 不能保证盈利,但其强大的架构能帮助交易者更好地理解市场,尤其是在波动性高或横盘市场中。 指标的优势 多层次分析: 结合均线交叉和趋势线,提供全面的市场视图。 精准: 通过整合市场范围分析过滤噪音,减少虚假信号。 灵活: 可自定义参数,适用于任何交易工具或风格。 易于使用: 清晰的视觉元素(如箭头和趋势线)简化了信号解读。 多用途: 适合短线交易、日内交易,甚至中期交易策略。 使用指标的简单交易策略 进场条件: 买入: 当蓝色向上的箭头出现在蜡烛下方,并且上升趋势线(TrendUp)激活且下降趋势线(TrendDown)隐藏时。 卖出: 当红色向下的箭头出现在蜡烛上方,并且下降趋势线(TrendDown)激活且上升趋势线(TrendUp)隐藏时。 止损: 设置在最近3-5根蜡烛的局部低
目前八折优惠! 对任何新手或专家交易者来说都是最好的解决方案! 这个仪表板软件适用于28种货币对。它基于我们的两个主要指标(高级货币强度28和高级货币冲动)。它对整个外汇市场提供了一个伟大的概述。它显示高级货币强度值,货币运动速度和28个外汇对在所有(9)时间段的信号。想象一下,当你可以使用图表上的单一指标观察整个市场,以确定趋势和或剥头皮的机会时,你的交易将得到改善 我们已经在这个指标中建立了一些功能,使你更容易识别强势和弱势货币,同时识别和确认潜在的交易。该指标以图形方式显示货币的强势或弱势是增加还是减少,以及它在所有时间段的表现。 增加的新功能是动态市场斐波那契水平,它适应当前的市场条件变化,这是一个已经在我们的高级货币强度28和高级货币冲动指标中使用的成熟的加分项。 在交易时,总是将弱势货币和强势货币配对,这个新指标将帮助你做到这一点。 用户手册:点击这里  https://www.mql5.com/en/blogs/post/708783 特点  显示每个时间段的ACS28和GAP-speed(冲动)的货币强度值。 列:颜色代码以7种颜色显示货币强度:强势
本指标是实践实战交易完善的波浪自动分析的指标   !  案例... 注: 波浪分级用西方叫法不习惯,因受到缠论(缠中说禅)命名方式习惯的影响,我是将基础波浪命名为 笔 ,将二级波段命名为 段 ,同时具有趋势方向的段命名为 主趋段 (以后笔记中都是这种命名方式,先告知大家),但是算法上和缠论关系不大切勿混淆.反映的是本人分析盘面总结的 千变万化纷繁复杂的运行规律 . 对波段进行了标准化定义,不再是不同人不同的浪  ,   对人为干扰的画法进行了排除,在严格分析进场起到了关键的作用 . 使用这个指标,等于将交易界面提升美感,抛弃最原始的K线交易带你进入新的交易层次.如果不是为了交易,在宣传上也将使客户观感提升层次. 指标内容: 1. 基础波浪 (笔) : 首先我们找出了价格波动过程中的基础波动拐点,当然他的有序性低,为下一步的计算提供基础. 2. 二级波段( 段 ) :在基础波浪的基础上,通过算法分析得到层级更明显的二级波段,二级波段为波浪提供了分析基础 3. 波浪( 浪 ): 有着更清晰的趋势,更清晰直观的方向.分析一个波浪是否延续,需要看二级波段的形态,分析二级的构成,可以得出波
Bomb Bank Signal
Igor Pereira Calil
5 (1)
炸彈銀行訊號:您對 MetaTrader 4 的信心指標 Bomb Bank Signal 是 MetaTrader 4 的一個強大指標,旨在識別金融市場中最相關的趨勢。如果您正在尋找一種能夠準確預測運動的工具,那麼炸彈庫就是您需要的盟友。 運作原理: 該指標結合了三種不同的方法——成交量分析、蠟燭收盤價和對稱趨勢——來偵測和發出買賣機會訊號。當炸彈銀行識別出買入機會時,它就像一顆「炸彈」;當它偵測到賣出訊號時,它就像一個「頭骨」。 為什麼炸彈銀行不一樣? 完全可靠性:炸彈庫訊號不會刪除訊號。訊號一旦發出,就會一直存在,確保您不會錯過任何機會。 極為準確:炸彈庫不會發出錯誤訊號。它會即時更新您的訊息,隨著市場的變化進行調整,但保持先前訊號的透明度。 即時更新:訊號被即時識別並在必要時更新,使您能夠快速響應市場變化。 最大化您的結果: 炸彈銀行訊號是識別趨勢持續走勢的理想選擇。例如,如果您已經做空並且指標在 M15 發出買入訊號,那麼現在就是平倉或部分下單的最佳時機,反之亦然。 此外,經過仔細分析,我們建議您遵循M30、H1和H4上的訊號,停損僅50點。這使得價格朝著有利
Quantum Entry PRO
Aleksandr Makarov
Live Signal Bonus: when you buy or rent the indicator, you get Gold Pro Scalper   or System Trend Pro absolutely free.(unlimited) After purchase, contact me to learn more about how to get the bonus indicator that pairs perfectly with Quantum Entry for improved merging! Quantum Entry is a powerful price action trading system built on one of the most popular and widely known strategies among traders: the Breakout Strategy! This indicator produces crystal clear buy and sell signals based on break
IQ FX Gann Levels
INTRAQUOTES
5 (1)
CONTACT US  after purchase to get the Indicator Manual. Try Now—Limited 50% Discount for First 10 Buyers! Download the  Metatrader 5 Version Due to regulatory restrictions, our service is unavailable in certain countries such as India, Pakistan, and Bangladesh. William Delbert Gann (W.D. Gann) was an exceptional market analyst, whose trading technique was based on a complex blend of mathematics, geometry, astrology, and ancient mathematics which proved to be extremely accurate. A Note from t
Supply and Demand Dashboard PRO
Bernhard Schweigert
4.8 (20)
目前八折优惠! 这个仪表板是一个非常强大的软件,可用于多个符号和多达9个时间段。 它是基于我们的主要指标(最佳评论:高级供应需求)。 Advanced Supply Demand 该仪表板提供了一个伟大的概述。它显示。   筛选后的供需值,包括区域强度评级。 区间内和区间外的点位距离。 它突出了嵌套的区域。 在所有(9个)时间段内,它对所选符号发出4种警报。 它是高度可配置的,以满足您的个人需求! 您的利益! 对每个交易者来说,最重要的问题是。 什么是入市的最佳水平? 在强大的供应/需求区域内或附近进入你的交易,以获得最佳的成功机会和风险/回报。 我的止损的最佳位置是哪里? 把你的止损放在强势供应/需求区的下方/上方是最安全的。 我的最佳盈利目标是什么? 你的退出策略和你的进入策略一样重要,了解更高的时间框架图可以帮助你。对于买入,使用下一个供应区作为目标,对于卖出,使用下一个需求区作为目标。在回撤到供应区或需求区时进场,以确保有足够的利润空间,达到更高的时间框架的供应和需求,将增加你的利润。 为什么我们要过滤强区和弱区? 不平衡性越大,价格的变动就
Enigmera
Ivan Stefanov
5 (4)
ENIGMERA: 市场的核心 重要提示:MQL5.com 演示版本在策略测试器中运行,可能无法完全反映 Enigmera 的功能。请查看描述、截图和视频了解详细信息。如有任何问题,请随时联系我! 该指标的代码已完全重写。版本 3.0 增加了新功能并修复了自指标发布以来积累的错误。 简介 这个指标和交易系统是金融市场的一种独特方法。ENIGMERA 使用分形周期来精确计算支撑和阻力水平。它展示了真实的积累阶段,并提供了方向和目标。无论是在趋势中还是在修正中,这个系统都能工作。 它是如何工作的 指标的大部分功能通过图表左侧的按钮控制,使得能够快速响应不同的市场情况。 按钮 ON/OFF – 显示或隐藏整个指标。 Channel – 激活支撑通道,显示可接受的偏差范围。 Dev1 (第一偏差) – 指示价格在支撑偏差内的波动,信号表示市场正在整合或积累力量。 Dev2 (第二偏差) – 显示价格在偏差之间的波动,表示趋势形成和方向。 Dev3 (第三偏差) – 表示趋势的显著加速和高波动性。 45deg (45度) – 显示市场的节奏和相对于 45 度线的运动稳定性。 Tgt1/2
PTS Precision Index Oscillator V2
PrecisionTradingSystems
5 (1)
精密指数振荡器(Pi-Osc)由Precision Trading Systems的Roger Medcalf开发 版本2经过精心重新编码,以在您的图表上加载速度非常快,还加入了一些其他技术改进,以提高体验。 Pi-Osc旨在提供准确的交易定时信号,旨在找到极端的耗尽点,这些点是市场被迫去触及,以清理每个人的止损单。 该产品解决了一个古老的问题,即知道极端点在哪里,这使得交易员的生活变得更加简单。 这是一个高度复杂的共识指标,与行业标准的振荡器相比,具有一些强大的区别。 它使用的一些特征包括需求指数、资金流动、RSI、随机指标、模式识别、成交量分析、标准偏差极端点以及不同长度上述各种变化的分歧。 乍一看,对于未经培训的人来说,它似乎与任何其他振荡器没有什么不同,但当与其他振荡器(如RSI或动量等)相对比时,这个指标的真正威力开始显现。 据我所知,没有其他振荡器可以频繁地精确指出顶部和底部,具有相同的定期效率。 精密指数振荡器由许多不同的数学方程组成,用于测量多个时间框架采样中的价格和成交量变动,从而高度准确地预测趋势可能发生转折的位置。 PTS Pi-Osc V2非
MetaBands M4
Vahidreza Heidar Gholami
5 (3)
MetaBands使用强大且独特的算法绘制通道并检测趋势,以便为交易者提供进出交易的潜在点。它是一个通道指标和强大的趋势指标。它包括不同类型的通道,可以通过使用输入参数简单地合并以创建新通道。MetaBands使用所有类型的警报通知用户市场事件。 功能 支持大多数通道算法 强大的趋势检测算法 能够合并不同类型的通道 多时间帧和多货币(信号矩阵) 所有类型的警报功能(声音、屏幕闪烁、推送通知、电子邮件、弹出窗口、箭头) 它永远不会重绘 趋势检测 MetaBands使用在通道内振荡的蓝色线来检测趋势。当该线遇到通道的上界时,表明开始下跌趋势,当它遇到下界时,表明开始上涨趋势。如果蓝线接近中线,则市场处于整理期。 该指标使用独特的方法来检测趋势。一开始可能看起来有些复杂,但如果您观看视频教程,您就会意识到它是多么强大且易于使用。 入场和出场信号 当趋势变化或价格穿过上下通道时,MetaBands会立即通过不同的方法提醒交易者,这些方法可以在指标设置中启用。 信号矩阵 要监视来自不同时间框架的多个符号并在一个地方查看信号,请单击右上角按钮或按键盘上的M键以打开信号矩阵。该矩阵可以快速概览
[V 1.00] MTF NRPA 5 RSI RTD 已发布! 非重绘箭头实时仪表板。 如果您厌倦了使用各种 RSI 指标但发现它们不准确,那么试试这个工具。 通常人们只设置 1 个 RSI 来确定一个时间范围内的 OBOS 水平。 坏消息是您无法同时看到不同时间范围内的 OBOS 水平和趋势。 这就是我开发此交易工具的原因。 解释如下: 在这个交易工具上,我使用了五个 RSI。 是的,五个! 默认情况下,我在较大的时间范围内设置 RSI 1 和 RSI 2,即 M30。 RSI 1 和 RSI 2 的交集意味着 M30 时间框架上有趋势变化。 然后我在当前(小)时间范围内设置 RSI 3 和 RSI 4,例如您在 M5 上打开图表。 RSI 3 和 RSI 4 的交集意味着当前时间帧 (M5) 有趋势变化。 然后为了确保趋势运动,我在更高的时间框架 (H1) 上设置了 RSI 5。 当 RSI 5 越过 50 水平(您可以设置时间范围和 OBOS 水平)时,箭头将出现。 这个交易工具有很多令人惊奇的东西: 您可以根据自己的意愿更改五个 RSI 时间范围。 您可以更改线
Cyclic Impulse
Vitalyi Belyh
构建图表并识别周期性价格变动的技术指标。 可以在任何图表上工作。 几种类型的通知。 图表本身还有额外的箭头。 无需重新绘制历史记录,只需关闭蜡烛即可。 建议使用 M5 及以上的 TF。 易于使用和配置参数。 当使用 2 个具有不同参数的指标时,您可以单独使用它们,而无需其他指标。 有 2 个输入参数 周期性和信号持续时间 这两个参数处理图表结构的处理。 Cyclicity 调节反转周期的变化频率,平滑周期。 Signal duration 为最小数字,检测价格变动中的脉冲,最大长期趋势变动。    ---------------------------------------------------------------------------------------
Volume by Price MT4
Brian Collard
4.64 (11)
The Volume by Price Indicator for MetaTrader 4 features Volume Profile, Footprint and Market Profile TPO (Time Price Opportunity). Volume and TPO histogram bar and line charts. Volume Footprint charts. TPO letter and block marker collapsed and split structure charts. Static, dynamic and flexible range segmentation and compositing methods with relative and absolute visualizations. Session hours filtering and segment concatenation with Market Watch and custom user specifications. Graphical layeri
Trade Invest Pro
Dmitriy Kashevich
Trade Invest Pro - Boss in the world of cryptocurrency! This indicator is ideal for cryptocurrency trading! Work on Trade Invest Pro took us half a year! But not in vain! Now only accurate signals near support - resistance levels! He showed himself well on timeframes m5 m15 for binary options! Optionally, it can be configured for forex for timeframes m30 and more! Reacts well to news! Doesn't paint! and does not disappear from the schedule! As soon as a red arrow appears, open a deal fo
[V 1.00] MTF NRPA 5 移动平均 RTD 已发布! 非重绘箭头实时仪表板。 如果您正在寻找最好的移动平均线指标,那么您来对地方了。 通常人们会设置两条移动平均线,因为两条移动平均线的交点(交叉)将决定下一个价格趋势的方向。 如果快速移动平均线与慢速移动平均线相交且快 > 慢则趋势向上。 相反,如果快速移动平均线与慢速移动平均线相交且快 < 慢,则趋势向下。 两条均线的缺点是看不到长期趋势。 这就是我开发此交易工具的原因。 解释如下: 在这个交易工具中,我使用了五个移动平均线。 是的,五个! 默认情况下,我将 MA 1 和 MA 2 设置在较大的时间范围内,即 H1。 MA 1 和 MA 2 的交集意味着 H1 时间帧上有趋势变化。 然后 MA 3 和 MA 4 我在当前时间范围(小)上设置,例如,您在 M5 上打开图表。 MA 3 和 MA 4 的交叉点表示当前时间范围 (M5) 有趋势变化。 然后为了确认趋势运动,我在当前时间范围内设置了 MA 5。 这个交易工具有很多令人惊奇的东西: 您可以根据自己的喜好更改五个 MA 的时间范围。 您可以更改线条样式
Cycle Sniper
Elmira Memish
4.39 (36)
NEW YEAR SALE PRICE FOR LIMITED TIME!!! Please contact us after your purchase and we will send you the complimentary indicators to complete the system Cycle Sniper is not a holy grail but when you use it in a system which is explained in the videos, you will feel the difference. If you are not willing to focus on the charts designed with Cycle Sniper and other free tools we provide, we recommend not buying this indicator. We recommend watching the videos about the indiactor and system before pu
Grand signal
Alexandr Lapin
5 (2)
The Grand Signal indicator is a unique tool that not only provides an understanding of market behavior but also precisely identifies trend entry points after intraday correction limits, with accuracy down to a five-minute candlestick! It includes individual settings for each currency pair. After purchasing, be sure to message me directly for instructions! Telegram: @Lapinsania or here in the Market! I
作者的更多信息
The YFX Symbol Data indicator is used to display all the information about the current chart symbol. The indicator makes it easy to examine much more information than just the bid/ask price. Information is categorized as follows: Basic Information - The most generic information about a symbol. It includes the symbol name, bid/ask prices, and spread data. It also includes the low price and high price reached during the current period. Timeframe Information - More details about the current timefra
The Advanced EMA indicator implements an exponential moving average with many additional features. First, EMA is color-coded to indicate distance between the price and EMA. This Advanced EMA has many features and configurations that set it far above standard EMA indicators used most platforms. There are 3 types of indications in the indicator. The EMA is color-coded. Secondly, cross points of price and EMA are marked. Thirdly, BUY/SELL signals are shown.‌ Color-coding the EMA allows you to easil
YFX Zones
Richard Yancy
The Zones indicator provides a visual display of the boundaries around a price action. There are two types of zones included in the indicator: High-Low price zones Time period zones (delineations) High-Low price zones display the boundaries of the High and Low price points. Typically, these zones are displayed for the High and Low price of the day. Time period zones display boundaries around time period intervals. PARAMETERS Yancy indicator IndicatorName – indicator name displayed in the chart
The YFX Symbol Watermark indicator is used to display a watermark on your chart, which makes it easy to see at a glance the symbol information for any chart. The displayed information includes: Symbol Name and Timeframe on the chart Description of the currencies Tag line, which can contain any user-defined information All the information can be displayed on the chart so that it can be easily read. The indicator also has parameters that can be set to customize which information is displayed. Para
The YFX Symbol Selector indicator is used to easily change the chart symbol and period with a click of a button. This is done by using a selector GUI object that can be placed on any corner of the chart. The GUI selector contains the following information: Descriptive header for GUI selector panel Symbol information and controls for changing the chart symbol Period information and controls for changing the chart period Footer containing the current bid/ask quote for the currently selected symbol
The Candle Patterns indicator provides a visual display of candlestick patterns. There are more than 100 patterns that can be displayed. The indicator allows for candles on the chart to be grouped and considered as one candle. This allows the price action within a candle to be observed in the context of a candlestick pattern. The number of bars per candle can be set in the parameters. All patterns can be filtered so that only patterns with certain attributes are displayed. The prior trend is tak
The Wing Patterns indicator scans for many different kinds of Patterns using an XABCD structure. The term Wing Pattern is used to refer to all types of patterns based on a general XABCD structure, which is plotted in an alternate high-low extreme form. In other words, assume that point X is started at a low point on the chart. The point A is plotted at the next highest point within a certain number of bars. This certain number of bars is called the depth level. In this example, point B would be
This indicator contains a custom version of the classic Turtle Trader indicator. It implements both the main system ( S1 ) and fail-safe system ( S2 ) as described by the original Turtles. Notifications can also be enabled for trade signals. The main rule of the indicator is to generate a signal when a T -period breakout occurs. A stop signal is then generated when an S -period high or low is breached. The T -period value is the number of periods used to evaluate a trend. S -period values are th
The Advanced Bands indicator is a custom indicator based on the classic Bollinger Bands as created by John Bollinger. Generally, Bollinger Bands are created by adding/subtracting a number of standard deviations from the price. Advanced Bands also creates bands the same way and adds more features to be more useful for traders.   FEATURES Three levels of bands (inside, outside, extreme) and a moving average can be plotted. Area between bands can be filled and highlighted. Number of deviations for
The Advanced Bands Squeeze indicator is a custom indicator based on the classic Bollinger Bands as created by John Bollinger. The Bollinger Band Squeeze occurs when volatility falls to low levels and the Bollinger Bands narrow. This low volatility level is called a “Squeeze”.  According to John Bollinger, periods of low volatility are often followed by periods of high volatility, where prices tend to move a lot in either direction. Therefore, a volatility contraction or narrowing of the bands
筛选:
无评论
回复评论
版本 6.2 2022.06.02
* Added relative currency strength indication.
* Added machine learning hooks.
* Improved performance updates.
版本 6.0 2020.06.12
- Updated to work with current versions of MetaTrader 4.
版本 2.0 2016.06.30
The new version 2.0 contains the following features:

* A different time frame can be used in currency strength calculations as opposed to just using the chart time frame. This adds a greater amount of flexibility to the indicator. Traders can now track relative currency strengths on a daily basis, for example, while looking at an hourly chart.

* Indicator can now be displayed in any corner of the chart. It can also be displayed in the original comment section. The location within the corner can be adjusted too. Traders are no longer restricted to only having the indicator in the comment section.

* The font and font size can now be chosen by user. Different font colors can be used when an alert is triggered. The indicator can now be made more clearly visible on the chart.

* Alert and messaging options have been enhanced. Alerts and messages can be sent via comments, alerts, push notifications, or e-mail. They can also be written to the journal/output window or an external file. this allows traders to be notified quickly when certain conditions are met.

* Quiet time feature has been created for messages. User can set time period where no alerts or messages will be sent. Enabling this feature will not have an effect of the indicator's functionality. This can allow traders to get some sleep without being awaken by alerts and messages.