Jmti
- 指标
- Jaco Moolman
- 版本: 1.0
- 激活: 5
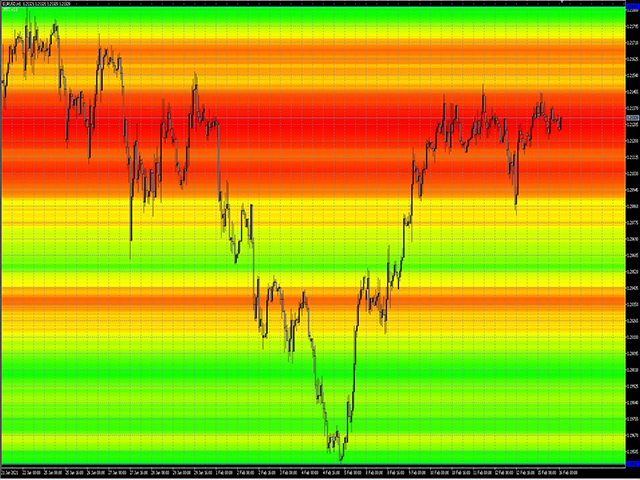
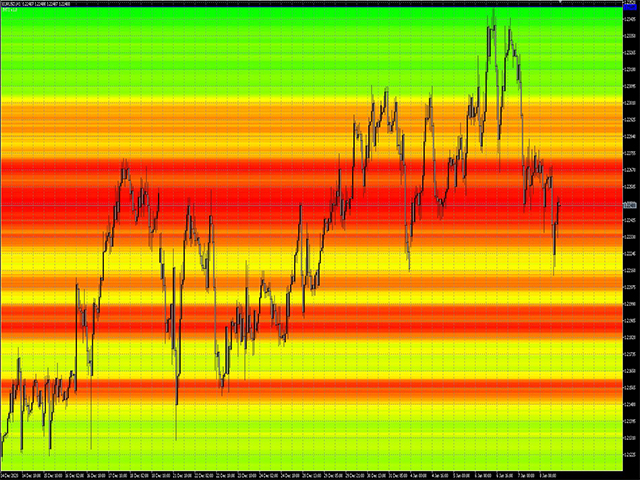
J.M.T.I
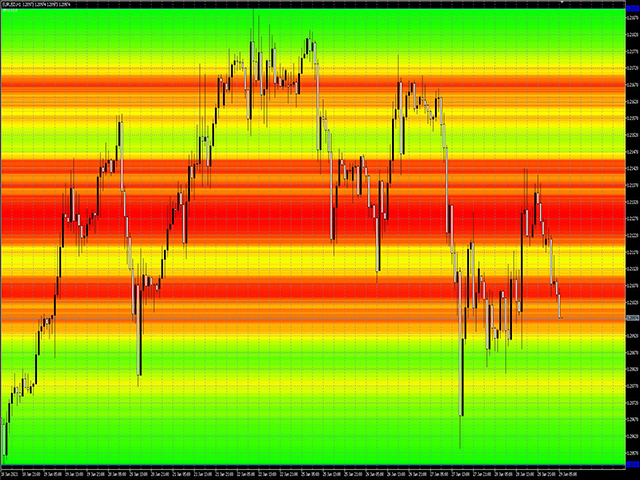
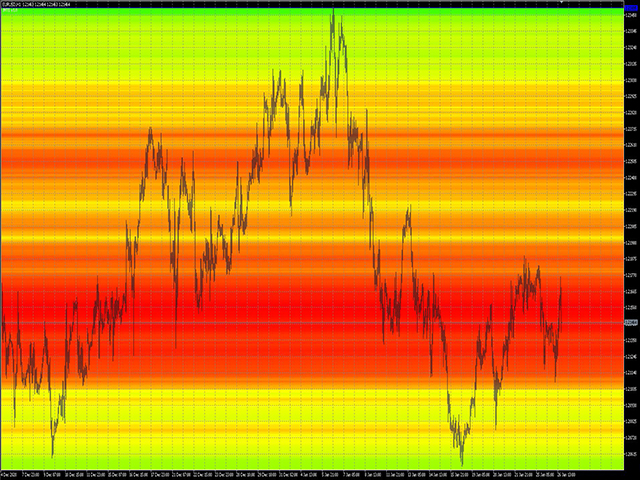
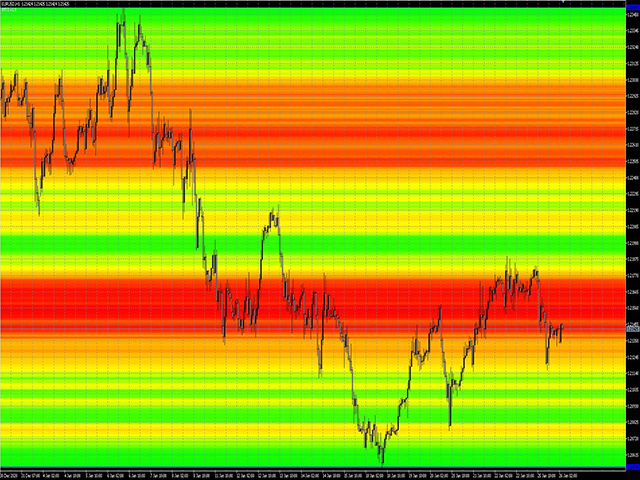
This indicator automatically shows a level or support and resistance in the currant market.
- Can be used on any time frame
- Can be used on any currency pair
- Works on the active bars in the window
- To add more bars one can simply zoom out.
- Red zones can be strong liquidity pools.
- Green zones usually is where an possible break out might occur.
- The higher the contrast of the colors the stronger the support or resistance levels will be.
- The indicator has an option to refresh on each tick (for live trading) or on each bar (for back testing) to speed up the back testing.
- Can be used in conjunction with Fibonacci indicator for even better results (not part of JMTI indicator)