CandleStick Scanner X
- 指标
- Noor Ghani Rahman
- 版本: 1.0
- 激活: 5
They are used to describe the price action during the given time frame. Japanese candlesticks are formed using the open, high, low, and close of the chosen time period.
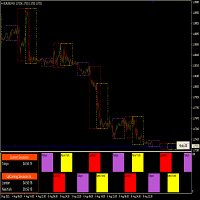
CandleStick Scanner X provides market analysis through the detection and analysis of Japanese candlestick patterns.
Candlestick based market analysis is one of the most popular technical analysis methods. Combinations of candlesticks are used for two purposes. Firstly, they help identify the current trend and determine the suitable entry points for long and short positions. Secondly, they help to identify possible pivot points of the main trend.
The main principle of candlestick pattern analysis is finding standard patterns (reversal or trend continuation), by interpreting which you can predict further price action.
What will CandleStick Scanner X do on your chart for your better market analysis
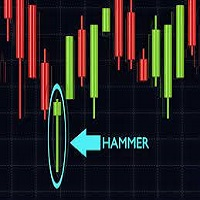
- An automatic indicator, which recognizes and analyzes various candlestick combinations (Like Reversal Patterns and Continuation Patterns): name of some are Hammer, Hanging Man, Inverted Hammer, Shooting Star, Bearish Engulfing, Bullish Engulfing, Bullish Harami, Bearish Harami, Piercing Line, Dark Clouds, Morning Star ,Evening Star, etc,.
- A text label on a chart notifying of a detected pattern.
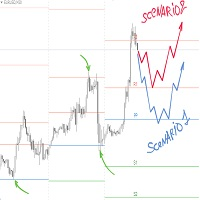
- Graphical display of significance of the found pattern (arrow up or down, suggesting further price movement).
- The indicator will works on any timeframe upon which you keep the indicator.


