VSA screener
- 实用工具
- Mikhail Nikolchak
- 版本: 1.0
Imagine what results you could achieve in your manual trading if you had a tool that notifies you of a possible price reversal for all the symbols you are interested in at the same time (futures, stocks, forex or cryptocurrency)?
VSA screener is just the right tool. It was created for traders who value their time and make their own trading decisions on opening or closing a position. The software monitors the presence of trading patterns on the preselected tickers under several timeframes (up to 6) simultaneously and displays all key information on the screen in the most efficient way, being a preliminary filter for choosing a ticker and a timeframe for trading.
VSA screener is based on Volume Spread Analysis (VSA), which analyzes the very essence of price fluctuation (volume and price movement) to warn about possible reversals. The approach has proven its effectiveness over more than 100 years of its development. So VSA knowledge is highly recommended to use this tool properly.
VSA screener is optimized for smooth operation under high loads, as it needs to process data from more than 100 charts simultaneously.
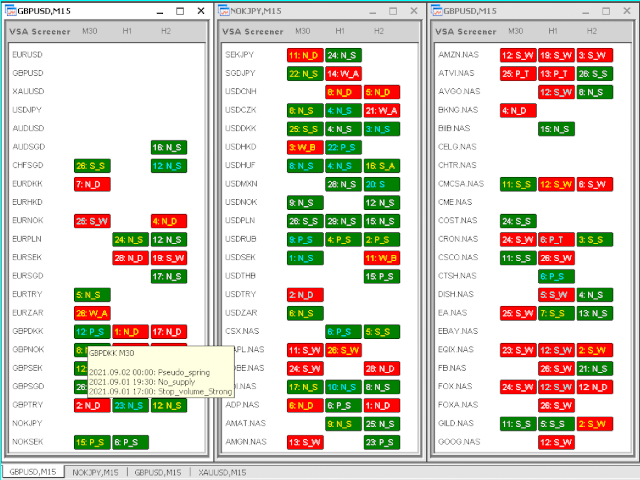
The software presents a dynamic table displaying all the key information for selecting a symbol for a more detailed analysis:
- Presence of VSA pattern(s) indicating the bar number (counting from the end, current bar - zero bar)
- Abbreviated pattern name
- The strength and weakness of the pattern are displayed in green or red, respectively.
- When hovering over a specific cell with an indication, a pop-up window will appear indicating the last few patterns within the selected depth (20 last bars by default), as well as the time of their occurrence.
- The text color in the indication shows the presence of one (white text) or several patterns at the selected historical depth. Yellow shows that the patterns point to opposite directions, blue - if they are in one direction, which significantly increases the likelihood of signal processing.
This configuration allows to identify the most promising symbols for trading at a glance.
Available patterns and their abbreviated display:
Weakness signals (warn of the end of an uptrend and/or the beginning of a downtrend)
- Weakness A (W_A)
- Weakness B (W_B)
- No demand (N_D)
- Up thrust (U_T)
- Pseudo_up thrust (P_U)
- Stop volume Weak (S_W)
Strength signals (warn of the end of a downtrend and/or the beginning of an uptrend)
- Strength_A (S_A)
- Strength B (S_B)
- No supply (N_S)
- Spring (S)
- Pseudo spring (P_S)
- Stop volume Strong (S_S)
Advisor settings:
- Select the first symbol available in the Market Watch
- Input the number of symbols displayed in the Market Watch
- Choose type of volumes: tick or real
- Input the number of bars to be displayed in VSA screener
- Adjust vertical or gorizontal shift of the table to fit the window in the best way
- Choose working timeframes (up to 6 at the same time)
- Select the types of patterns to display
- Important: To test the VSA screener in the strategy tester, you can create a list of several symbols in the corresponding settings section.

