InputLess Signal Generator
- 指标
- Igor Gerasimov
- 版本: 1.2
- 更新: 18 六月 2021
- 激活: 5
//////////////////////////////////////////////////////////////////////////////////////////////////
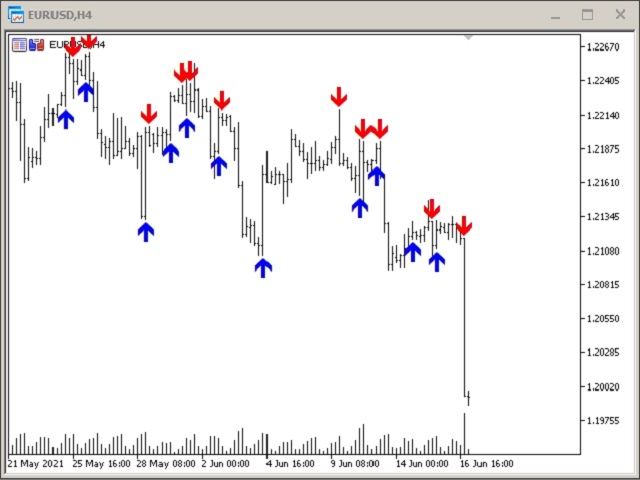
这很简单 - 没有设置。
只需要指定箭头的颜色和大小。
该指标的读数也很容易理解。 向上箭头是买入信号,向下箭头是卖出信号。
尝试在策略测试器中对其进行测试 - 你会喜欢的!!!
///////////////////////////////////////////////// ///////////////////////////////////////////////////
我希望该指标对您成功交易非常有用。
祝你好运。