• 概述
  • 评论
  • 评论 (11)
  • 新特性

True Oversold Overbought

The True Oversold Overbought indicator provides you with ability to swiftly check whether the asset is oversold or overbought. 

  • Other than complementing your trading with True Oversold Overbought, you can use the indicator as your only trading system.
  • It works with all forex instruments and will save you the headache of estimating when the market is due for a reversal or retracement. 

  • When the "Super Charge" feature is enabled, the areas where the price is in oversold/overbought status are amplified to give you a clear state of the market,therefore, you will not miss the moment to prepare for a reversal/retracement.
  • Alternatively, when the "Super Charge" feature is disabled, the indicator still shows the oversold and overbought levels but this time you get a broader view of the market. 
  • Get alerts when price bleach the oversold/overbought levels.
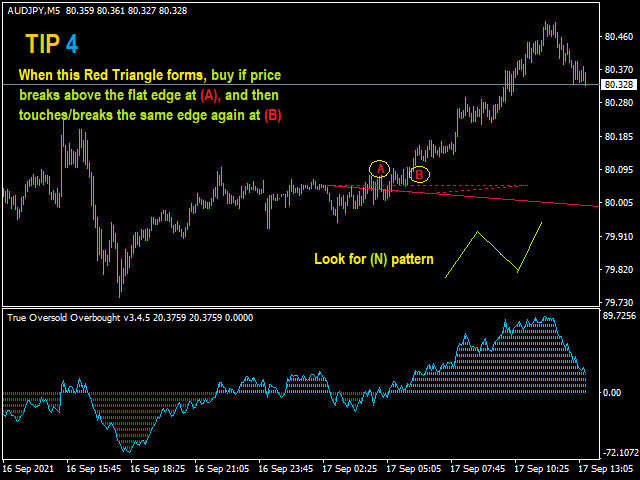
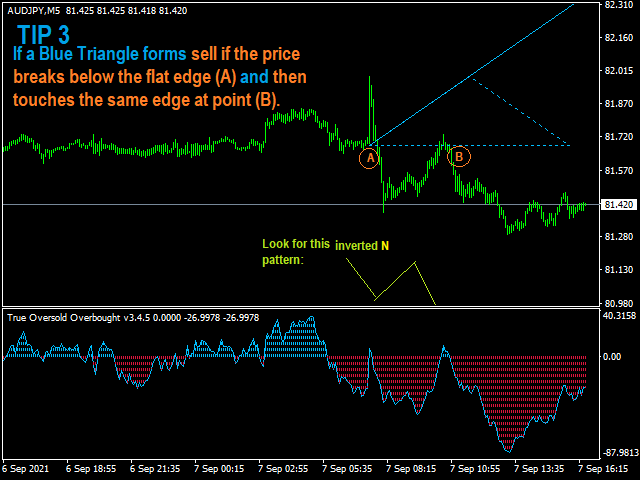
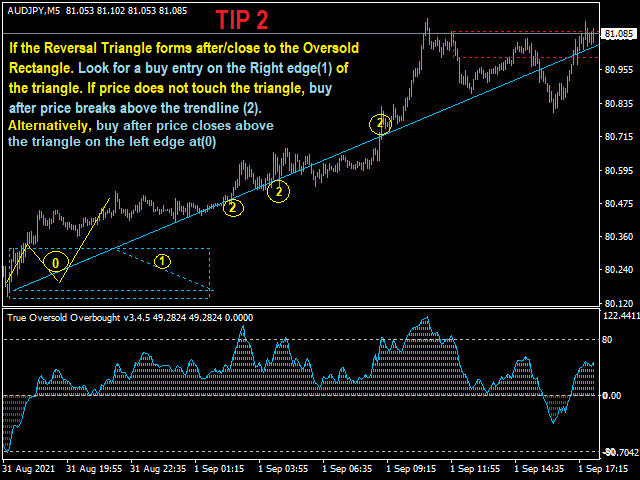
  • See reversal areas which are indicated by a triangle and trendline.

True Oversold Overbought (MT5) >> Download MT5 Version


BUY True Oversold Overbought  and get a FREE GOLD GRID TRADER EA (Mt4 Version).

    Advantages

    • It is not overly sensitive or keep touching oversold/overbought levels.
    • Open trades early when the price is exiting exiting overbought / oversold levels and close trades at the right time.
    • Trade when there is noise and when the market is silent.

    Settings

    No complex settings since the default settings work perfectly. However, the following is all you can add if you want to change a few things.

    • Select between old and new version of the indicator 
    • Add the Coefficient value.
    • Add Price Smoothing
    • Add your RSI period
    • Add your Money Flow Index (MFI) period
    • Enable/Disable the Super Charge feature. 
    • Add the Super Charge and Ordinary Sell and Buy levels that suits your trading. All is drawn automatically.
    • Enable drawing of rectangles - shows boxes where price is in the extremes.
    • Alerts
    • Reversal settings

    Basic Usage

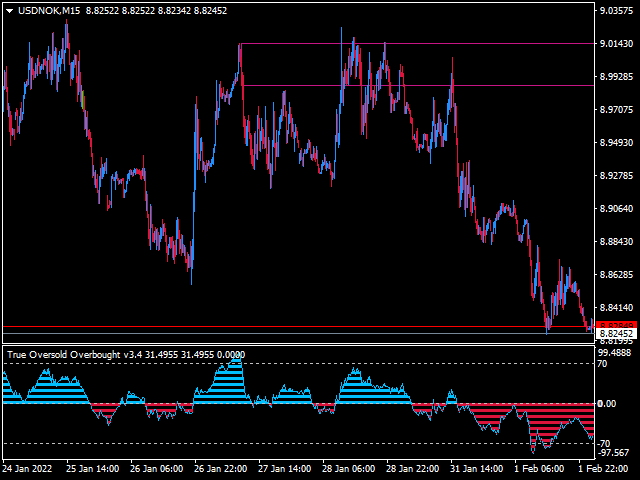
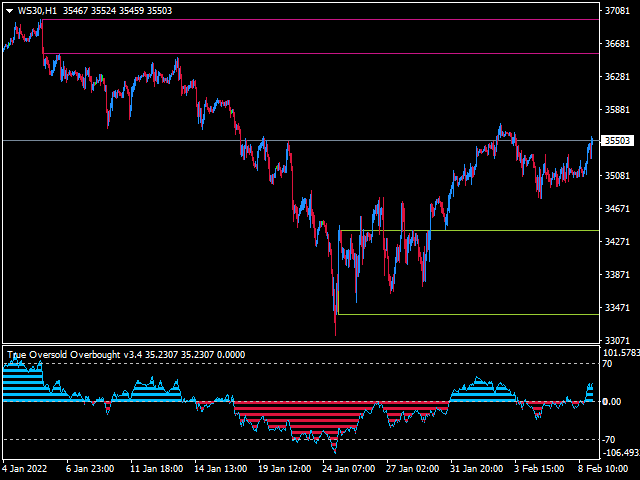
    The indicator displays on the separate window and also show rectangles on the main chart.

    When the overbought and oversold rectangles draw, it is time to buy if price opens above the rectangles and sell if the candle opens below.

    Note: If the overbought rectangle is formed but a candle open above it, its an indication the trend will continue surging for a while before breaking below.

    Similarly, the continued drop in price below the oversold rectangle indicates the price might continue in the same direction before bulls takes control.

    Trading tips (New Upgrade tips):https://www.mql5.com/en/blogs/post/750019

    Other indicators: https://www.mql5.com/en/users/pipmontra/seller

    Manual Part 1 |  Manual-Multi-timeframe  Part 2 |  Manual-New update Part 3

    推荐产品
    Forex Gump
    Andrey Kozak
    2.4 (5)
    Forex Gump is a fully finished semi-automatic trading system. In the form of arrows, signals are displayed on the screen for opening and closing deals. All you need is to follow the instructions of the indicator. When the indicator shows a blue arrow, you need to open a buy order. When the indicator shows a red arrow, you need to open a sell order. Close orders when the indicator draws a yellow cross. In order to get the most effective result, we recommend using the timeframes H1, H4, D1. There
    Infinity Trend Pro
    Yaroslav Varankin
    1 (1)
    This is a trend indicator without redrawing Developed instead of the binary options strategy (by the color of the Martingale candlestick) Also works well in forex trading When to open trades (binary options) A signal will appear in the place with a candle signaling the current candle It is recommended to open a deal for one candle of the current timeframe M1 and M5 When a blue dot appears, open a deal up When a red dot appears, open a trade down. How to open trades on Forex. When a signal is rec
    VR Cub
    Vladimir Pastushak
    VR Cub 这是获得高质量切入点的指标。该指标的开发是为了促进数学计算并简化对仓位入场点的搜索。多年来,该指标所针对的交易策略已被证明其有效性。交易策略的简单性是其巨大的优势,即使是新手交易者也能成功进行交易。 VR Cub 计算开仓点以及获利和止损目标水平,这显着提高了效率和易用性。查看使用以下策略进行交易的屏幕截图,了解简单的交易规则。 设置、设置文件、演示版本、说明、问题解决,可以从以下位置获取 [博客] 您可以在以下位置阅读或撰写评论 [关联] 版本为 [MetaTrader 5] 计算入场点的规则 开仓 要计算入场点,您需要将 VR Cub 工具从最后一个高点拉伸到最后一个低点。 如果第一个点在时间上早于第二个点,交易者等待柱线收于中线上方。 如果第一个点在时间上晚于第二个点,交易者等待柱线收于中线下方。 根据上述条件,严格在 柱线收盘 后建仓。 换句话说,如果我们在小时图上进行交易,那么从最高点到最低点的时间距离必须超过24小时,最高点和最低点之间的点数必须大于或等于平均价格变动每天。 维持和改变市场地位 可以有多个未平仓头寸;每个头寸都可以单独修改。 VR Cu
    这是一个预测蜡烛收盘价的指标。 该指标主要用于 D1 图表。 该指标适用于传统外汇交易和二元期权交易。 该指标可以用作独立的交易系统,也可以作为您现有交易系统的补充。 该指标分析当前蜡烛,计算蜡烛本身内部的某些强度因素,以及前一根蜡烛的参数。 因此,该指标预测市场走势的进一步方向和当前蜡烛的收盘价。 由于这种方法,该指标既适用于短期盘中交易,也适用于中长期交易。 该指标允许您设置指标在分析市场情况期间将产生的潜在信号的数量。 在指标设置中有一个特殊的参数。 此外,该指标可以通过图表上的消息、电子邮件以及推送通知的形式通知新信号。感谢您的关注!交易愉快! 购买后一定要写信给我! 我会给你我的交易指标的建议! 还可以获得奖金!
    斐波那契折返和扩展画线工具 适用于MT4平台的斐波那契折返和扩展画线工具,适合于使用黄金分割交易的交易者 优点:没有多余的线,没有过长的线,易于观察发现交易的机会 试用版: https://www.mql5.com/zh/market/product/35884 主要功能: 1.可以直接画出多组斐波那契折返,可以看出重要折返点之间的关系; 2.可以画出斐波那契扩展,比率有三种0.618,1,1.618 3.画出的斐波那契折返和扩展均可左右移动,有数值显示,方便观察 4.可通过数字键切换周期 使用指南和功能键: 1.按 [ 或R画折返,按需要画折返,最多云持8组折返; 2.按 ] 或E画扩展; 3.按 \ 删除当前周期下的所有扩展和折返,其余周期的不受影响 4.如何左右移动折返和扩展 (1)点击第一组折返的F5字符,可以左右移动折返; (2)点击COP的字符 ,可以左右移动扩展; 5. (1)点击第一组折返的F5字符,按del 可以删除这组折返; (2)点击COP的字符, 按del 可以删除这组扩展; 6.修改折返和扩展(随着市场的运行
    The Th3Eng PipFinite indicator is based on a very excellent analysis of the right trend direction with perfect custom algorithms. It show the true direction and the best point to start trading. With StopLoss point and Three Take Profit points. Also it show the right pivot of the price and small points to order to replace the dynamic support and resistance channel, Which surrounds the price. And Finally it draws a very helpful Box on the left side on the chart includes (take profits and Stop loss
    Chart Patterns Detect 15 patterns (Ascending Triangle, Descending Triangle, Rising Wedge, Falling Wedge, Bullish Flag, Bearish Flag, Bullish Rectangle, Bearish Rectangle Symmetrical triangle, Head and Shoulders, Inverted Head and Shoulders, Triple top, Triple Bottom, Double Top, Double Bottom) Use historical data to calculate the probability of each pattern to succeed (possibility to filter notification according to the chance of success) gives graphic indication about the invalidation level and
    Cosmic Diviner X Planet
    Olena Kondratenko
    4 (2)
    This unique multi-currency strategy simultaneously determines the strength of trends and market entry points, visualizing this using histograms on the chart. The indicator is optimally adapted for trading on the timeframes М5, М15, М30, Н1. For the convenience of users, the indicator renders the entry point (in the form of an arrow), recommended take profit levels (TP1, TP2 with text labels) and the recommended Stop Loss level. The take profit levels (TP1, TP2) are automatically calculated for
    Master scalping M1
    Nataliia Marchuk
    Master Scalping M1 is an innovative indicator that uses an algorithm to quickly and accurately determine the trend.The indicator calculates the time of opening and closing positions, the indicator's algorithms allow you to find the ideal moments to enter a deal (buy or sell an asset), which increase the success of transactions for most traders. Benefits of the indicator: Easy to assemble, does not overload the chart with unnecessary information. Can be used as a filter for any strategy. Works on
    PipFinite Exit EDGE
    Karlo Wilson Vendiola
    4.83 (115)
    Did You Have A Profitable Trade But Suddenly Reversed? In a solid strategy, exiting a trade is equally important as entering. Exit EDGE helps maximize your current trade profit and avoid turning winning trades to losers. Never Miss An Exit Signal Again Monitor all pairs and timeframes in just 1 chart www.mql5.com/en/blogs/post/726558 How To Trade You can close your open trades as soon as you receive a signal Close your Buy orders if you receive an Exit Buy Signal. Close your Sell orde
    This is an arrow indicator without a future function,developed based on the most advanced profit trading algorithms.It has the most innovative and advanced dual trend analysis module, as well as the latest and highly effective market trend prediction algorithm.Trends are your friends, and following larger trends can earn the maximum profit in foreign exchange. This indicator helps traders identify current trends and track them. Someone once made a profit of 10 times in a week by relying on it.No
    Atomic Analyst
    Issam Kassas
    5 (2)
    首先值得强调的是,该交易指标是非重绘、非延迟的指标,这使其成为手动和机器人交易的理想选择。 用户手册:设置、输入和策略。 Atomic Analyst是一种PA价格行动指标,利用价格的力量和动量来寻找市场上更好的机会。配备了高级过滤器,可帮助去除噪音和假信号,并提高交易潜力。使用多层复杂的指标,Atomic Analyst扫描图表,并将复杂的数学计算转化为任何初学者都能理解并用来做出一致交易决策的简单信号和颜色。 “Atomic Analyst”是专为新手和经验丰富的交易者量身定制的综合交易解决方案。它将高级指标和一流功能融合为一体的交易策略,使其成为所有类型交易者的多功能选择。 日内交易和剥头皮策略:专为快速准确的日内交易和短期交易而设计。 日内和摆动交易策略:可用作追求价格大幅波动的日内和摆动交易者的可靠工具。 多货币和市场:凭借其可靠的精度,在不同的工具和市场上运作。 多个时间框架:可在多个时间框架上使用,性能良好。 稳定性:所有指标均不重绘、不重绘和不滞后,确保可靠的信号。 信号清晰度:提供箭头信号,用于清晰的入场和出场点。 实时警报:通过交易入场、SL和TP警报通知交
    Signal trend indicator. Detects the direction of the trend and is coloured accordingly.  Has built in audible and visual alerts when trends change. Can send notifications to your phone or email. Allows Trend and Counter-Trend trading. Works on all timeframes, all currency pairs, metals, indices and cryptocurrencies. Can be used with binary options. Distinctive features No re-drawing; Simple and clear settings; Four types of alerts; Works on all timeframes and all trading tools; Su
    Owl smart levels
    Sergey Ermolov
    4.34 (35)
    MT5版本  |  FAQ Owl Smart Levels Indicator   是一個完整的交易系統,包含   Bill Williams   的高級分形、構建正確的市場波浪結構的 Valable ZigZag 以及標記準確入場水平的斐波那契水平等流行的市場分析工具 進入市場和地方獲利。 策略的详细说明 指示灯使用说明 顾问-贸易猫头鹰助手助理 私人用户聊天 ->购买后写信给我,我会将您添加到私人聊天中,您可以在那里下载所有奖金 力量在於簡單! Owl Smart Levels   交易系統非常易於使用,因此適合專業人士和剛開始研究市場並為自己選擇交易策略的人。 策略和指標中沒有隱藏的秘密公式和計算方法,所有策略指標都是公開的。 Owl Smart Levels 允許您快速查看進入交易的信號,突出顯示下訂單的水平並向您發送有關已出現信號的通知。 優點很明顯: 清楚地顯示主要和更高時間框架的趨勢方向。 指示儀器信號的出現。 標記開單、止損設置和固定利潤的水平。 沒有多餘的,只有必要的結構! ZigZag   表示全球趨勢的方向,因此也表示貿易方向。 市場反轉點的短線清楚地表明在
    Super Reversal Pattern
    Parfait Mujinga Ndalika
    Super Reversal Pattern Indicator Unlock the power of advanced pattern recognition with our Super Reversal Pattern Indicator. Designed for traders seeking precision and reliability, this indicator identifies one of the most effective reversal patterns in technical analysis, offering a significant edge in your trading strategy. Key Features: Non-Repainting Accuracy: Enjoy the confidence of non-repainting technology. Once a Super Reversal Pattern is detected, it remains static, providing consis
    Indicador Taurus All4
    Fabio Oliveira Magalhaes
    Taurus All4 Taurus All4 is a high-performance indicator, it will tell you the strength of the trend, and you will be able to observe the strength of the candle. Our indicator has more than 4 trend confirmations. It is very simple and easy to use. Confirmation Modes Candle Trend Confirmations: When the candle switches to light green the trend is high. When the candle switches to light red the trend is reverting down. When the candle changes to dark red the trend is low. Trendline Trend Conf
    DayTradeKing
    Thomas Bradley Butler
    This indicator is good for small time frames like 1 and 5 minutes and made for day trading. The indicator never repaints or recalculates. The indicator works is for trading swing points in day trading, following bulls or bears.  Its a simple to use, non cluttered indicator with a high success rate.  This indicator works well to capture ranges.  All indicators come with limitations and no indicator or system is always accurate. Use money management for long term trading success.   Place in backte
    Awesome Oscillator by Bill Williams with the ability to fine-tune and replace the averaging algorithms of the indicator, which significantly expands the possibilities of using this oscillator in algorithmic trading and brings it closer in its properties to such an indicator as the MACD. To reduce price noise, the final indicator is processed with an additional Smooth averaging. The indicator has the ability to give alerts, send mail messages and push signals when the direction of movement of th
    我们为您提供一个指标"蜡烛收盘台",它将成为您在贸易领域不可或缺的助手。 这就是为什么知道蜡烛何时关闭会有所帮助的原因: 如果你喜欢使用蜡烛花纹进行交易,你就会知道蜡烛何时关闭。 此指标将允许您检查是否形成了已知模式以及是否存在交易的可能性。 该指标将帮助您做好市场开放和市场关闭的准备。 可以设置一个计时器来创建计划新闻的预览,这样就可以检查市场对此的反应。 您可以设置指示灯,以便在蜡烛关闭前几秒钟发送警报/警告。 通知/警报/警报可以发送到: 屏幕警报 电子邮件 移动应用 MT4烛台计时器指示器为什么有用 那么烛台计时器什么时候有用呢?如果你长期交易,你可能不需要蜡烛计时器指示器,因为你的参赛不会受到一分钟或一小时的太大影响。但是,如果你在短时间内是黄牛或交易员,那么你知道时机非常重要。 外汇市场24小时开放,只在周末关门,有些策略可能会受到您入仓时出现错误时机的严重影响。 MT4蜡烛计时器指示器可以显示当前蜡烛中的剩余时间,以便为下一次蜡烛打开做好准备。 可以从这一指标中受益的一些情况例子有: 预定消息传出 地理市场开闭 预定发生的事件,通常是金融、经济或
    Fourteen plus nine TD Sequential
    MOHAMMED IMAD HUSSEIN BASSEE
    Fourteen plus nine What is it for? Applying Tom DeMark’s TD Sequential serves the purpose of identifying a price point where an uptrend or a downtrend exhausts itself and reverses. . What are the main components of TD Sequential? TD Sequential has two parts – TD Setup and TD Countdown. The first phase of TD Sequential starts with a TD Setup and is completed with a 9 count. When the 9 count is completed, it is at that point, a price pause, price pullback, or reversal is likely. It is also at tha
    PipFinite Trend PRO
    Karlo Wilson Vendiola
    4.89 (2359)
    Breakthrough Solution For Trend Trading And Filtering With All Important Features Built Inside One Tool! Trend PRO's smart algorithm detects the trend, filters out market noise and gives entry signals with exit levels. The new features with enhanced rules for statistical calculation improved the overall performance of this indicator. Important Information Revealed Maximize the potential of Trend Pro, please visit www.mql5.com/en/blogs/post/713938 The Powerful Expert Advisor Version Automa
    The principle of this indicator is very simple: detecting the trend with Moving Average, then monitoring the return point of graph by using the crossing of Stochastic Oscillator and finally predicting BUY and SELL signal with arrows, alerts and notifications. The parameters are fixed and automatically calculated on each time frame. Example: If you install indicator on EURUSD, timeframe M5: the indicator will detect the main trend with the Moving Average on this timeframe (for example the Moving
    Trade with Gann on your side!! MASTER CIRCLE 360 CIRCLE CHART, originally created by Gann admitted that this is “The Mother of all charts”. It is one of the last studies that this great trader left for us. The numeric tab le is apparently quite simple like all the tables and is based on square numbers, the SQUARE OF 12 and is by evolution, one of the most important square numbers. Here we can find CYCLE, PRICE AND TIME thanks to angles and grades, to show past and future support and resistance.
    Trendiness Index
    Libertas LLC
    5 (3)
    "The trend is your friend" is one of the best known sayings in investing, because capturing large trendy price movements can be extremely profitable. However, trading with the trend is often easier said than done, because many indicators are based on price reversals not trends. These aren't very effective at identifying trendy periods, or predicting whether trends will continue. We developed the Trendiness Index to help address this problem by indicating the strength and direction of price trend
    Insider Scalper Binary This tool is designed to trade binary options. for short temporary spends. to make a deal is worth the moment of receiving the signal and only 1 candle if it is m1 then only for a minute and so in accordance with the timeframe. for better results, you need to select well-volatile charts.... recommended currency pairs eur | usd, usd | jpy .... the indicator is already configured, you just have to add it to the chart and trade .... The indicator signals the next can
    AlgoSamurai Kana Trend
    BLAKE STEVEN RODGER
    Cutting-edge solution for Trend Trading with statistically robust signals! Kana Trend’s smart algorithm detects the trend on any instrument, any timeframe, and gives powerful entry signals with exit levels.  Its advanced statistics gives you deep insight as to success and profitability of its signals -- while being fully transparent on any potential for loss.  Because this is an indicator, not an EA, you cannot see it in action in visual tester if you download the Free Demo. Instead, please down
    Point61 Indicator
    Evgeniy Machok
    5 (1)
    The Point61 indicator is the result of many years of monitoring of price behavior of currency pairs and metals. It is not a secret, that in times of uncertainty, traders are looking for possible levels of support and resistance - the point, where price should stop its movement. There are 2 possible scenarios at these points: 1. Reverse (correction) to the opposite direction; 2. Breakthrough to continue movement. Very often these points are used to set stop orders - TakeProfit or
    This is the FXTraderariel-TakeProfit - Stop Loss Indicator . It provides you 3 potential Take Profits and 1 Stop Loss. These potential targets are computed based on several methods . The indicator can be used on every time frame, but we advise to use it on H1, H4 and D1. Especially if you are a novice trader. Pro Traders can also you use it for scalping in smaller time frames (M1, M5 and M15). This indicator is not a complete trading system. It doesn't provide you a Signal nor can predict the m
    Riko Trend
    Nadiya Mirosh
    The Riko Trend indicator is a revolutionary trend trading and filtering solution with all the important features of a trend tool built into one tool! The Riko Trend indicator is good for any trader, suitable for any trader for both forex and binary options. You don’t need to configure anything, everything is perfected by time and experience, it works great during a flat and in a trend. The Riko Trend indicator is a technical analysis tool for financial markets that reflects the current price
    GJ Options
    Sayan Vandenhout
    GJ OPTIONS USES THE TREND WAVE INDICATOR AND IT CAN IDENTIFY THE BEGINNING AND THE END OF A NEW WAVE TREND MOVEMENT. AS AN OSCILLATOR, THE INDICATOR IDENTIFIES THE OVERBOUGHT AND OVERSOLD ZONES. IT WORKS GREAT TO CATCH THE SHORT TERM PRICE REVERSALS AND USES A MARTINGALE STRATEGY TO CLOSE ALL TRADES IN PROFIT. USE DEFAULT SETTINGS ON H1 OR HIGHER TIME FRAME ON ANY PAIR FOR MORE ACCURATE TRADES WHY THIS EA : Smart entries calculated by 5 great strategies The EA can be run on even a $20000 account
    该产品的买家也购买
    Scalper Inside PRO
    Alexey Minkov
    4.73 (56)
    An exclusive indicator that utilizes an innovative algorithm to swiftly and accurately determine the market trend. The indicator automatically calculates opening, closing, and profit levels, providing detailed trading statistics. With these features, you can choose the most appropriate trading instrument for the current market conditions. Additionally, you can easily integrate your own arrow indicators into Scalper Inside Pro to quickly evaluate their statistics and profitability. Scalper Inside
    目前八折优惠! 对任何新手或专家交易者来说都是最好的解决方案! 这个仪表板软件适用于28种货币对。它基于我们的两个主要指标(高级货币强度28和高级货币冲动)。它对整个外汇市场提供了一个伟大的概述。它显示高级货币强度值,货币运动速度和28个外汇对在所有(9)时间段的信号。想象一下,当你可以使用图表上的单一指标观察整个市场,以确定趋势和或剥头皮的机会时,你的交易将得到改善 我们已经在这个指标中建立了一些功能,使你更容易识别强势和弱势货币,同时识别和确认潜在的交易。该指标以图形方式显示货币的强势或弱势是增加还是减少,以及它在所有时间段的表现。 增加的新功能是动态市场斐波那契水平,它适应当前的市场条件变化,这是一个已经在我们的高级货币强度28和高级货币冲动指标中使用的成熟的加分项。 在交易时,总是将弱势货币和强势货币配对,这个新指标将帮助你做到这一点。 用户手册:点击这里  https://www.mql5.com/en/blogs/post/708783 特点  显示每个时间段的ACS28和GAP-speed(冲动)的货币强度值。 列:颜色代码以7种颜色
    Enigmera
    Ivan Stefanov
    5 (3)
    ENIGMERA:市场核心 https://www.enigmera.com 简介 该指标和交易系统是金融市场的一种非凡方法。ENIGMERA 利用分形周期精确计算支撑位和阻力位。它能显示真实的累积阶段,并给出方向和目标。 该系统无论在趋势中还是在修正中都能发挥作用。 它是如何运行的? ENIGMERA 由三条线组成:支撑/阻力线、目标线和偏离线。与一般市场指标将过去的数据推断为现在和未来的情况不同,该系统能提供当前的完整情况。如果你处于支撑位,这意味着真正的支撑;如果你处于阻力位,这意味着真正的阻力。如果突破某一水平,则表示趋势发生变化。没有重绘。 由于市场在不断变化,ENIGMERA 不断调整其评估工具,定期修改策略。  这保证了每种情况都能得到全面评估。这一市场指标的独特性显而易见,其能力不言而喻。  ENIGMERA 为金融分析师和咨询师提供服务,他们需要可靠的见解与客户分享,也为投资者提供服务,他们需要最精确和最可靠的保证。 该系统能够达到最佳精度,使交易者能够自信、清晰地评估他们的选择。 ENIGMERA 将 20 年的交易专长和知识整合到一个综合软件
    TPSproTREND PrO
    Roman Podpora
    4.79 (19)
    TPSpro TREND PRO 是一个趋势指标,可以自动分析市场并提供有关趋势及其每次变化的信息,并给出进入交易的信号而无需重新绘制! 该指标使用每根蜡烛,分别对其进行分析。指不同的脉冲——向上或向下脉冲。货币、加密货币、金属、股票、指数交易的准确切入点! MT5版本                 指标的完整描述   我们建议将其与 指示器 -   RFI LEVELS 一起使用 主要功能: 准确的输入信号,无需渲染! 如果出现信号,它仍然相关!这是与重提指标的一个重要区别,重提指标可以提供信号然后改变信号,这可能导致存款资金的损失。现在您可以以更高的概率和准确度进入市场。还有一个功能是在箭头出现后为蜡烛着色,直到达到目标(止盈)或出现反转信号。 显示止损/获利区域 为了提高搜索切入点时的视觉清晰度,创建了一个模块,该模块最初显示买入/卖出区域,在该区域中搜索进入市场的最佳点。用于处理止损水平的附加智能逻辑有助于随着时间的推移减小其大小,从而降低进入交易(移动 sl)时的初始风险。 显示较高时间范围内的最小值/最大值(MTF 模式) 添加了一项功能,可以显示较高时间间隔的最小
    Dynamic Forex28 Navigator - 下一代外汇交易工具。 当前 49% 折扣。 Dynamic Forex28 Navigator 是我们长期流行的指标的演变,将三种功能合二为一: 高级货币强度 28 指标 (695 条评论)+ 高级货币 IMPULSE 带警报 (520 条评论)+ CS28 组合信号(奖励)。 有关指标的详细信息 https://www.mql5.com/en/blogs/post/758844 下一代强度指标提供什么? 您喜欢的原始指标的一切,现在通过新功能和更高的精度进行了增强。 主要特点: 专有货币强度公式。  所有时间范围内的平滑和准确的强度线。 非常适合识别趋势和精确进入。 动态市场斐波那契水平(市场斐波那契)。  此指标独有的独特功能。 斐波那契应用于货币强度,而不是价格图表。 适应实时市场活动以获得准确的反转区域。 实时市场动量。  第 9 行显示市场是活跃还是被动。 对于定时交易至关重要。 全面的警报和显示。  每种货币最强的买入和卖出动量。 ​​28 对的双重动量买入和卖出。 超买/超卖警告外部范围
    FX Volume
    Daniel Stein
    4.58 (33)
    通过 mql5 和 Telegram 上 的 " 晨间简报 "获取每日市场更新,包括详细信息和屏幕截图 ! 外汇交易量(FX Volume)是第一个也是唯一一个从经纪商角度真正洞察市场情绪的交易量指标。 直接在您的图表上看到这些信息是真正改变游戏规则和突破性的交易解决方案。 受益于独特的市场数据洞察,如 比率(Ratios )显示货币多头和空头头寸的比率(百分比 比率变化 显示所选时间段内的多头比率及其百分比变化 总交易量 显示货币的总交易量(多头和空头),以手为单位 多头 交易量显示货币所有多头头寸的交易量 空头 交易量显示所有货币空头头寸的交易量 净多头 显示净多头交易量,即所有多头头寸减去所有空头头寸(以手为单位)。 净多头百分比 显示货币净多头交易量的变化 请阅读我们的基本教程 -> "如何使用外汇交易量进行交易 " 获取更多信息,如常见问题、交易技巧和教程视频,请访问我们的 外汇交易量公共信息频道 请 安装并运行 SI Connect 以建立与我们数据中心的持续连接 背景信息 我们都知道,外汇是一个分散的市场。这就是为什么我们必须打破常规思维,开发一个独
    TPSpro RFI Levels
    Roman Podpora
    4.82 (22)
    指示       俄罗斯 -        英语   建议 与指示器一起使用     -       TPSpro 趋势专业版 -   MT4版本       交易中的一个关键要素是做出买卖交易工具决定的区域或水平。尽管主要参与者试图隐藏他们在市场中的存在,但他们不可避免地会留下痕迹。我们的任务是学习如何识别这些痕迹并正确解释它们。 主要功能: 向卖家和买家显示活跃区域! 该指标显示所有正确的初始买入和卖出脉冲水平/区域。激活这些水平/区域后,开始寻找切入点,水平会改变颜色并填充特定阴影。此外,还会显示箭头,以便更直观地了解情况。 显示更高时间范围内的级别/区域(MTF 模式) 添加了使用更高时间间隔显示级别/区域的功能。此外,该指标还具有自动趋势检测功能(   TPSproTREND PRO   )。 用于交易的单独专业的逐步算法。 该算法专为日内交易而设计,既可顺势交易,也可逆势交易。每个活动模板均提供详细说明。 适用于多种时间范围 。 TPSpro RFI 水平指标可用于图表上的任何时间范围,从一分钟(M1)开始一直到每月(MN)。 图形和声音警报。 该指标提供图形和声音指示
    FX Power MT4 NG
    Daniel Stein
    5 (13)
    通过 mql5 和 Telegram 上 的晨间简报获取每日市场更新,包括详细信息和屏幕截图 ! FX Power MT4 NG 是我们长期以来非常受欢迎的货币强度计算器 FX Power 的下一代产品。 这款下一代强度计算器能提供什么?您所喜爱的原版 FX Power 的所有功能 附加功能 黄金/XAU 强度分析 更精确的计算结果 可单独配置的分析周期 可自定义计算限制,以获得更好的性能 为希望查看更多信息的用户提供特殊的多实例设置 无尽的图形设置,可在每个图表中设置您最喜欢的颜色 无数的通知选项,让您再也不会错过任何重要信息 采用 Windows 11 和 macOS 风格的全新圆角设计 神奇的移动指标面板 FX Power 主要功能 所有主要货币的完整强势历史 所有时间框架内的货币强弱历史 所有经纪商和图表的计算结果完全相同 100% 可靠的实时计算 -> 无重绘 可通过下拉列表选择分析时段 通过自定义模式单独配置分析时段 可在一个图表中使用多个实例 可移动 FX Power 显示屏(通过拖放) 适用于高分辨率 QHD、UHD 和 4K 显示器 自动终端配置 针对平板电脑
    MetaTrader 4 的 Ultimate Gold Advisor Ultimate Gold Advisor 是一个先进的技术工具,旨在优化 MetaTrader 4 上的交易体验。为了满足经验丰富的交易者的需求,该指标结合了精准度、复杂的分析和多功能性,为做出明智的交易决策提供支持。它不仅适用于黄金交易,还可用于广泛的资产类别,Ultimate Gold Advisor 能帮助你提升市场策略。 Ultimate Gold Advisor 为什么是交易者的好工具? 先进的性能: 结合多个指标,清晰显示每笔交易的结果,你可以透明地查看策略的表现。这让你能够优化你的方法,做出更明智的决策。 即时和可视的交易信号: 图表上的红色和蓝色箭头标记了潜在的买入和卖出机会。 这些视觉信号易于理解,能快速帮助你识别关键行动时刻。 实时点差追踪: Ultimate Gold Advisor 以点数(pips)测量价格变动,让你能够实时评估市场变化。这有助于你更准确地计划交易,并跟踪策略的进展。 趋势检测技术: 指标通过图表上的虚线跟踪主要市场趋势。 这使你能更好地理解市场波动和方向变化,基于市场
    M1 Gold
    Abdulkarim Karazon
    Gold Channel XAUUSD
    Paulo Rocha
    5 (2)
    Gold Channel is a volatility-based indicator, developed with a specific timing algorithm for the XAUUSD pair, which consists of finding possible corrections in the market. This indicator shows two outer lines, an inner line (retracement line) and an arrow sign, where the theory of the channel is to help identify overbought and oversold conditions in the market. The market price will generally fall between the boundaries of the channel. If prices touch or move outside the channel it is a tra
    GOLD Impulse with Alert
    Bernhard Schweigert
    4.56 (9)
    这个指标是我们2个产品 Advanced Currency IMPULSE with ALERT  +   Currency Strength Exotics 的一个超级组合。 它适用于所有时间框架,并以图形方式显示8种主要货币和一种符号的强势或弱势冲动! 该指标专门用于显示任何符号的货币强度加速,如黄金、异国货币对、商品、指数或期货。这是它的第一个指标,任何符号都可以被添加到第9行,以显示黄金、白银、石油、DAX、US30、MXN、TRY、CNH等的真实货币强度加速(冲动或速度)。 建立在新的基础算法上,它使识别和确认潜在的交易更加容易。这是因为它以图形方式显示了一种货币的强势或弱势是否正在加速,并测量了这种加速的速度--把它想象成你汽车中的速度表。当你加速时,事情显然会发生得更快,这在外汇市场上也是一样的,即如果你配对的货币正在向相反的方向加速,你就会发现一个潜在的有利可图的交易。 动态市场斐波那契28水平被用作警报触发器,将适应市场活动。如果冲动击中黄色触发线,你将收到警报。然后你就知道作为一个交易员应该做什么。货币对和方向已经给出。只需点击警报按钮,就可以
    Advanced Currency IMPULSE with ALERT
    Bernhard Schweigert
    4.9 (481)
    目前31%的折扣!! 对任何新手或专家交易者来说都是最好的解决方案! 这个指标是一个独特的、高质量的、负担得起的交易工具,因为我们已经纳入了一些专有的功能和一个秘密的公式。只需一张图表,它就能给出所有28种货币对的警报。想象一下,你的交易将如何改善,因为你能够准确地确定新趋势或剥头皮机会的触发点 建立在新的基础算法上,它使识别和确认潜在交易变得更加容易。这是因为它以图形方式显示了一种货币的强势或弱势是否正在加速,并测量了这种加速的速度--把它想象成你汽车中的速度表。当你加速时,事情显然会发生得更快,这在外汇市场上也是一样的,即如果你配对的货币正在向相反的方向加速,你就会发现一个潜在的有利可图的交易。 货币动量的垂直线和箭头将指导你的交易! 动态的市场斐波那契23水平被用作警报触发器,将适应市场活动。如果冲动触及黄色触发线,您将在MetaTrader或您的电子邮件或推送警报中收到警报。然后你就知道作为一个交易员应该做什么。货币对和方向已经给出。只要点击警报按钮,就可以切换到该货币对或打开一个新的图表,以便进一步分析。警报级别可以通过用户输入来改变,可以选择3个敏感度级别
    Blahtech Supply Demand
    Blahtech Limited
    4.61 (33)
    Was: $299  Now: $99   Supply Demand uses previous price action to identify potential imbalances between buyers and sellers. The key is to identify the better odds zones, not just the untouched ones. Blahtech Supply Demand indicator delivers functionality previously unavailable on any trading platform. This 4-in-1 indicator not only highlights the higher probability zones using a multi-criteria strength engine, but also combines it with multi-timeframe trend analysis, previously confirmed swings
    AW Prime Oscillator
    AW Trading Software Limited
    5 (1)
    两个振荡器的组合。第一个显示入场点,第二个显示当前趋势。该指标可以通过两种模式的箭头显示振荡信号,所有快速振荡信号或仅在当前趋势方向的信号。它具有多时间范围面板和三种类型的信号通知。 好处: 适合当日交易和倒卖交易 趋势过滤 简单而灵敏的设置 多时间框架面板 适合融入顾问。 适用于任何交易品种和任何时间范围 三种类型的通知 MT5 version ->  HERE  / Problem solving ->  HERE 指标策略 该指标由两个不同的振荡器组成: 慢趋势线(粗) - 当指标的最高水平从上到下交叉时,它是下降趋势的指标,当较低的水平水平(指标的低水平)从下到上交叉时,它是下降趋势的指标上升趋势。此外,在较低区域找到一条慢线表明当前趋势是下降趋势,反之亦然,在上方区域找到一条慢线表明当前趋势是上升趋势。这就是该指标确定当前市场趋势的方式。 快速入场线(细):识别从下到上与下线相交处的入场点,这是买入信号,在从上到下穿越上线时,这是卖出信号。除了振荡线之外,调整指标线也很重要,因为这会影响信号的数量和准确性。 本产品使用不同的振荡器来显示慢线和快线,每个振荡器必须单独调整。
    Advanced Currency Strength28 Indicator
    Bernhard Schweigert
    4.9 (650)
    目前26%的折扣 任何新手或专家交易者的最佳解决方案! 这个指标是一个独特的、高质量的、可负担得起的交易工具,因为我们纳入了一些专有的功能和一个新的公式。只需一个图表,你就可以读出28个外汇对的货币强度!想象一下,你的交易将如何得到改善,因为你的交易是在你的手中进行的。想象一下,你的交易将如何改善,因为你能够准确地确定新趋势或剥头皮机会的触发点? 用户手册:点击这里  https://www.mql5.com/en/blogs/post/697384 这是第一本,原版的! 不要买一个毫无价值的崇拜者的克隆品。 特别的 子窗口中的箭头显示强劲的货币势头GAP将指导你的交易! 当基础货币或报价货币处于超卖/超买区域(外盘斐波那契水平)时,在个人图表的主窗口中出现警告信号。 当货币力量从外围区间回落时,回撤/反转警报。 十字星模式的特别警报 可选择多个时间框架,以快速查看趋势! 货币强度线在所有的时间框架中都非常平稳,当使用较高的时间框架来识别总体趋势,然后使用较短的时间框架来确定精确的入口时,效果非常好。你可以根据自己的意愿选择任何时间框架。每个时间框架都由其自身进
    Black dragon indicator
    Ramil Minniakhmetov
    4.85 (110)
    趋势检测指标将补充任何策略,也可用作独立工具。 使用该指标的建议,您可以在评论 #8 中下载 好处 易于使用,不会因不必要的信息而使图表过载; 可用作任何策略的过滤器; 具有内置的动态支撑和阻力水平,可用于获利和设置止损; 指标在烛台关闭后不会改变颜色;  适用于股票市场、指数、石油、黄金和所有时间范围; 具有吐司通知、邮件通知、推送通知和声音提醒功能。 我的其他开发可以在这里找到: https://www.mql5.com/zh/users/mechanic/seller 输入参数 Alert - 开/关。警报; Push Notification - 开/关。推送通知; Mail - 开/关电子邮件通知; Fibo 1,2,3,4,5,6,7,11,21,31,41,51,61,71 - 动态支撑和阻力位的设置。
    Automated Trendlines
    Georgios Kalomoiropoulos
    5 (16)
    趋势线是外汇交易中最重要的技术分析工具。不幸的是,大多数交易者没有正确绘制它们。自动趋势线指标是专业交易者的专业工具,可帮助您可视化市场的趋势运动。 有两种类型的趋势线看涨趋势线和看跌趋势线。 在上升趋势中,外汇趋势线是通过价格变动的最低摆动点绘制的。 连接至少两个“最低点”将创建一条趋势线。 在下跌趋势中,趋势线是通过价格走势的最高摆动点绘制的。 连接至少两个“最高点”将创建一条趋势线。 趋势线何时突破? 当看跌蜡烛收于看涨​​趋势线下方并且蜡烛的高点在趋势线上方时,看涨趋势线会被打破。 当看涨蜡烛收于看跌趋势线上方并且蜡烛的低点低于趋势线时,看跌趋势线会被打破。 趋势线何时删除? 当一根完整的蜡烛在看涨趋势线下方形成时,看涨趋势线将被删除。 当完整的蜡烛在看跌趋势线上方形成时,看跌趋势线将被删除。 您可以从输入参数更改看涨和看跌趋势线的颜色和宽度。
    Best Currency Strength Indicator
    Tumelo Patrick Rakotsoane
    4.59 (46)
    Advanced Currency Strength Indicator The Advanced Divergence Currency Strength Indicator. Not only it breaks down all 28 forex currency pairs and calculates the strength of individual currencies across all timeframes , but, You'll be analyzing the WHOLE forex market in 1 window (In just 1 minute) . This indicator is very powerful because it reveals the true movements of the market.  It is highly recommended to  analyze charts knowing the performance of individual currencies or the countries ec
    Allows multiple indicators to be combined into a single indicator, both visually and in terms of an alert. Indicators can include standard indicators, e.g. RSI, CCI, etc., and also Custom Indicators, even those purchased through Market, or where just have the ex4 file. An early alert is provided, say when 4 out 5 indicators have lined up, and a confirmed alert when all are in agreement. A‌lso features a statistics panel reporting the success of the combined indicator by examining the current cha
    TrendfollowerSR
    Paul Reymkhe
    4.88 (90)
    Take Your Trading Experience To the Next Level ! and get the exclusive TFSR-Analyzer for free !    So you have all these outstanding features  on up to 20 symbols and all timeframes in a smart and clear Design. Correct identification of the trends  in stock investments are pivotal and TrendFollowerSR ensures this perspective while displaying the correct trend on multiply timeframes to help you go long way as much as possible. The latest technology of the Indicator enables to track whether if
    Shepherd Harmonic Pattern
    Abdullah Alrai
    4.65 (49)
    这个指标将检测手动和自动方法在图表上绘制的谐波模式。 您可以从此链接查看用户手册: 添加您的评论并联系我们以获得它 有一个免费版本可以在mt4上尝试此产品。 您可以使用它来检测Gartley和Nenstar模式: https://www.mql5.com/en/market/product/30181 您可以从以下链接购买完整的MT4版本: https://www.mql5.com/en/market/product/15212 注意 指标具有控制面板,并将保存每个(图表和时间框架)设置。 您可以将其最小化以在图表上获得更多空间,并且如果您更喜欢使用其他分析工具,则可以按关闭按钮隐藏所有指标数据 当您使用此指标并更改设置,添加诸如移动平均线或布林带之类的指标时,此指标将自动保存您的模板编辑,并且您可以随时加载它们。 如果您使用的是Windows 10,请右键单击MetaTrader图标>兼容性>更改高DPI设置>系统(增强)以获得最佳屏幕设置(应在高清设备中完成)。 指标只是谐波交易理论的解释,用于检测图表上的谐波模式。 如果您想学习它,可以搜索Scott Carney的书,名为“Ha
    MetaBands M4
    Vahidreza Heidar Gholami
    5 (2)
    MetaBands使用强大且独特的算法绘制通道并检测趋势,以便为交易者提供进出交易的潜在点。它是一个通道指标和强大的趋势指标。它包括不同类型的通道,可以通过使用输入参数简单地合并以创建新通道。MetaBands使用所有类型的警报通知用户市场事件。 功能 支持大多数通道算法 强大的趋势检测算法 能够合并不同类型的通道 多时间帧和多货币(信号矩阵) 所有类型的警报功能(声音、屏幕闪烁、推送通知、电子邮件、弹出窗口、箭头) 它永远不会重绘 趋势检测 MetaBands使用在通道内振荡的蓝色线来检测趋势。当该线遇到通道的上界时,表明开始下跌趋势,当它遇到下界时,表明开始上涨趋势。如果蓝线接近中线,则市场处于整理期。 该指标使用独特的方法来检测趋势。一开始可能看起来有些复杂,但如果您观看视频教程,您就会意识到它是多么强大且易于使用。 入场和出场信号 当趋势变化或价格穿过上下通道时,MetaBands会立即通过不同的方法提醒交易者,这些方法可以在指标设置中启用。 信号矩阵 要监视来自不同时间框架的多个符号并在一个地方查看信号,请单击右上角按钮或按键盘上的M键以打开信号矩阵。该矩阵可以
    TakePropips Donchian Trend Pro
    Eric John Pajarillaga Aldana
    4.44 (16)
    TakePropips Donchian Trend Pro   (MT4) 是一款功能强大且有效的工具,可使用 Donchian 通道自动检测趋势方向,并为您提供进场和退场交易信号! 这个多功能指标包括趋势扫描器、交易信号、统计面板、筛选器、交易时段和警报历史仪表板。它旨在为您提供交易信号并节省您分析图表的时间! 您可以在我们的博文中下载用户手册和安装指南:   https   :// www.mql5.com/en/blogs/post/751368 今天立减 50%!价格从 98 美元降到 49 美元! 您可以在 Strategy Tester 上测试该指标(启用可视模式) 视频教程也可在说明下方获得更多详细信息。 如果您有任何问题或需要任何帮助,请与我联系。 TakePropips Donchian Trend Pro 指标适用于所有外汇对、金属、商品、指数和加密货币。 主要特点 交易信号 - 检测多个时间范围内所有货币对的买卖机会。它将为您提供警报并在图表上绘制交易信号,最多 3 个止盈价和一个止损价。 Trend Scanner   - 用于快速扫描和识别跨多个时间
    Royal Scalping Indicator M4
    Vahidreza Heidar Gholami
    4.17 (6)
    Royal Scalping Indicator is an advanced price adaptive indicator designed to generate high-quality trading signals. Built-in multi-timeframe and multi-currency capabilities make it even more powerful to have configurations based on different symbols and timeframes. This indicator is perfect for scalp trades as well as swing trades. Royal Scalping is not just an indicator, but a trading strategy itself. Features Price Adaptive Trend Detector Algorithm Multi-Timeframe and Multi-Currency Trend Low
    Currency Strength Exotics
    Bernhard Schweigert
    4.87 (30)
    目前8折优惠! 对任何新手或专家交易者来说都是最好的解决方案! 这个指标是专门用来显示任何符号的货币强度,如异国货币对、商品、指数或期货。它是同类产品中的第一个,任何符号都可以添加到第9行,以显示黄金、白银、石油、DAX、US30、MXN、TRY、CNH等的真实货币强度。这是一个独特的、高质量的、负担得起的交易工具,因为我们已经纳入了一些专有的功能和一个新的公式。想象一下,你的交易将如何改善,因为你能够准确地确定新趋势或剥头皮机会的触发点? 用户手册:点击这里   https://www.mql5.com/en/blogs/post/708876 它适用于所有时间框架。你将很快能够看到TREND! 根据新的基础算法设计,它使识别和确认潜在交易变得更加容易。这是因为它以图形方式显示了8种主要货币和一种符号的强弱。 该指标显示了8种主要货币(澳元加元瑞士法郎欧元英镑日元新西兰美元)的强弱线,再加上一个符号! 该指标显示了符号的真实价值。例如:对于XAUUSD(黄金):价格以美元报价。如果黄金在上涨,你怎么能知道是黄金的强势还是美元的弱势?只有当黄金走强时,我们才会进行
    Harmonic Papallons
    Ramon Sobrevals Arce
    3.33 (3)
    Automatically scans the chart to find Harmonic Patterns, and give you the chance to enter early in good operations. Also if selected, it will alert you in advance when future patterns appears, showing you a projection of a posible future pattern. The main goal  for this algorithm is to determine with high precision the moment when a trend ends and a new one begins. Giving  you the best price within a reversal.   We have added the "Golden Trade", we define it as the perfect order: For those orde
    All in One Trade
    Alexey Minkov
    4.48 (27)
    The All-in-One Trade Indicator (AOTI) determines daily targets for EURUSD, EURJPY, GBPUSD, USDCHF, EURGBP, EURCAD, EURAUD, AUDJPY, GBPAUD, GBPCAD, GBPCHF, GBPJPY, AUDUSD, and USDJPY. All other modules work with any trading instruments. The indicator includes various features, such as Double Channel trend direction, Price channel, MA Bands, Fibo levels, Climax Bar detection, and others. The AOTI indicator is based on several trading strategies, and created to simplify market analysis. All-in-One
    MetaTrend M4
    Vahidreza Heidar Gholami
    Meta Trend Indicator is an efficient way to forecast and detect the trend in any market. It reveals the trend, support and resistance levels, volatility and the maximum potential target, all in one indicator. To adapt to the price and to decrease consecutive trend failures, the internal trend detector algorithm studies the market and dynamically chooses the right values for the internal parameters. This indicator is a perfect trend filter for any strategy or expert advisor. Features Super Adapti
    TrendMaestro
    Stefano Frisetti
    5 (3)
    note: this indicator is for METATRADER4, if you want the version for METATRADER5 this is the link:  https://www.mql5.com/it/market/product/108106 TRENDMAESTRO ver 2.4 TRENDMAESTRO recognizes a new TREND in the bud, he never makes mistakes. The certainty of identifying a new TREND is priceless. DESCRIPTION TRENDMAESTRO identifies a new TREND in the bud, this indicator examines the volatility, volumes and momentum to identify the moment in which there is an explosion of one or more of these data a
    作者的更多信息
    True Oversold Overbought MT5
    Innovicient Limited
    5 (1)
    The True Oversold Overbought indicator provides you with ability to swiftly check whether the asset is oversold or overbought.  Other than complementing your trading with True Oversold Overbought, you can use the indicator as your only trading system. It works with all forex instruments and will save you the headache of estimating when the market is due for a reversal or retracement.  When the "Super Charge" feature is enabled, the areas where the price is in oversold/overbought status are ampli
    Price Elevator MT4
    Innovicient Limited
    The Price Elevator indicator is developed to help you figure out the general long-term trend of the market. If the price is above the Green separator line, this is a clear indication the bulls are in control. Similarly, the bears are in control if the price continues to trend below the red separator line.   Download Price Elevator MT5   Trend Re-entry In this case you would plan your buy entries above the green dotted box (make sure to set the Buy / Sell Retracement Floor=30). The SL should be
    Ranging Market Detector
    Innovicient Limited
    5 (2)
    Ranging Market Detector scans the market for momentum and price to check whether the price is range- bound and the direction to which it will breakout.  It works with all the  all assets and visually shows you the instances when the market is either ranging or trending. Informs when the price has finished a retracement, an opportune time to re-enter the trend early. This will help you in position management.  It works very well for Scalping, Day trading, and Swing trading. Helpful in all timefra
    Trendy Stocks
    Innovicient Limited
    5 (2)
    Trendy Stock is a price following indicator that uses Stochastic to show when the price is out of the oversold or overbought areas.  The algorithm allows you to stay longer in a trend where the bulls or bears are in control. The indicator changes color immediately the price exits oversold/overbought state. In short, the downtrend [red] bars start to paint when the buying pressure decreases while the uptrend [green] bars form as the buy pressure kicks in.    For MT4 version, follow :: https://www
    FREE
    Outside The Box
    Innovicient Limited
    The Outside The Box (OTB) is a complete trading system that provides the user with immense trading ability by highlighting on the chart areas where the trader should prepare to Re-enter the trend after pullbacks (Pullback trading strategy) Take partial/complete profit(Profit taking strategy), and Trade breakouts (Stock breakout strategy) - We have updated the indicator to show/hide Micro breakout areas around the major breakouts (Micro Breakouts).  The above is supported by an alert system to no
    Trendy Stocks for MT4
    Innovicient Limited
    Trendy Stock is a price following indicator that uses Stochastic to show when the price is out of the oversold or overbought areas.  The algorithm allows you to stay longer in a trend where the bulls or bears are in control. The indicator changes color immediately the price exits oversold/overbought state. In short, the downtrend [red] bars start to paint when the buying pressure decreases while the uptrend [green] bars form as the buy pressure kicks in.  For MT5 version, follow ::     https://w
    FREE
    Chart Analyzer
    Innovicient Limited
    The Chart Analyzer is an MT4 indicator that provides visual arrow signals without redrawing them. In addition, we have included trendlines to validate your entries. This indicator has been fine-tuned to work with all timeframes and instruments.  The Chart Analyzer has a number of advantages Does not fade or remove arrows when drawn Sends both email and phone alerts. It is light on computer resources Easy to install. Default setting works just fine.  If price opens above the trendline, open
    Retracement Feeder
    Innovicient Limited
    5 (1)
    The Retracement Feeder checks for retracement opportunities after the first move has occurred.  Basically it scans for the second wave of trend. Works with any financial instrument,  It does not repaint/change color or cancel arrows, Easy to set and use. Works great with Renko Charts MT5 version:  https://www.mql5.com/en/market/product/71340 How it works The indicator is based on RSI and Stochastics.  The algorithm used in the Retracement Feeder allows the Stochastic and RSI to minimiz
    Introduction The Convergence Divergence Suite contains 17 indicators , built-in MT4 technical indicators and custom ones . The list will be increased in subsequent versions as per users' requests.  Any selected indicator is loaded on your chart then automatic Convergence and Divergence trend lines are drawn on the chart and indicator. This tool is important if you use any of the listed indicators or convergence/divergence in your strategy. Advantages With the Convergence Divergence Suite you
    Hot Zones
    Innovicient Limited
    This indicator simplifies your entry zones by displaying the areas where you can plan your entry that potentially could give you high risk/reward ratios. Other than picking the most optimal entry points, the Hot Zone indicator can act as your typical support/resistance indicator for pullbacks for all timeframes. You can use this indicator as the only trading indicator or use it with another indicator for reentry purposes.  Besides, when using Hot Zones, the risk/reward ratio should be well abov
    Outside The Box MT4
    Innovicient Limited
    5 (2)
    The   Outside The Box (OTB)   is a complete trading system that provides the user with immense trading ability by highlighting on the chart areas where the trader should prepare to Re-enter the trend after pullbacks (Pullback trading strategy) Take partial/complete profit(Profit taking strategy), and Trade breakouts (Stock breakout strategy) - We have updated the indicator to show/hide Micro breakout areas around the major breakouts (Micro Breakouts).  The above is supported by an alert system
    Trend Support Resistance is a fairly simple indicator that provides traders with confirmed immediate support and resistance in whatever timeframe you monitor. It's good for short-term and long-term order blocks. With the default settings, the indicator identifies critical support and resistance areas. Bearish Order Blocks are around the OrangeRed areas while Bullish Order Blocks almost always form near the LawnGreen areas. We have also added a Multi-timeframe feature that can be helpful to allow
    Essential Trader
    Innovicient Limited
    The Essential Trader indicator is more comfortable with whipsaw/ranging market conditions. It is not a complicated trading indicator and can be used on any timeframe with high level of confidence. Besides, it has notifications and alerts. The dotted essential points show spots where you can make immediate entries and benefit from breakout on either side of the region. On the other hand, the color filled points display reversal regions. These are important in that you can trade along the trend or
    Retracement Feeder MT5
    Innovicient Limited
    The Retracement Feeder  checks for retracement opportunities after the first move has occurred.  Basically it scans for the second wave of trend. Works with any financial instrument,  It does not repaint/change color or cancel arrows, Easy to set and use. Works great with Renko Charts MT4 version:  https://www.mql5.com/en/market/product/67443 How it works The indicator is based on RSI and Stochastics.  The algorithm used in the Retracement Feeder allows the Stochastic and RSI to minimize the t
    Hot Zones MT5
    Innovicient Limited
    This indicator simplifies your entry zones by displaying the areas where you can plan your entry that potentially could give you high risk/reward ratios. Other than picking the most optimal entry points, the Hot Zone indicator can act as your typical support/resistance indicator for pullbacks for all timeframes. You can use this indicator as the only trading indicator or use it with another indicator for reentry purposes.  Besides, when using Hot Zones, the risk/reward ratio should be well abov
    Trend Guard MT5
    Innovicient Limited
    Bollinger Band is one if the most useful indicators if used properly. Trend Guard used the parameters based on Bollinger to create a tool that can help traders enter trades at most optimal level. The indicator is useful to all traders since it checks for retracements and changing trend direction. With this indicator, you get the opportunity to open trades early and also lock your profits based on the dotted trend lines that form after a certain level of Bollinger band. We have simplified the ind
    Price Elevator
    Innovicient Limited
    The Price Elevator indicator is developed to help you figure out the general long-term trend of the market. If the price is above the Green separator line, this is a clear indication the bulls are in control. Similarly, the bears are in control if the price continues to trend below the red separator line.   Download Price Elevator MT4   Trend Re-entry In this case you would plan your buy entries above the green dotted box (make sure to set the Buy / Sell Retracement Floor=30). The SL should be
    Trend Support Resistance is a fairly simple indicator that provides traders with confirmed immediate support and resistance in whatever timeframe you monitor. It's good for short-term and long-term order blocks. With the default settings, the indicator identifies critical support and resistance areas. Bearish Order Blocks are around the OrangeRed areas while Bullish Order Blocks almost always form near the LawnGreen areas. We have also added a Multi-timeframe feature that can be helpful to allow
    Essential Trader MT5
    Innovicient Limited
    The Essential Trader indicator is more   comfortable with whipsaw/ranging market conditions. It is not a complicated trading indicator and can be used on any timeframe with high level of confidence. Besides, it has notifications and alerts. The dotted essential points show spots where you can make immediate entries and benefit from breakout on either side of the region. On the other hand, the color filled points display reversal regions. These are important in that you can trade along the trend
    筛选:
    无评论
    回复评论
    版本 1.12 2022.08.11
    typo correction
    版本 1.11 2022.07.29
    Added Alerts
    Added Triangle Reversal Zones
    版本 1.10 2022.03.25
    Added a tip in the #description.
    版本 1.9 2022.03.23
    Interface improvements
    版本 1.8 2022.02.18
    Bug removal
    版本 1.7 2022.02.08
    Here is the full list of updates:True Oversold Overbought

    1. This feature allows users who have the older version to keep using it or opt to use the updated version. This feature was added due to requests


    2. The update improves the functionality and operations of the new version.


    3. Thirdly, you can now add user defined levels for oversold and overbought levels. If you enable supercharge the system uses supercharge levels and not ordinary levels.


    4. Lastly, there is a feature to draw the Rectangles when indicator reaches overbought/oversold levels as per user input levels.


    Profitable trading to all.
    版本 1.6 2021.08.09
    1. Based on requests from users, we have removed the Convergence/Divergence lines sine they were obstructing operations of the indicator.
    2. Secondly, we have added MFI filters.

    RULE:
    🔺 When the "Super Charge" feature is enabled, the areas where the price is in oversold/overbought status are amplified to give you a clear state of the market,therefore, you will not miss the moment to prepare for a reversal/retracement (over 5000 is overbought and below -5000 is oversold ; buy when indicator closes above -5000 and sell when it closes below 5000).

    🔺 Alternatively, when the "Super Charge" feature is disabled, the indicator still shows the oversold and overbought levels but this time you get a broader view of the market (over 80 is overbought and below -80 is oversold; buy when indicator closes above -80 and sell when it closes below 80).
    版本 1.5 2021.06.30
    Removed a bug that was hiding some bearish divergence.
    版本 1.4 2021.06.28
    > Added Convergence/Divergence trendlines and arrows.
    > Added Screen Alerts
    版本 1.3 2021.06.18
    * IT'S BETTER. WE HAVE PROVIDED MORE ROOM FOR THE MARKET TO BREATH
    * REDUCED FALSE SIGNALS BY OVER 80%.
    * WE HAVE ALSO REMOVED SOME AREAS THAT SEEMED TO CONFUSE THE USER.