Smart Fractals Levels
- 指标
- Flavio Javier Jarabeck
- 版本: 1.0
- 激活: 20
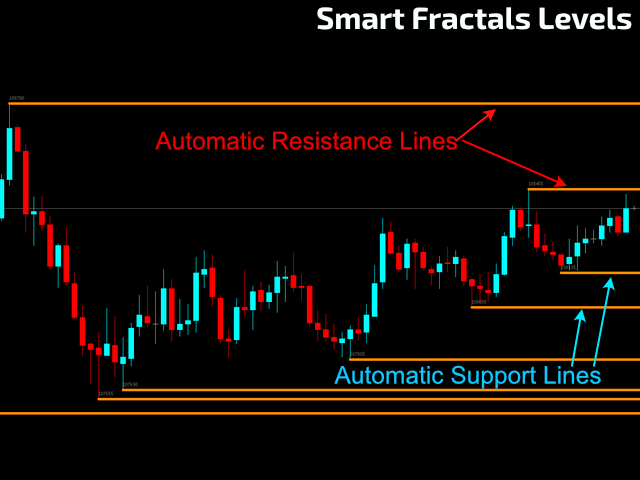
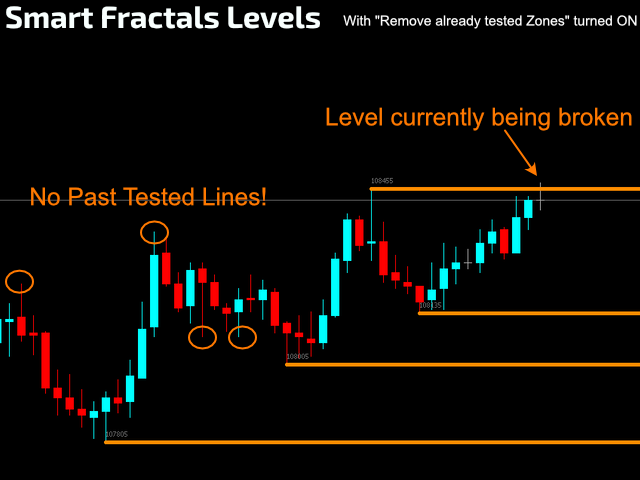
Support & Resistance taken to the next level. The Smart Fractals Levels indicator is based on Bill Williams' theory of identifying Support & Resistance levels through the use of the so-called "fractals". The difference between common Support and Resistance regions drawn on chart and the Smart Fractals Levels is that only NEW and untouched levels will still stay drawn on the chart (if you decide so), and also based on your own set of rules, totally configurable from the "settings" menu of the indicator.
HOW TO "READ" THIS INDICATOR
- If you know the concept of Support & Resistances you are ready to use this indicator.
- The only difference is that Smart Fractals Levels can filter out all those Support and Resistances already visited by the Price, with many options as you will see in the PARAMETERS section below. This way you can have a more accurate vision over the Price trail.
- You can also add 2 instances of the indicator on the same chart to "see" different analysis patterns.
- You can use as a Stop Loss tool in order to encounter logic regions to position your exit strategy in case of "things went bad..."
SETTINGS
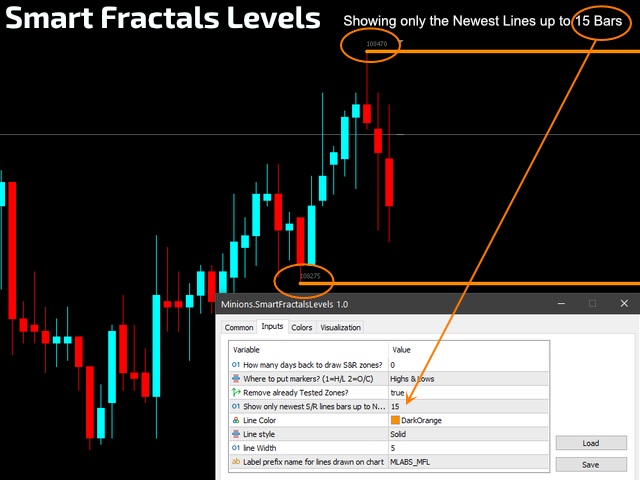
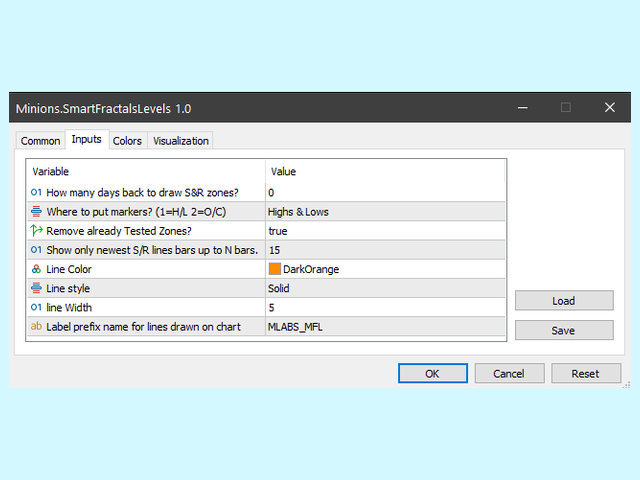
- How Many Days Back to Draw S&R Zones? - You decide how many days back to analyze and draw S&R lines.
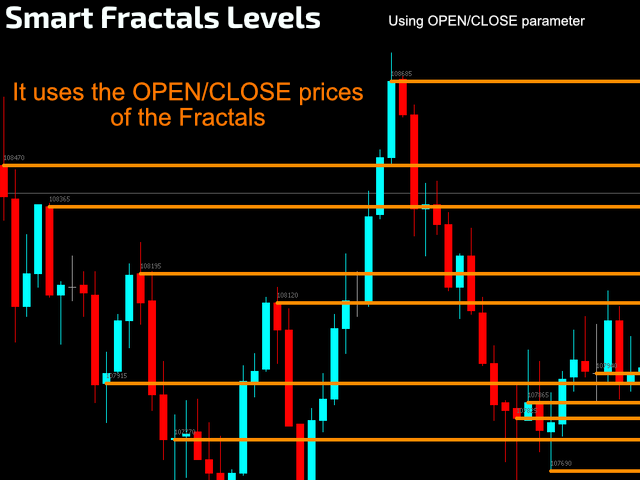
- Where to Put the Markers? - You choose wether to draw the lines on the Highs & Lows or, on the Open & Close of the candles.
- Remove Already Tested Zones? - Once the Price has "visited" this S&R line, it will be removed from your chart on the close of the current candle.
- Show Only the Newest S&R Lines up to N Bars - This mode allows you to catch for instance short breakout moves as known as Pullbacks.
- Line Color / Style / Width - You decide how your lines will look like.
- Label Prefix for the Lines - In case you are using 2 or more instances of this indicator on the same chart, to avoid conflict, just name them differently and everything is fine!
BUFFERS FOR YOUR EA
This indicator is EA Friendly, so please see below all the buffers available for you to use in your own EA:
- #2 - All available Support Lines - According to the indicator settings you chose. This buffer array will contain the PRICES as an indication of the active Support lines, otherwise the rest of the array will be filled with ZERO values.
- #3 - All available Resistance Lines - According to the indicator settings you chose. This buffer array will contain the PRICES as an indication of the active Resistance lines, otherwise the rest of the array will be filled with ZERO values.
- #4 - All available Support Lines as TIME value - Indicating when the were created. This array will have matching indexes according to the buffer #2, so you can easily match the time and price data between them.
- #5 - All available Resistance Lines as TIME value - Indicating when the were created. This array will have matching indexes according to the buffer #3, so you can easily match the time and price data between them.
- Please note that Buffers #4 and #5 are of the data type DOUBLE. Use the proper functions or Type Casting to convert back to a Datetime data type.
If you want to try this indicator on a Live or Demo account for FREE, see the instructions on our Blog: https://www.mql5.com/pt/blogs/post/747042 |
|---|
Didn't Find a Feature You Need?
No product is perfect for everyone. If you think you need a missing feature from our product just send us a message. We love feedback!
About Us
Flavio Jarabeck is the owner of MinionsLabs.com, an entrepreneurship focused on leveraging the knowledge and experience of professional traders through automated trading robots, freeing them to seek new opportunities and strategies in new markets and assets.
;)
