Donchian Pro
- 指标
- Paulo Henrique Faquineli Garcia
- 版本: 1.1
The Donchian Channel
Channels are among the most popular tools of technical analysis, as they visually convey to the analyst the limits within which most price movement tends to occur. Channel users know that valuable information can be obtained at any time, whether prices are in the central region of a band or close to one of the border lines.
One of the best known techniques to explore these concepts is Bollinger Bands. However, John Bollinger was not the only one to research the application of channels in market analysis. Before him, a successful American fund manager and trader named Richard Donchian had already brought his contributions to the world.
Donchian, a graduate economist at the prestigious Yale, worked in the family business until he had access to a copy of the biography of famed trader Jesse Livermore. Completely fascinated by the financial market and its endless possibilities, Donchian began to devote himself exclusively to researching price patterns and developing techniques that would help him in his career as a futures trader. Many of his deals over the years have been based on the method called the Donchian channel.
The concept
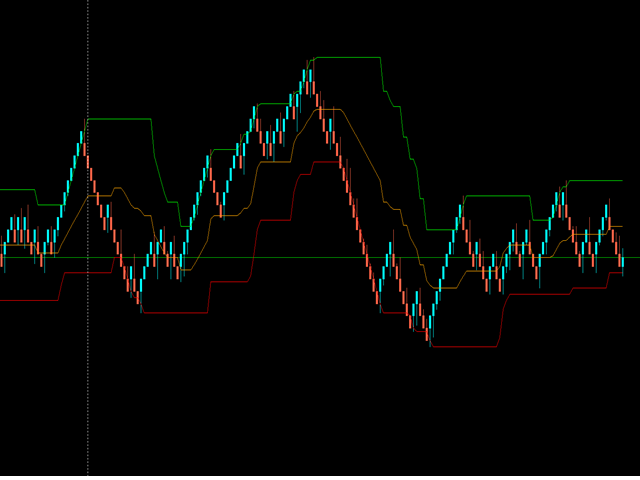
The Donchian channel is a trend-following indicator based on volatility, consisting of three elements:
• Lower band: delimited by the minimum of the last N periods.
• Upper band: delimited by the maximum of the last N periods.
• Centerline: it is not a moving average as in other techniques, but the center point between the lower and upper bands.
Analyzing the method components, we can identify some interesting features. The main one: there are no averages in the calculation, so bands tend to react quickly to market changes. When working with averages, even weighted and exponentials, there is an attenuation of the impact of each data on the overall calculation. With the Donchian channel, an aggressive price movement will trigger an equally aggressive reaction from the indicator.
Using the Donchian channel
The essence of applying the method lies in the fact that a break in the upper or lower band sets up a relevant action (and often of great strength) towards new highs or lows. In other words, in addition to monitoring volatility and following trends, the use of the indicator uses the idea of breakouts to build operations. The main rules of use can be described as follows:
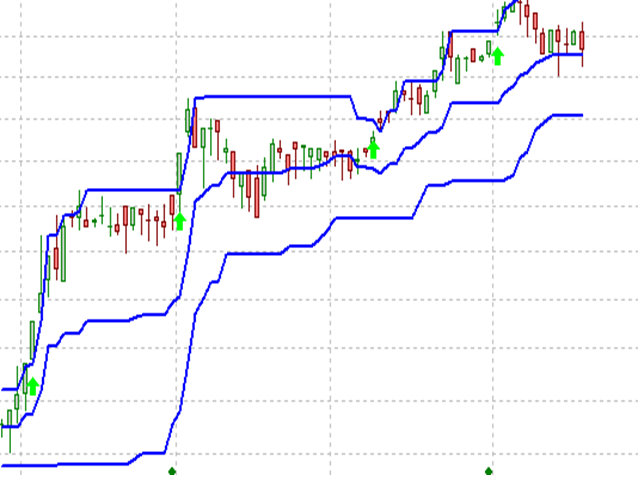
• When prices close above the upper line, you get a buy signal.
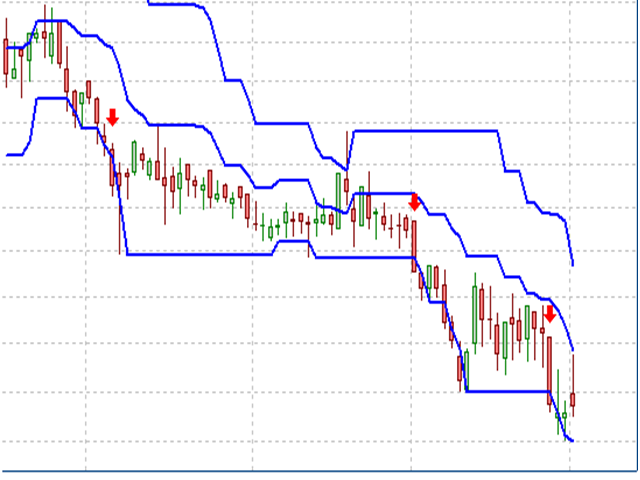
• When prices close below the bottom line, you get a sell signal.
These events are seen as events that indicate continuation and even acceleration of the trend. Note that the technique describes market entry signals, for exit and risk management other analytical resources must be used.
The graph in Figure 1 presents an example of the application of Donchian rules. Red arrows signal closes below the channel's lower boundary, generating sell signals and allowing the analyst to take advantage of the downtrend. Of course, the same reasoning holds true for a bullish moment (figure 2) with the green arrows marking the upper-bound breakouts.
Final considerations
As mentioned, the Donchian channel is a trend following indicator, meaning a drop in yield is expected in times of lateral congestion market. The indicator's time parameter indicates how many backward periods it will monitor, with 20 being the typical number. Many traders, however, trade at lower values, seeking an even faster technical reaction to price action, especially for day-trading.
It is also important to remember that the rules of use were designed with market entry in mind, either by the buyer or seller. For exits, as well as for stop positioning and risk management, other complementary techniques must be used.
Great analytics and deals.


super