Candlestick Patterns Scanner
- 指标
- Mohamed Ahmed Sh Muhumed
- 版本: 1.0
- 激活: 5
Please leave 5 Stars to me
Candlestick Patterns Scanner is professional indicator that will assist and alert you to identify candlestick patterns on meta trader 4 charts whenever a pattern appears on the chart.
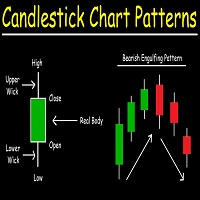
In financial technical analysis, a candlestick pattern is a movement in prices shown graphically on a candlestick chart that some believe can predict a particular market movement. The recognition of the pattern is subjective and programs that are used for charting have to rely on predefined rules to match the pattern/Candlesticks are graphical representations of price movements for a given period of time. They are commonly formed by the opening, high, low, and closing prices of a financial instrument.
If the opening price is above the closing price then a filled (normally red or black) candlestick is drawn.
If the closing price is above the opening price, then normally a green or hollow candlestick (white with black outline) is shown.
The filled or hollow portion of the candle is known as the body or real body, and can be long, normal, or short depending on its proportion to the lines above or below it.
The lines above and below, known as shadows, tails, or wicks, represent the high and low price ranges within a specified time period. However, not all candlesticks have shadows.
Candlestick Patterns Scanner contains many patterns some of the patterns that include are as follows.
BEARISH
- SHOOTING STAR
- EVINING STAR
- DARK CLOUD PATTER
- BEARISH ENGULFING PATTERN
- DOJI
BULLISH
- BULLISH HAMMER
- MORNING STAR
- MORNING STAR
- PERICING LINE PATTERN
- BULLISH ENGLUFING PATTER
- DOJI
you can turn and turn off any pattern you like from the input menu.
indicator works on all time frames.


用户没有留下任何评级信息