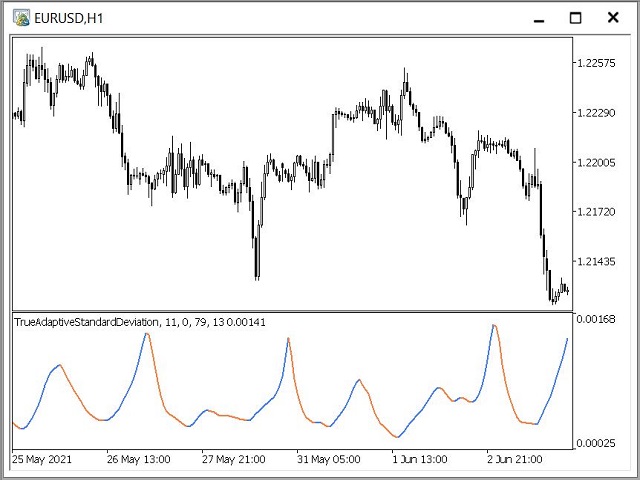
True Adaptive Standard Deviation Range
- 指标
- Igor Gerasimov
- 版本: 1.5
- 更新: 9 六月 2021
An improved version of the standard Standard Deviation indicator.
It is now a responsive and smoothed line.
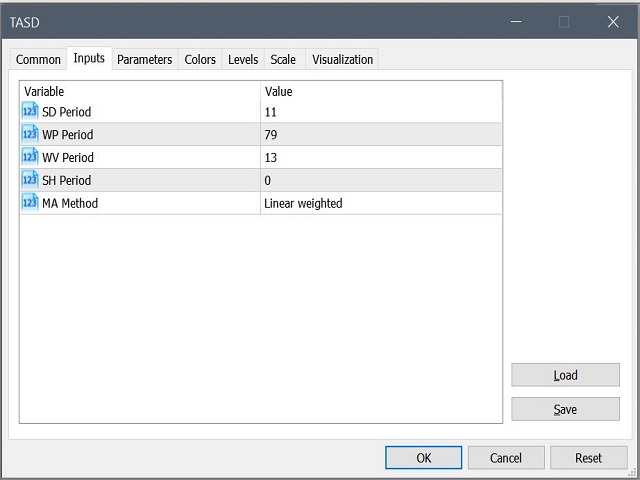
The setup is not straightforward - but I hope you can do it.
It is very easy to understand the readings of this indicator, the meaning is the same as that of the usual Standard Deviation.
//////////////////////////////////////////////// ///////////////////////////////////
I hope this indicator will be very useful to you in successful trading.
Good luck.