• 概述
  • 评论
  • 评论

Currency Charts

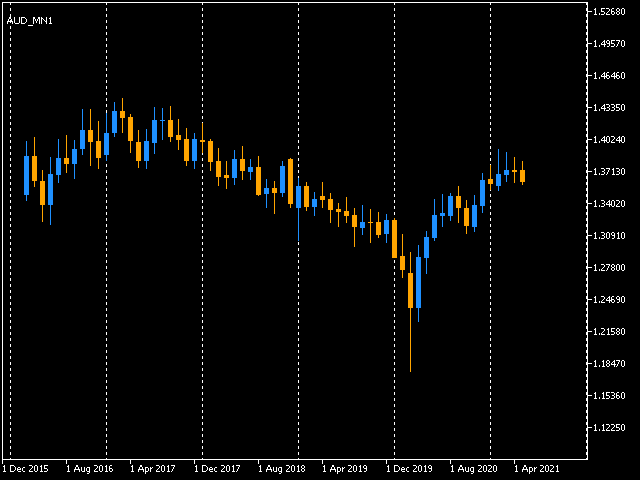
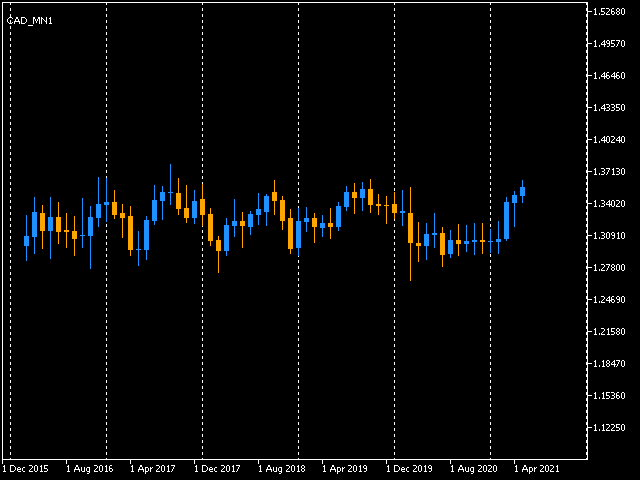
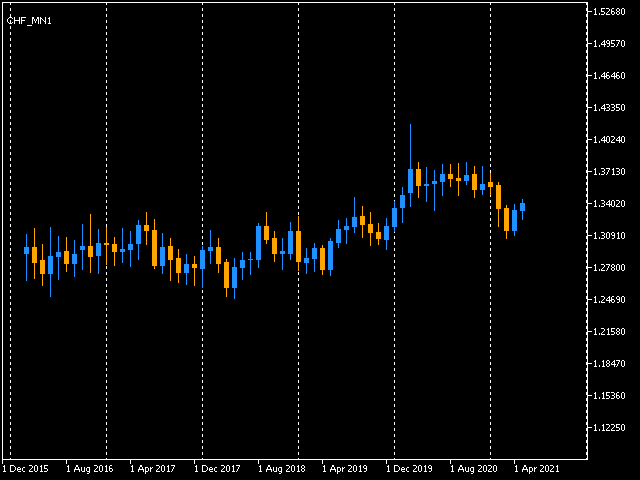
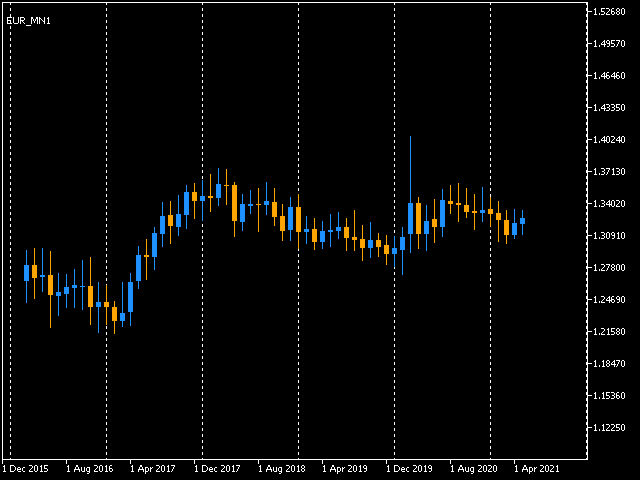
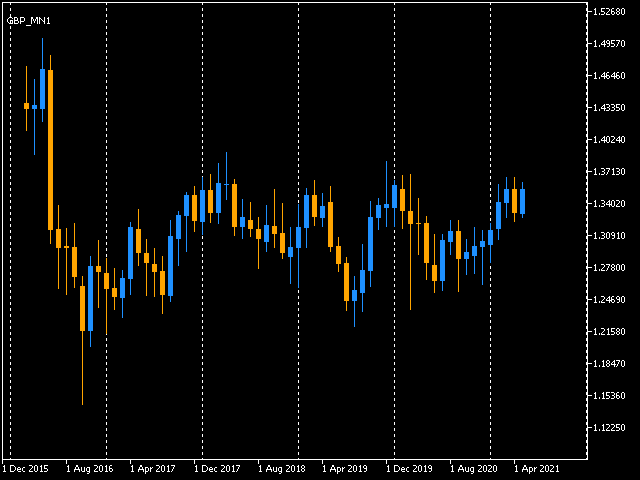
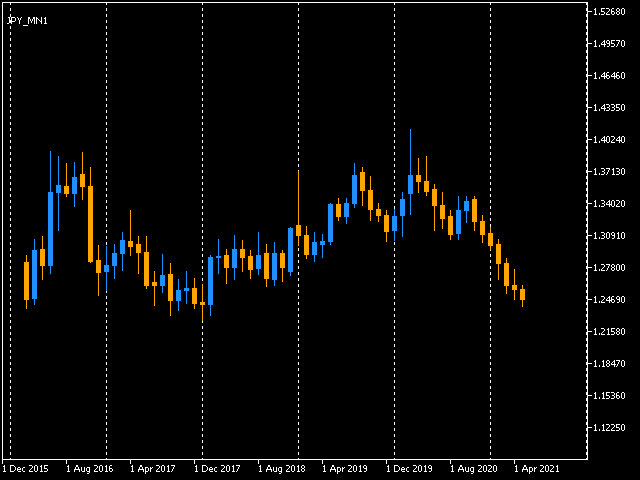
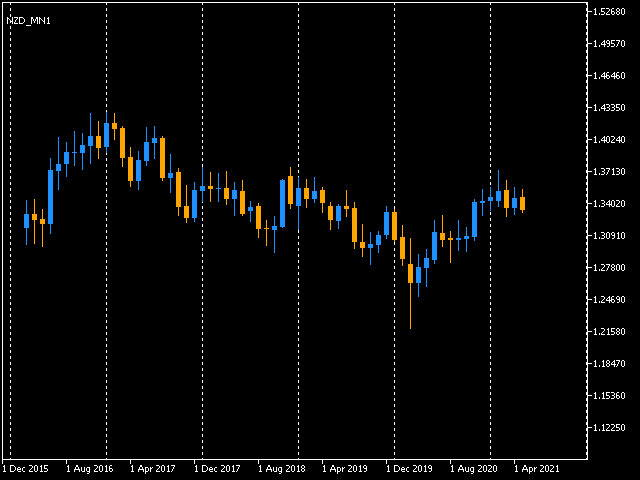
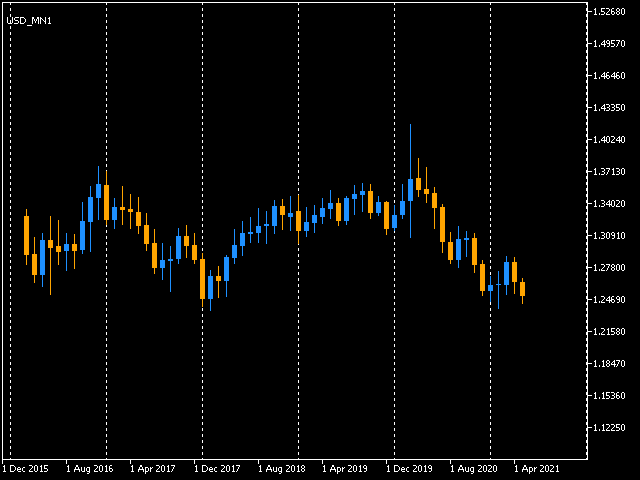
Currency Chart is a MT5 overlay indicator for 8 major currencies including AUD, CAD, CHF, EUR, GBP, JPY, NZD and USD. The chart represents one currency average prices relative to the others. The currency chart makes us easy in evaluate direction, trend, strength, support and resistant levels or even a reversal level of the currency. Good for medium-term and long-term trading styles.

  • Chart type: Candlestick chart, bar chart or line chart.
  • Chart timeframe: Same as MT5 timeframe.
  • Built-in indicators: 3-Moving average lines.

Parameters

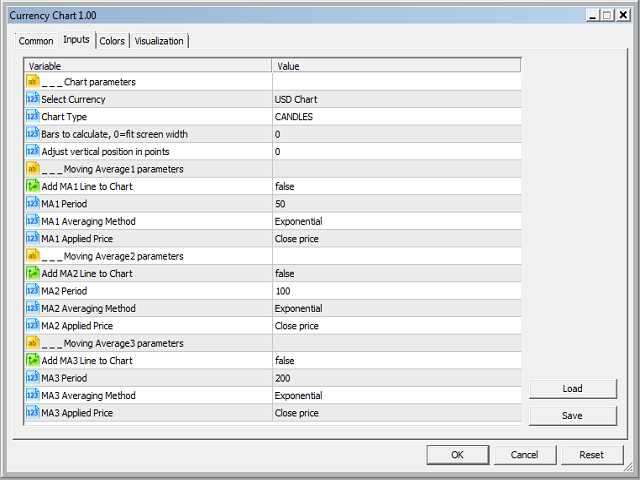
  • Chart parameters
    1. Select Currency: select a currency name from drop-down menu.
    2. Chart Type: select chart type from  drop-down menu.
    3. Bars to calculate: specify number of bars to display on MT5 terminal, 0=auto fit sreen width.
    4. Adjust vertical position in points: specify number of points in positive or negative value to move the chart up or down from vertical center level. 0=center.
      • Moving Average parameters(3 Sets for 3 Moving Averages)
        1. Add MA Line to chart: true=add, false=don't add.
        2. MA Period: specify moving average period.
        3. MA Averaging Method: select averaging method.
        4. MA Applied Price: select moving average applied price.

        Reading and interpretation, we can read and interpret a currency chart the same way as a chart for currency pairs.

        How to use the currency chart effectively?

        • Only start from reading the chart of one currency at a time.
        • Spot swing highs and swing lows to draw dynamic support and resistant lines.
        • Ascertain a direction of the currency from the chart.
        • Find other currencies that move in opposite direction.
        • Pairs both currencies together to achieve the target pair.
        • Open the chart of the target pair to evaluate trade possibility according to your trading criteria.

          How to evaluate currency strength from the chart?

          • A candlestick or series of candlesticks of wide body and short wicks denotes the strength of the currency.
          • A candlestick or series of candlesticks of narrow body and long wicks denotes the weakness of the currency.

          How to run the 'Currency Chart' on weekend or when the server closed?

          • To get 'Currency Chart' work properly on weekend is to switch MT5 timeframe button  back and forth until all processes done.

          Note: if you have any questions or require further information please feel free to contact me via personal message.
          推荐产品
          本指标是实践实战交易完善的波浪自动分析的指标   !  案例... 注: 波浪分级用西方叫法不习惯,因受到缠论(缠中说禅)命名方式习惯的影响,我是将基础波浪命名为 笔 ,将二级波段命名为 段 ,同时具有趋势方向的段命名为 主趋段 (以后笔记中都是这种命名方式,先告知大家),但是算法上和缠论关系不大切勿混淆.反映的是本人分析盘面总结的 千变万化纷繁复杂的运行规律 . 对波段进行了标准化定义,不再是不同人不同的浪  ,   对人为干扰的画法进行了排除,在严格分析进场起到了关键的作用 . 使用这个指标,等于将交易界面提升美感,抛弃最原始的K线交易带你进入新的交易层次.如果不是为了交易,在宣传上也将使客户观感提升层次. 指标内容: 1.   基础波浪 (笔) : 首先我们找出了价格波动过程中的基础波动拐点,当然他的有序性低,为下一步的计算提供基础. 2.   二级波段( 段 ) :在基础波浪的基础上,通过算法分析得到层级更明显的二级波段,二级波段为波浪提供了分析基础 3.   波浪( 浪 ): 有着更清晰的趋势,更清晰直观的方向.分析一个波浪是否延续,需要看二级波段的形态,分析二
          My Point MT5
          Claudia Ramona Angerer
          Diagnosis of major and minor pivot Trend detection with many signals Can be used in all symbols Can be used in all time frames Settings: Back Show: The number of candles it displays If you need any adjustments, or have any questions or suggestions, message me How to trade: Blue: sell signal Red: buy signal Blue and red at the same time: no signal Exit signal: Opposite signal
          Trend dashboard MT5
          Jan Flodin
          5 (1)
          当识别出强劲趋势或趋势逆转时,此多时间框架和多品种趋势指标会发出警报。它可以通过选择使用移动平均线(单或双(MA 交叉))、RSI、布林带、ADX、综合指数(Constance M. Brown)、Awesome(比尔威廉姆斯)、MACD(信号线)来构建仪表板来实现)、Heiken Ashi 平滑、赫尔移动平均线、随机指标交叉、江恩 HiLo 激活器和交易者动态指数。它可以用于从 M1 到 MN 的所有时间范围。最大限度。仪表板中可以同时显示 9 个时间范围。仪表板中的颜色为绿色代表看涨,红色代表看跌,蓝色代表中性(指标值不在范围内)。 结合您自己的规则和技术,该指标将允许您创建(或增强)您自己的强大系统。 特征 指标可以将信号写入全局变量,智能交易系统可以使用这些变量进行自动交易 。 最多可以选择 9 个要使用的时间范围。 在仪表板内持续执行趋势强度排名排序。可以禁用此排序,以便更轻松地查找特定符号。然后,交易品种将按照它们在交易品种参数中输入的相同顺序显示,或者按照它们在市场报价窗口中显示的顺序显示。 通过在矩形内单击,将打开一个带有相关交易品种和时间范围的新图表。 将指标放在一张
          "Battles between bulls and bears continue to influence price development long after the combat has ended, leaving behind a messy field that observant technicians can use to manage risk and find opportunities. Apply "trend mirror" analysis to examine these volatile areas, looking for past action to impact the current trend when price turns and crosses those boundaries." RSI Mirrors and Reflections is a robust technique using multiple RSI periods, mirrors and reflections based on RSI values to ind
          Analyze potential   Covered Call   structures in the Brazilian market. Define where you want the break-even of your structure and see what structure to use. It works for any asset that has authorized series of options on B3 (Brazilian Stock Exchange). Associate the indicator to the asset you want to set up the Covered Call. *** ATENTION *** For the robot to work, the service that consults the authorized series of B3 options must be running on your terminal. Download the utility for free from
          FREE
          KT Price Border MT5
          KEENBASE SOFTWARE SOLUTIONS
          KT Price Border creates a three-band price envelope that identifies potential swing high and low areas in the market. These levels can also be used as dynamic market support and resistance. The mid-band can also be used to identify the trend direction. As a result, it also functions as a trend-following indicator. In addition, its ease of use and more straightforward conveyance of trade signals significantly benefit new traders. Features It works well on most of the Forex currency pairs. It
          KT Displaced Moving Averages MT5
          KEENBASE SOFTWARE SOLUTIONS
          KT DMA is a modified and advanced version of the classic Displaced Moving Averages with buy/sell crossover alerts and a Multi-Timeframe scanner that shows DMA's direction across each real-time time frame. A Displaced Moving Average is a simple moving average that moves ahead or backward in a time frame (either short-term or long-term). It also allows you to predict price movement more accurately. Features Depicts the trend direction using the alignment of three moving averages. Buy/Sell signa
          Candlestick Patterns Scanner MT5
          KEENBASE SOFTWARE SOLUTIONS
          KT Candlestick Patterns Scanner is a Multi-Symbol and Multi-Timeframe scanner that fetches and shows various candlestick patterns on 28 currency pairs and 9 time-frames concurrently . The scanner finds the candlestick patterns by loading the KT Candlestick Patterns indicator as a resource in the background. Features The scanner can find the candlestick patterns on 252* combinations of symbols and time-frames from a single chart. Open the signal's chart loaded with a predefined template with
          免费下载,请加入我们的群组。限时优惠! 介绍我们创新的MQL5指标,旨在通过在低时间框架上提供日烛边界的清晰视觉提示来增强您的交易体验。这个工具非常适合那些希望了解日烛进程的交易者,确保更好的决策和策略执行。 主要特点 日烛箱体可视化: 在低时间框架上绘制从日烛开始到结束的清晰框体。 明确标示日烛的起点和终点,为跟踪日市场动向提供视觉参考。 图表清晰度增强: 提供干净和有序的图表视图,帮助交易者快速识别日边界而不使屏幕变得杂乱。 提高在日交易活动背景下分析市场趋势和模式的能力。 无缝集成: 轻松集成到现有的MQL5平台设置中,快速安装并立即使用。 兼容各种低时间框架,包括M1、M5、M15、M30和H1。 自定义选项: 可调节的框体颜色和样式,以符合您的图表偏好并增强可见性。 可配置设置以满足您特定的交易需求。 优势 改进的市场分析: 通过清楚地看到日高、日低和日内价格走势,更好地了解市场行为。 利用日边界的视觉表示做出更明智的交易决策。 节省时间的工具: 节省手动图表分析的时间,专注于执行您的交易策略。 快速评估市场状况,并根据日价格变动调整您的交易。 增强的交易策略: 使用日烛箱体
          CChart
          Rong Bin Su
          在外汇和金融市场中,快速反应和精准的决策至关重要。然而,常规的 MetaTrader 5 终端最低只支持 1 分钟图表,限制了交易者对市场波动的敏感度。为了解决这一问题,我们推出了全新的 秒级图表 K 线指标 ,让您在副图中轻松查看和分析 1 秒至 30 秒的市场动态。 主要功能 支持多种秒级周期 :该指标允许您选择以下周期,满足不同交易策略的需求: S1 : 1 秒 S2 : 2 秒 S3 : 3 秒 S4 : 4 秒 S5 : 5 秒 S10 : 10 秒 S15 : 15 秒 S20 : 20 秒 S30 : 30 秒 实时更新 :秒级图表将实时更新,确保您在每一刻都能获取到最新的市场信息,帮助您做出及时的交易决策。 用户友好的界面 :该指标在副图中显示,直观易用,您可以轻松切换不同的时间周期,快速分析市场走势。 适用人群 短线交易者 :适合高频交易和短线策略的交易者,通过秒级图表捕捉瞬息万变的市场机会。 技术分析师 :为技术分析提供更细致的数据支持,帮助您识别潜在的买入和卖出信号。 如何使用 将指标添加到您的图表上。 选择您希望观察的秒级时间周期。 实时监控市场动向,利用丰
          Zigzag X Fibo
          Ian David Emmanuel Bello
          The ZigZag indicator's main objective is to highlight significant price movements by filtering out minor price fluctuations. It enables the visualization of trends by eliminating market "noise," which can assist traders in making more informed decisions. Adding the Fibonacci indicator, which is a powerful tool for identifying potential support and resistance levels in financial markets.
          Spike Oscillator
          Vitalii Kondratiuk
          Indicator for searching for price reversals Works well on commodity indices and currency pairs On charts such as Boom Cash, it shows the beginning of a protracted movement well. You can also catch splashes. The indicator uses algorithms, an oscillator and a trend indicator that work together. The indicator shows a candle opening signal (does not disappear, does not redraw and does not recalculate its readings) A good quality tool that can become the basis for creating your own trading system.
          QuantumAlert Stoch Navigator is a free indicator available for MT4/MT5 platforms, its work is to provide "alerts" when the market is inside "overbought and oversold" regions in the form of "buy or sell" signals. This indicator comes with many customization options mentioned in the parameter section below, user can customise these parameters as needful. Join our   MQL5 group , where we share important news and updates. You are also welcome to join our private channel as well, contact me for the p
          FREE
          WhaleFinder MT5
          Kazuya Yamaoka
          Considering the main theories of Forex (Dow Theory, support lines, chart patterns, and Fibonacci retracements), It tells you the price range where whales (large investors) are likely to appear. You can trade at the price points that professionals also aim for. You no longer have to warry about where to aim next. We are live-streaming the actual operation of the system. Please check for yourself if it is usable. Please check it out for yourself. https://www.youtube.com/@ganesha_forex We do n
          Ali Levels Pro
          Alexandra Voicu
          Ali Levels Pro is an indicator designed to identify and draw levels of interest including: Opening Range High/Low with seconds precision,  Previous Session High/Low (if you are a Intraday trader who trades Indices or Commodities maybe you want to know yesterday New York Session high and low),  Overnight Session High/Low,  Previous Day High/Low,  Previous Week High/Low, and  Previous Month High/Low. Traders use this levels as support and resistance levels.  By searching for confluences between
          这个多时间框架和多品种指标扫描 Pin bar、晨星/晚星、吞没、镊子、三线罢工、内线和三角旗。 该指标也可用于单一图表模式。请在产品的     博客 。     结合您自己的规则和技术,该指标将允许您创建(或增强)您自己的强大系统。 特征 可以同时监控您的市场报价窗口中可见的所有交易品种。将该指标仅应用于一张图表,并立即监控整个市场。 监控从 M1 到 MN 的每个时间范围,并在识别出模式时向您发送实时警报(弹出、推送或邮件)。 可以使用 RSI 和布林带作为 pin bar、晨星/晚星 、吞没和镊子形态的 过滤器,以便正确识别潜在的逆转。 可以使用移动平均线作为主要趋势过滤器,使用 ADX 作为波动率过滤器。 该指示器包括一个交互式面板。当单击一个项目时,将打开一个带有相关代码和时间范围的新图表。 该指标可以将信号写入一个文件,EA 可以使用该文件进行自动交易。比如 这个产品 。 Pennant 和三角形扫描可识别高概率的突破模式。它通过识别强大的、对称的三角旗和三角形来做到这一点。这种模式在更高的时间范围内不会经常出现。但是当它发生时,这是一个非常高概率的设置。请参见    
          I do not have the exact indicator for MT4 but the nearest possible look alike can be downloaded from here . Also you may check this link . This is the exact conversion from TradingView: "Donchian Trend Ribbon" By "LonesomeTheBlue". This is a light-load processing and non-repaint indicator. Buffers are available for processing in EAs. You can message in private chat for further changes you need. Thanks for downloading 
          Candle Good Setup
          Kibalo Alain Kabissa
          You ask yourself the question every time you open your charts: how to win in trading? Will using a lot of indicators work? well know that I also asked myself the same questions when I first started trading. After testing many indicators, I realized that winning trading is simple and accurate trading. after several months of thinking and optimizing I was able to find my solution: Candle Good Setup Candle Good setup is a trend and entry timing indicator analyzing the market in multi-frame to give
          KT Tether Line MT5
          KEENBASE SOFTWARE SOLUTIONS
          The KT Tether Line is a trend-following tool consisting of three indicators that work together to generate trading signals. It can correctly identify market trends while signaling trade entries. It was first introduced by Bryan Strain in the Stock & Commodities magazine in 2000 in "How to get with the trend and out at the end." The Concept When a market trend is confirmed, the most challenging part is determining the timing of the entries. This indicator alerts you to potential trend reversal
          KT Raff Channel MT5
          KEENBASE SOFTWARE SOLUTIONS
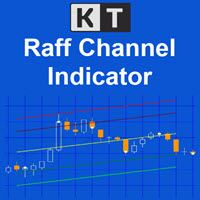
          The KT Raff Channel is an enhanced and refined iteration of the original Raff channel concept pioneered by Gilbert Raff in 1996. This indicator builds upon Raff's initial work, incorporating modifications and advancements to provide traders with a more sophisticated and powerful tool. Gilbert Raff, a renowned name in the field of financial market analysis, is the developer of the Raff Regression Channel. This technical tool is designed for discerning and validating possible market price trends.
          ZigZagAllinOne
          Alberto Da Silva Lira
          Indicator focusing on the market's ZigZag, also adding 2 other already established indicators: Book of Offers and Balance Aggressor (Time & Trades), this indicator allows to detect the best price trigger (buy or sell) in the aggressions to the Book of Offers including filters important as Aggression in Candle. Recommended use on the Brazilian iBovespa B3, but it also serves in Forex as long as the assets have information from the Book, in the case of Forex it is not possible to use the Aggres
          FIlter Profesional
          Ignacio Agustin Mene Franco
          Filter Professional , Safari pack indicator 3, It has an indicator that is a type of moving average with color that will mark the entrance perfect at different times, when it marks the green line, an upward trend is coming and it is entry for purchase, when it marks the gold line it is a downtrend gives bearish entry zone. It is used for the Forex markets and synthetic indices all pairs! All temporalities! Good profit!
          Market DNA
          Arief
          5 (1)
          BONUS AUX VIP Club 2024 : Include EA Check Endpoint, EA Trade Manager, etc to enhance the performance of this tool to its maximum potential Click Here to Download Files ( for users only ) FREE Trading Education Available Daily via Zoom --- For More Info or Instant Message Click link --- https://t.me/abcdwave Direct analysis from several students on the t.me/FXGoldWatch Telegram Public Channel The Breakthrough  PREMIUM  Trading Tool & Indicator for Elliott Wave Chaos T
          JR Trend Mt5
          Jefr Alnafey
          with JR Trend you will able to enter and exit every trade with just a signals appear no need for any strategy just flow the indicator it work on all pairs and all Timeframe i usually take a look on higher timeframe and return to the lowest  timeframe and make an order with indicator signals you can see the amazing result so you can depend only on it intraday or swing as you wish 
          Insight Pro is a comprehensive tool for market analysis. It offers various features such as trend analysis, resistance and support levels, and distribution analysis, suitable for both novice and experienced traders. Features Trend Analysis Detects and visualizes market trends. Suggests potential entry and exit points based on trends. Customizable trend lines for clear market direction. Displays extreme levels based on standard deviation. Positive slope indicates buy orders; negative slope indic
          FlowVol AllinOne
          Thalles Nascimento De Carvalho
          FlowVol All-in-One: 完整的流动分析,涵盖 DOM、VSA 和 Times and Sales 准备好提升您在 MT5 上的订单流分析了吗? FlowVol All-in-One 是订单流交易者的终极工具,将三种主要的量化分析技术(DOM、VSA 和 Times and Sales)结合成一个强大的指标。为了充分发挥此流动工具的潜力,您需要访问经纪商的订单簿。该工具非常适合做短线交易的交易者,尤其是快速入市和出市的交易者,它提供关键的市场机会分析,帮助您快速识别市场机会。 精确识别价格波动 FlowVol All-in-One 通过先进的订单簿分析,识别订单簿中的不平衡,为快速和准确的决策提供详细的视角。这个指标提供了订单和成交量的完整视图,最大化您捕捉市场战略性和细微波动的机会。 直观的图表信号颜色显示 FlowVol All-in-One 在图表上应用高级颜色标记,自动反映不平衡信号。这种颜色标记根据信号强度变化,给予交易者直观的视觉感受,便于快速解读所识别的不平衡信号。 重要提示:请检查 MT5 上的订单簿和 Times and Sa
          This indicator closes the positions when Profit. This way you can achieve a goal without determine Take Profit.  Parameters: Profit: the amount of Dolllars you want to close when profit.  Just determine Profit section and open new positions. If Any of your positions reaches above Profit , Indicator will close automatically and you will recieve your Profit. 
          货币强度计,为您提供当前哪些货币强,哪些货币弱的快速视觉指南。 该仪表测量所有外汇交叉货币对的强度,并对它们进行计算以确定每种货币的整体强度。 我们根据 28 对的趋势计算货币的强度。 .货币强度计是指标的通用名称,用于显示您是在处理强货币还是弱货币。这种基于算法的指标依赖于各种货币对的汇率来提供每种货币的强弱程度。 通过访问我们的 MQL5 博客,您可以下载该指标的免费版本。 购买前试用,不受 Metatrader Tester 限制: 单击此处 1. 文档 所有趋势货币强度文档(说明)和策略详细信息均可在我们 MQL5 博客的这篇文章中找到: 单击此处。 2. 联系方式 如果您有任何问题或需要帮助,请通过私信联系我。 3. 作者 SAYADI ACHREF,金融科技软件工程师,Finansya 创始人。
          Retracement Feeder MT5
          Innovicient Limited
          The Retracement Feeder  checks for retracement opportunities after the first move has occurred.  Basically it scans for the second wave of trend. Works with any financial instrument,  It does not repaint/change color or cancel arrows, Easy to set and use. Works great with Renko Charts ________________________________________ MT4 version  | Best used with :  Market Heart MT5 | How it works The indicator is based on RSI and Stochastics.  The algorithm used in the Retracement Feeder allows the Sto
          Fibo Ruby
          Ignacio Agustin Mene Franco
          Fibo Ruby indicator 5/5 pack ruby fibo ruby ​​has the strategy of a programmed fibonacci to capture the bullish trend as bass player ideal for grabbing rebounds at the points of 23.6, 38.2, 50.0 and 61.8 It adapts to any temporality, be it for scalping or intraday. works for forex markets, all pairs It is used for synthetic index markets, all pairs great for boom and crash!
          该产品的买家也购买
          TPSproTREND PrO MT5
          Roman Podpora
          4.54 (13)
          TPSpro RFI Levels MT5
          Roman Podpora
          4.67 (15)
          指示       俄罗斯 -        英语   建议 与指示器一起使用     -       TPSpro 趋势专业版 -   MT4版本       交易中的一个关键要素是做出买卖交易工具决定的区域或水平。尽管主要参与者试图隐藏他们在市场中的存在,但他们不可避免地会留下痕迹。我们的任务是学习如何识别这些痕迹并正确解释它们。 主要功能: 向卖家和买家显示活跃区域! 该指标显示所有正确的初始买入和卖出脉冲水平/区域。激活这些水平/区域后,开始寻找切入点,水平会改变颜色并填充特定阴影。此外,还会显示箭头,以便更直观地了解情况。 显示更高时间范围内的级别/区域(MTF 模式) 添加了使用更高时间间隔显示级别/区域的功能。此外,该指标还具有自动趋势检测功能(   TPSproTREND PRO   )。 用于交易的单独专业的逐步算法。 该算法专为日内交易而设计,既可顺势交易,也可逆势交易。每个活动模板均提供详细说明。 适用于多种时间范围 。 TPSpro RFI 水平指标可用于图表上的任何时间范围,从一分钟(M1)开始一直到每月(MN)。 图形和声音警报。 该指标提供图形和声音指示
          RelicusRoad Pro MT5
          Relicus LLC
          5 (17)
          现在$ 147(更新后增加到$ 499) - 无限帐户(PC或Mac) RelicusRoad 用户手册 + 培训视频 + 访问 Private Discord Group + VIP 身份 一种看待市场的新方式 RelicusRoad 是世界上最强大的外汇、期货、加密货币、股票和指数交易指标,为交易者提供保持盈利所需的所有信息和工具。我们提供技术分析和交易计划,帮助每一位交易者取得成功,从初学者到高级。它是一个关键的交易指标,可以提供足够的信息来预测未来的市场。我们相信一个完整的解决方案,而不是图表上几个没有意义的不同指标。这是一个多合一指标,显示无与伦比且非常准确的信号、箭头 + 价格行为信息。 RelicusRoad 基于强大的人工智能,提供缺失的信息和工具来教育您并使您成为交易专家,成为成功的交易者。 几乎所有技术指标都滞后,这意味着它们只能报告已经发生的事情。因此,他们只确认您过去可以看到的价格已经在哪里。我们相信领先指标可以预测未来价格,而无需重新绘制,也不要过度依赖可能改变并导致重新绘制的滞后指标。如果您根据滞后指标进行交易并建立头寸,您就知道您已
          Basic Harmonic Patterns Dashboard MT5
          Mehran Sepah Mansoor
          4.57 (7)
          该仪表盘显示所选符号的最新可用谐波形态,因此您可以节省时间并提高效率 /  MT4 版本 。 免费指标:  Basic Harmonic Pattern 指标列 Symbol:   显示所选符号 Trend:     看涨或看跌 Pattern:    形态类型(Gartley、蝴蝶、蝙蝠、螃蟹、鲨鱼、Cypher 或 ABCD) Entry:     入口价格 SL: 止损价 TP1: 第一止盈价 TP2: 第二次获利价格 TP3: 第三次获利价格 Current price:    当前价格 Age (in bars):   最后绘制的模式的年龄 主要输入 Symbols :   从 "28 种主要货币对 "或 "选定符号 "中选择。 Selected Symbols :   希望监控的符号,用逗号分隔("EURUSD,GBPUSD,XAUUSD")。如果您的经纪商为货币对设置了后缀或前缀,您必须在以下两个参数中添加(货币对前缀或货币对后缀)。 Max Iteration:   调整模式的最大迭代次数(如果该值越小,则模式越少,性能越快;如果该值越大,则模式越多,性能
          Golden Trend Indicator MT5
          Noha Mohamed Fathy Younes Badr
          4.8 (10)
          Golden Trend indicator  is The best indicator for predicting trend movement this indicator never lags and never repaints and never back paints    and give  arrow buy and sell    before the candle appear  and it will help you and  will make your trading decisions clearer its work on all currencies and  gold and crypto and all time frame This unique  indicator uses very secret algorithms to catch the  trends, so you can trade using this indicator and see the trend clear on charts  manual guide and
          FX Power MT5 NG
          Daniel Stein
          5 (7)
          释放 FX Power NG 的全部威力:终极货币强度表 八年多来,FX Power 一直为全球交易者提供可靠、精确的货币强弱分析。 现在,FX Power NG 将这一值得信赖的工具提升到新的水平,提供先进的功能,为您的交易带来无与伦比的准确性、定制化和洞察力。 是什么让 FX Power NG 成为严肃交易者的必备工具? FX Power NG 以您喜爱的原版 FX Power 的所有功能为基础,进行了重要的添加和改进: 黄金强度分析 (XAU):现在,您可以在追踪货币对的同时追踪黄金的强弱,从而获得更广泛的市场洞察力。 精细计算:在每次分析中体验更精确、更可靠的结果。 自定义分析周期:调整分析周期以适应您的交易策略,从日内分析到长期洞察。 先进的多实例设置:运行多个实例以获得全面的视图,非常适合分析多个时间框架或策略。 无限图形定制:个性化每个图表的颜色和样式,以匹配您的交易环境。 增强的警报功能:设置自定义通知,让你不会错过重要的转变或机会。 现代设计和动态面板:享受专为最新操作系统设计的时尚、用户友好界面,以及流畅的交互式指标面板。 FX Power NG 的突出
          Atomic Analyst MT5
          Issam Kassas
          4.32 (19)
          首先值得强调的是,该交易指标是非重绘、非延迟的指标,这使其成为手动和机器人交易的理想选择。 用户手册:设置、输入和策略。 Atomic Analyst是一种PA价格行动指标,利用价格的力量和动量来寻找市场上更好的机会。配备了高级过滤器,可帮助去除噪音和假信号,并提高交易潜力。使用多层复杂的指标,Atomic Analyst扫描图表,并将复杂的数学计算转化为任何初学者都能理解并用来做出一致交易决策的简单信号和颜色。 “Atomic Analyst”是专为新手和经验丰富的交易者量身定制的综合交易解决方案。它将高级指标和一流功能融合为一体的交易策略,使其成为所有类型交易者的多功能选择。 日内交易和剥头皮策略:专为快速准确的日内交易和短期交易而设计。 日内和摆动交易策略:可用作追求价格大幅波动的日内和摆动交易者的可靠工具。 多货币和市场:凭借其可靠的精度,在不同的工具和市场上运作。 多个时间框架:可在多个时间框架上使用,性能良好。 稳定性:所有指标均不重绘、不重绘和不滞后,确保可靠的信号。 信号清晰度:提供箭头信号,用于清晰的入场和出场点。 实时警报:通过交易入场、SL和TP警报通知交
          FX Volume MT5
          Daniel Stein
          4.93 (14)
          利用外汇交易量在外汇交易中获得真正的优势:终极成交量指标 外汇交易量(FX Volume)是第一个也是唯一一个从内部人士的角度揭示真实市场情绪的交易量指标。通过对机构市场参与者和经纪商的定位提供独到的见解,FX Volume 使您能够以通常只为主要参与者保留的先见之明进行交易。告别 COT 报告的延迟,FX Volume 可以在您的图表上即时为您提供这些关键信息,使您能够做出更快、更明智的交易决策。 为什么外汇交易量对您的交易至关重要? 使用 FX Volume,您可以获得无与伦比的独特市场数据,为您提供一般交易量指标无法提供的洞察力。以下是您可以在图表上直接跟踪的数据: 仓位比率:查看各种货币的多空比率,清晰了解市场情绪。 比率变化:查看所选时间段内多头头寸的百分比变化。 总交易量:实时跟踪各货币的总交易量(多头和空头)。 详细的多头和空头交易量:准确了解每种货币的买卖量。 净多头交易量:查看多头和空头头寸之间的差额,以衡量净情绪。 净多头百分比变化:以百分比的形式了解净多头情绪的变化,以便快速比较。 成交量-价格相关性:跟踪成交量如何影响价格,找到潜在转折点。 如何访问
          Quantum TrendPulse
          Bogdan Ion Puscasu
          5 (4)
          介绍 Quantum TrendPulse   ,这是一款终极交易工具,它将 SuperTrend   、   RSI 和 Stochastic 的强大功能整合到一个综合指标中,以最大限度地发挥您的交易潜力。该指标专为追求精准和效率的交易者而设计,可帮助您自信地识别市场趋势、动量变化以及最佳进入和退出点。 主要特点: 超级趋势整合: 轻松跟随当前的市场趋势并乘上盈利浪潮。 RSI 精度: 检测超买和超卖水平,非常适合把握市场逆转时机,可用作 SuperTrend 的过滤器 随机精度: 利用随机振荡在波动的市场中寻找隐藏的机会, 用作超级趋势的过滤器 多时间范围分析: 从 M5 到 H1 或 H4,在不同时间范围内关注市场动态。 可定制的警报: 当您的自定义交易条件得到满足时收到通知,这样您就不会错过任何交易。 无论您是新手还是经验丰富的交易员,   Quantum TrendPulse 都能为您提供所需的优势,帮助您增强策略并自信地进行交易。借助这一强大的指标,将洞察力转化为利润 — 掌控您的交易! ***购买 Quantum TrendPulse,即可免费获得 Quantum T
          首先,值得强调的是,这个交易系统是一个非重绘、非重画和非滞后的指标,这使得它非常适合手动和机器人交易。 在线课程,手册和下载预设。 “智能趋势交易系统 MT5”是专为新手和经验丰富的交易者量身定制的综合交易解决方案。它结合了超过 10 个优质指标,具有 7 多个强大的交易策略,使其成为适用于各种市场条件的多功能选择。 趋势跟随策略:提供精确的入场和止损管理,以有效地跟随趋势。 反转策略:识别潜在的趋势反转,使交易者能够利用区域市场的机会。 剃头策略:专为快速准确的日内交易和短期交易而设计。 稳定性:所有指标都不会重绘、不会重画和不会滞后,确保可靠的信号。 定制:支持自定义策略,以满足个人交易偏好。超过 7 种策略和组合可帮助您找到最佳策略。 信号清晰度:提供箭头信号,以指示清晰的入场和退出点。 实时警报:通过交易进出警报使交易者保持了解。 深入分析:提供更高时间框架的趋势分析和实时交易监控。 自适应颜色编码:利用蜡烛颜色编码来显示成交量、趋势和反转蜡烛信号。通过蜡烛颜色分析市场方向。 “智能趋势交易系统 MT5”赋予交易者必要的工具,以便在各种市场条件下做出明智和战略性的交易决策。无论
          TPA True Price Action indicator reveals the true price action of the market makers through 100% non-repainting signals strictly at the close of a candle! TPA shows entries and re-entries, every time the bulls are definitely stronger than the bears and vice versa. Not to confuse with red/green candles. The shift of power gets confirmed at the earliest stage and is ONE exit strategy of several. There are available now two free parts of the TPA User Guide for our customers. The first "The Basics"
          FX Levels MT5
          Daniel Stein
          探索外汇交易水平:您成功交易的终极支撑位和阻力位指标 FX Levels 不仅仅是一个支撑位和阻力位指标;对于那些希望在所有交易符号(无论是货币对、指数、股票还是商品)上获得精确性、可靠性和无缝功能的严肃交易者来说,它是一个改变游戏规则的工具。FX Levels基于成熟的灯塔(Lighthouse)方法,并增强了动态、实时的适应性,可将市场反转点直接显示在您的图表上,非常适合设定精确的盈利目标和优化您的交易条目。 为什么选择 FX Levels? Stein Investments 团队利用多年与经纪商及其不同数据源打交道的经验,使外汇交易水平在准确性和一致性方面脱颖而出。不同经纪商的水平几乎 100% 相同,FX Levels 为您提供无与伦比的可靠性,这是其他指标无法提供的。我们对细节的追求提升了 FX Levels 的水平,确保它不仅能满足您的期望,还能改变您进行支撑位和阻力位分析的方式。 FX Levels 的主要特点 两种分析方法:您可以选择经典的 "灯塔 "方法(适合静态、每日更新的水平),或者先进的动态方法(对蜡烛图形态做出实时反应,提供适应市场变化的可操作水
          Trend Forecaster
          Alexey Minkov
          5 (6)
          !!!CHRISTMAS SALE!!! The Trend Forecaster indicator utilizes a unique proprietary algorithm to determine entry points for a breakout trading strategy. The indicator identifies price clusters, analyzes price movement near levels, and provides a signal when the price breaks through a level. The Trend Forecaster indicator is suitable for all financial assets, including currencies (Forex), metals, stocks, indices, and cryptocurrencies. You can also adjust the indicator to work on any time frames, al
          FX Dynamic - 您需要的唯一 ATR 指标 准备好用无与伦比的精确性和洞察力为您的交易策略增添动力了吗? FX Dynamic 是首个也是唯一的 ATR 指标,专为 货币分析 和 自动调整经纪商的 GMT 变动 而设计。告别过时的工具,拥抱掌握市场波动的终极解决方案。 为什么 FX Dynamic 能够改变游戏规则? 基于货币的 ATR 分析 - 摆脱传统工具的束缚。FX Dynamic 是首个超越外汇货币对和商品等符号的 ATR 指标,可 深入洞察 单个货币的 波动性 。 无与伦比的 GMT 时区 转换调整准确性 - 无需再手动修正时区。FX Dynamic 会 自动考虑经纪商的 GMT 时区转换 ,确保提供市场上最准确、最可靠的分析。 一体化多功能性 - 从短期剥头皮到长期投资,FX Dynamic 可通过自定义时间框架和精确设置适应您的交易风格。 交易者喜爱的功能 多资产分析: 分析货币、外汇货币对、黄金等。FX Dynamic 可让您发现 单个货币 对之外 的 true 动态 。 增强型风险管理: 利用为每种资产和货币量身定制的可靠 ATR 数据,自信地
          介绍     Quantum Breakout PRO   ,突破性的 MQL5 指标,正在改变您交易突破区域的方式!由拥有超过13年交易经验的资深交易员团队开发,     量子突破 PRO     旨在通过其创新和动态的突破区域策略将您的交易之旅推向新的高度。 量子突破指标将为您提供带有 5 个利润目标区域的突破区域的信号箭头,以及基于突破框的止损建议。 它既适合新手交易者,也适合专业交易者。 量子 EA 通道:       点击这里 重要的!购买后请私信我领取安装手册。 建议: 时间范围:M15 货币对:GBPJPY、EURJPY、USDJPY、NZDUSD、XAUUSD 账户类型:ECN、Raw 或 Razor,点差极低 经纪商时间:GMT +3 经纪商:IC Markets、Pepperstone with Raw 和 Razor 的点差最低 规格: 不重漆! 最多 5 个建议利润目标区域 建议止损水平 可定制的盒子。您可以设置自己的 Box Time Start 和 Box Time End。 接触 如果您有任何疑问或需要帮
          IX Power MT5
          Daniel Stein
          4.17 (6)
          介绍 IX Power - 提高交易精确度的终极工具! IX Power 采用与 FX Power 相同的无与伦比的精确度设计,可让您掌握从指数和股票到商品、ETF 甚至加密货币的任何交易符号。准确洞察所有您喜爱的资产的短期、中期和长期趋势,为提升您的交易水平做好准备。 为什么选择 IX Power? 有了 IX Power,您的时机选择将变得更加敏锐,帮助您做出更明智、更快速的交易决策。无论您是剥头皮还是波段交易,IX Power 都能为您的一举一动提供即时、可操作的数据。加入无数交易者的行列,体验 IX Power 的变革力量! IX Power 傲视群雄的主要特点 100% 准确的非重绘结果:为您终端上的每个交易符号获取一致、可靠的数据。 自定义强度分析:从预先配置的时段中进行选择,或创建您自己的时段。 灵活的通知:通过电子邮件、信息或手机提醒等自定义通知方式,随时了解市场动态。 此外,IX Power 可与您的交易平台无缝集成。 EA 可访问缓冲区:是使用专家顾问(EA)的交易者的理想之选。 优化性能:设置自定义计算限制,在不牺牲准确性的情况下最大限度地提高速度。
          Atbot
          Zaha Feiz
          4.75 (44)
          AtBot: 它是如何工作的以及如何使用它 ### 它是如何工作的 “AtBot”指标用于MT5平台,通过结合技术分析工具生成买入和卖出信号。它集成了简单移动平均线(SMA)、指数移动平均线(EMA)和平均真实波幅(ATR)指标,以识别交易机会。此外,它还可以利用Heikin Ashi蜡烛来增强信号的准确性。 购买后留下评论,您将获得特别的奖励礼物。 ### 主要特点: - 不重绘: 信号在绘制后不会改变。 - 不变动: 信号保持一致,不会被更改。 - 无延迟: 提供及时的信号,没有延迟。 - 多种时间框架: 可在任何时间框架上使用,以适应您的交易策略。 ### 操作步骤: #### 输入和设置: - firstkey (TrendValue): 调整趋势检测的灵敏度。 - Secondkey (SignalValue): 定义买入/卖出信号生成的灵敏度。 - masterkey (ExitValue): 控制信号的退出策略。 - h: 切换是否根据Heikin Ashi蜡烛生成信号(真/假)。 - notifications: 启用或禁用信号提醒。 #### ATR计算: ATR测
          Entry Points Pro for MT5
          Yury Orlov
          4.44 (124)
          这款指标用于 MT5,可提供准确的入场交易信号,且无重绘。 它可应用在任何金融资产:外汇、加密货币、贵金属、股票、指数。 它将提供极其精准的评估,并告诉您何时开仓和平仓的最佳时机。 观看 视频 (6:22),其中包含一个仅处理单一信号的示例,该信号即可值回指标购价! 大多数交易者在 Entry Points Pro 指标的帮助下,在第一个交易周内即改善了他们的交易结果。 订阅我们的 Telegram 群 ! Entry Points Pro 指标的益处。 入场信号无重绘 如果信号出现,并得到确认,则它不会再消失;不像是重绘指标,它会导致重大的财产损失,因为它们可以在显示信号后再将其删除。 无差错开仓 指标算法可令您找到入场交易(买入或卖出资产)的理想时机,从而提高每位交易者的成功率。 Entry Points Pro 可操作任何资产 它允许您在 MT5 平台上交易任何经纪商的加密货币、股票、贵金属、指数、大宗商品和货币。 提供任何方向的信号 Entry Points Pro 指标提供针对任意价格走势的入场交易信号 - 上涨、下跌或横盘(横向)。
          Matrix Arrow Indicator MT5
          Juvenille Emperor Limited
          5 (13)
          矩阵箭头指标 MT5   是一种独特的 10 合 1 趋势,遵循   100% 非重绘多时间框架指标 ,可用于所有符号/工具: 外汇 、 商品 、 加密货币 、 指数 、 股票 。 Matrix Arrow Indicator MT5 将在其早期阶段确定当前趋势,从多达 10 个标准指标中收集信息和数据,它们是: 平均定向运动指数 (ADX) 商品渠道指数 (CCI) 经典 Heiken Ashi 蜡烛 移动平均线 移动平均收敛散度 (MACD) 相对活力指数 (RVI) 相对强弱指数 (RSI) 抛物线SAR 随机振荡器 威廉姆斯的百分比范围 当所有指标给出有效的买入或卖出信号时,相应的箭头将打印在图表上,在下一根蜡烛/柱线开盘时,指示强劲的上升趋势/下降趋势。用户可以选择使用哪些指标,并可以单独调整每个指标的参数。 Matrix Arrow Indicator MT5 仅从选定的指标中收集信息,并仅根据其数据打印箭头。   Matrix Arrow Indicator MT5   还可以为所有新信号发送终端、推送通知或电子邮件警报。无论您是黄牛、日内交易者还是波段交易者, Mat
          Basic Supply Demand Dashboard MT5
          Mehran Sepah Mansoor
          5 (1)
          该仪表盘可根据您对所选符号的交易策略,以剥头皮和长期模式在图表上发现并显示供需区。此外,仪表盘的扫描模式可帮助您一目了然地检查所有需要的符号,不错过任何合适的仓位/ MT4 版本 免费指标: Basic Supply Demand 功能 允许您查看多个货币对的交易机会,为您提供所有货币对的清晰简明视图,并根据其与供需区的接近程度进行排序 可定制设置,从颜色到检测参数,满足您的特定需求 主要输入 Indicator mode : 选择指标模式或具有新功能的面板模式 Symbols : 从 "28 种主要货币对 "或 "选定符号 "中进行选择 Selected Symbols : 您希望监控的符号,用逗号分隔("EURUSD,GBPUSD,XAUUSD")。如果您的经纪商对货币对有后缀或前缀,您必须在以下两个参数中添加(货币对前缀或货币对后缀) Trading Style : 选择剥头皮或长期模式 Allowed Deviation : 该参数允许修改需求或供应区域的精确度(数值越小,精确度越高) Zone   thickness : 通过该参数可以修改需求和供应
          MetaForecast M5
          Vahidreza Heidar Gholami
          5 (2)
          MetaForecast能够根据价格数据中的谐波来预测和可视化任何市场的未来走势。虽然市场不总是可预测的,但如果价格中存在模式,MetaForecast可以尽可能准确地预测未来。与其他类似产品相比,MetaForecast通过分析市场趋势可以生成更精确的结果。 输入参数 Past size (过去的尺寸) 指定MetaForecast用于创建生成未来预测模型的柱数量。该模型以一条黄色线绘制在所选柱上。 Future size (未来的尺寸) 指定应预测的未来柱数量。预测的未来以粉色线表示,并在其上绘制了蓝色回归线。 Degree (程度) 此输入确定了MetaForecast将在市场上进行的分析级别。 Degree 描述  0 对于程度0,建议使用较大的值来设置“过去的尺寸”输入,以覆盖价格中的所有高峰、低谷和细节。  1 (建议的) 对于程度1,MetaForecast可以理解趋势,并通过较小的“过去的尺寸”生成更好的结果。  2 对于程度2,除了趋势,MetaForecast还可以识别反转点。对于大于1的程度,必须使用较高的“细节”和“噪音减少”输入值。  大于2 不建议使用大
          CBT Quantum Maverick 高效的二元期权交易系统 CBT Quantum Maverick 是一款精心设计的高性能二元期权交易系统,专为追求精准、简单和纪律的交易者打造。无需自定义,该系统经过优化,可直接使用并产生高效结果。只需遵循信号操作,稍加练习即可掌握。 主要特点: 信号精准度: 基于当前K线生成下根K线交易信号,无频繁重绘。 市场多样性: 专为二元期权交易设计,兼容多种经纪商和资产类别,适应不同交易偏好。 兼容性: Deriv Synthetic Charts :适用于任何时间框架。 OTC Charts :来自如 Quotex、PocketOption、Binomo、Stockity、IQOption、Exnova、OlympTrade、Deriv、Binolla 和 Homebroker 的经纪商,可导入 MT5(一周内提供免费导入支持,之后需支付服务费用)。 外汇、加密货币和商品市场 :扩展资产利用。 高收益二元资产 :建议使用90%以上的高回报率资产。 额外优势: 全面的交易计划: 提供系统化和纪律性交易的分步支持计划。 高效时间利用: 每天
          AT Forex Indicator MT5
          Marzena Maria Szmit
          5 (5)
          The AT Forex Indicator MT5 is a sophisticated trading tool designed to provide traders with a comprehensive analysis of multiple currency pairs. This powerful indicator simplifies the complex nature of the forex market, making it accessible for both novice and experienced traders. AT Forex Indicator uses advanced algorithms to detect trends, patterns and is an essential tool for traders aiming to enhance their forex trading performance. With its robust features, ease of use, and reliable signal
          Place price Alerts   on  extended  Rectangles   and   Trendlines -  Risk reward indicator mt5 Extend Rectangles & Trendlines to the right edge Mark your supply demand zones with extended rectangle and draw support resistance lines with extended trendline. Find detailed manuals   here .  Find contacts on my   profile . MT4 Rectangle extender indicator will simplify and make it easier for you to analyze markets and stay notified about important events. When you extend rectangle or trendline the a
          Blahtech Market Profile MT5
          Blahtech Limited
          5 (9)
          Was: $249  Now: $99   Market Profile defines a number of day types that can help the trader to determine market behaviour. A key feature is the Value Area, representing the range of price action where 70% of trading took place. Understanding the Value Area can give traders valuable insight into market direction and establish the higher odds trade. It is an excellent addition to any system you may be using. Inspired by Jim Dalton’s book “Mind Over Markets”, this indicator is designed to suit the
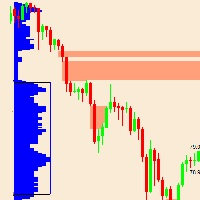
          MT4:  https://www.mql5.com/en/market/product/52715 该指标基于市场概况理论。 单打区到底是什么? 理论:市场概况单打: 轮廓的单张或单张打印或间隙放置在轮廓结构的内部,而不是上边缘或下边缘。 它们以在市场资料上打印的单个TPO表示。 单身人士将我们的注意力吸引到价格快速波动(冲动)的地方。它们使低交易量的节点留有流动性缺口,从而导致市场失衡,并向我们展示了失衡的区域。通常,当市场对意外消息做出反应时,会创建单个。这些报告能够引起极端的失衡,并为买方和卖方的极端情绪反应做好准备。 市场将希望重新访问该区域,并检查这些价格水平是否不是对以这些价格进行交易感兴趣的交易者。这些商人为什么要在那里?因为市场从字面上飞过该地区,只有少数交易者有机会在该地区进行交易。为此,将来可能会填补这些领域。 这些低效的举动往往会被填补,一旦它们被填补,我们就可以寻找交易机会,或者我们也可以在它们被填补之前进入,并使用这些单张图作为目标。 用作支撑/阻力区域,但并非总是要小心。通常,它在趋势日表现良好。请参阅市场概况日:趋势日(策略1-买入-第三张图)和具有
          TrendMaestro5
          Stefano Frisetti
          note: this indicator is for METATRADER4, if you want the version for METATRADER5 this is the link:  https://www.mql5.com/it/market/product/108106 TRENDMAESTRO ver 2.4 TRENDMAESTRO recognizes a new TREND in the bud, he never makes mistakes. The certainty of identifying a new TREND is priceless. DESCRIPTION TRENDMAESTRO identifies a new TREND in the bud, this indicator examines the volatility, volumes and momentum to identify the moment in which there is an explosion of one or more of these data a
          TW Volume Signal Pro MT5 利用先进的人工智能技术和专有的智能算法,使您能够更自信地在黄金市场进行交易,并为您提供独特而无与伦比的交易体验。您是否在寻找黄金市场中的高准确性和卓越交易信号?通过TW Volume Signal Pro MT5,您可以成为专业交易员,并在黄金市场中取得巨大成功。那么,立即免费试用吧! TW Volume Signal Pro MT5的主要特点: 准确可靠的信号:                          信号、止盈(TP)和止损(SL)完全不变,让您能够完全信任它们。 精准的趋势检测:                          TW Volume Signal Pro MT5分析交易量,以准确识别市场趋势变化,帮助您在最佳时机进入交易。 智能提醒:                          闪光提醒和精准的价格指标用于入场、止盈和止损,使您永远不会错过机会。 专业风险管理:                          通过提供三个目标利润区域,您可以管理交易风险并最大化利润。 安
          Berma Bands
          Muhammad Elbermawi
          The Berma Bands (BBs) indicator is a valuable tool for traders seeking to identify and capitalize on market trends. By analyzing the relationship between the price and the BBs, traders can discern whether a market is in a trending or ranging phase. Berma Bands are composed of three distinct lines: the Upper Berma Band, the Middle Berma Band, and the Lower Berma Band. These lines are plotted around the price, creating a visual representation of the price movement relative to the overall trend.
          PipFinite Volume Critical MT5
          Karlo Wilson Vendiola
          5 (3)
          Volume Gives Depth To Price Action! Volume Critical can accurately locate the cheapest areas to place trades. Enter reversals as early as possible to get the best Risk Reward setups! Features Aggressive algorithm that anticipates reversals Volume Classifications Gray Histograms - Normal Volume, average market activity Orange Histogram - Trending Volume, increased market activity Pink Histograms - Overbought Volume, we can wait for further confirmation to sell Blue Histograms - Oversold Condit
          作者的更多信息
          If you are boring in repeatedly changing of trading symbol in every charts when use multiple charts to analyzing prices or trading. This indicator can help you. It will change the symbol of any other charts in the terminal to the same as in the chart you have attached this indicator to it whenever you add new symbol to the chart or click on the button. After finished the job it will sleep quietly waiting for new occasion in order to minimize resource usage of the computor.
          FREE
          Currency Outlook DM30
          Kriengsak Peitaisong
          5 (1)
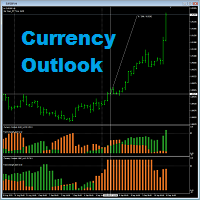
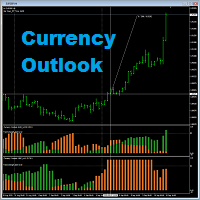
          Currency Outlook   is an indicator that can help us "Trade the right pair in the right direction and at the right time". This indicator analyzes prices of all cross currency pairs of the selected currency and report the result to us in form of double colours histogram diagram.   The maximum height of the histogram diagram of the indicator is 100.   The indicator is exclusively programming for AUD, CAD, CHF, EUR, GBP, JPY, NZD and USD. A feature for calculating trade lot size has been added to th
          FREE
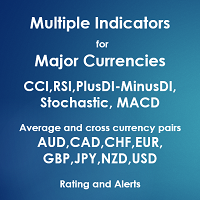
          Multiple Indicators for Major Currencies The purpose of this indicator is to save time to detect more good trading opportunities by scanning all 28 cross currency pairs of AUD, CAD, CHF, EUR, GBP, JPY, NZD and USD in the same time. There are 5 indicators included in this indicator which are CCI, RSI, Stochastic, MACD and the different between plusDI and minusDI of ADX (PlusDI-MinusDI). The indicator can help in determining the following properties of each currency depending on which indicator
          Currency Outlook
          Kriengsak Peitaisong
          Currency Outlook is an indicator that can help us "Trade the right pair in the right direction and at the right time". This indicator analyzes prices of all cross currency pairs of the selected currency and report the result to us in form of double colours histogram diagram. The maximum height of the histogram diagram of the indicator is 100. The indicator is exclusively programming for AUD, CAD, CHF, EUR, GBP, JPY, NZD and USD. It can work in any timeframe in MT4. A feature for calculating trad
          Trading Points
          Kriengsak Peitaisong
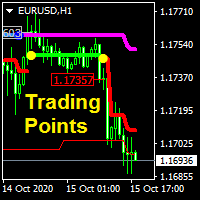
          This indicator analyzes price in both current and larger timeframes to generate trendline, trading signals and take profit level. It can work on any financial instruments or securities. Features: Trend line, trend line is a 2 colors scheme thick line, blue line denotes uptrend and pink line for downtrend. Trading line, trading line is a 2 colors scheme thick line, green line denotes buy signal and red line for sell signal.  Price label,  the label shows the beginning price of new trading signal.
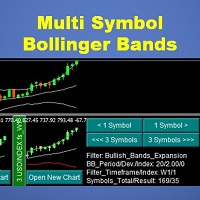
          This indicator will display mini candlestick chart with Bollinger Bands indicator of the symbols that pass a filter criteria in the indicator subwindow from 1 to 10 symbols per subwindow. Feature: Button to scroll 1 symbol, click to scroll the displaying symbols back and forth 1 symbol per click Button to scroll 1 page ,  click to scroll the displaying symbols back and forth 1 page(number of symbols per subwindow) per click Button to open new chart, click to force mt4 terminal to open a new cha
          Basic Trade Buttons is a tool to help you to quickly open and close trades, place take profit and stop loss points by clicking on the button of each job that you preferred. Once you attached this tool to mt4 chart, the program will calculate a trade volume(Lots size) automatically to prepare to send to the trade server when you click on 'Buy' or 'Sell' button. Click on 'TP', 'SL' or 'Close' button to place take profit, stop loss based on the predefined levels or to close all open positions respe
          Basic Trade Buttons
          Kriengsak Peitaisong
          Basic Trade Buttons is a tool to help you to quickly open and close trades, place take profit and stop loss points by clicking on the button of each job that you preferred. Once you attached this tool to mt5 chart, the program will calculate a trade volume(Lots size) automatically to prepare to send to the trade server when you click on 'Buy' or 'Sell' button. Click on 'TP', 'SL' or 'Close' button to place take profit, stop loss based on the predefined levels or to close all open positions respe
          筛选:
          无评论
          回复评论