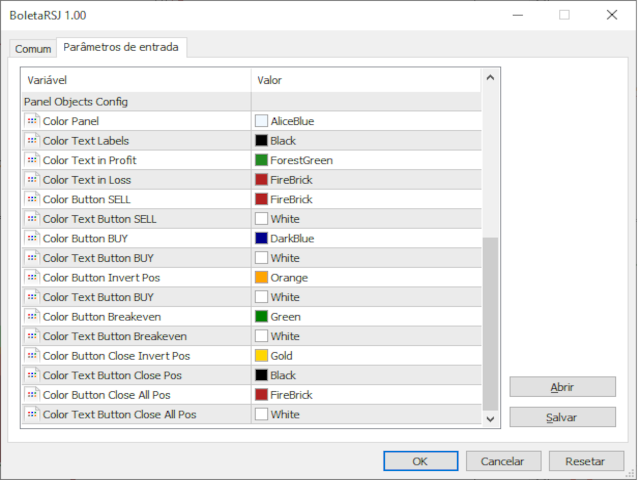
• 概述
  • 评论 (6)
  • 评论

Netting Panel RSJ

4.33


Funcionamento:

O Painel Netting Panel RSJ funciona com qualquer ativo e em qualquer tempo gráfico.

Ele funciona em contas do tipo "Netting" e "Hedge", mas gerencia apenas uma posição por ativo, por isso o nome Netting. Se ele for executado em contas do tipo "Hedge", ele fará o gerenciamento e proteção apenas da posição mais antiga, ou seja, da primeira posição que foi aberta por ele.

Em contas "Netting" quando os botões "SELL" ou "BUY" forem pressionados, ocorrerá incremento ou decremento da posição. No caso do incremento em que ocorra preço médio, indiferente se à favor ou contra a posição atual, o Painel fará automaticamente os ajustes necessários sempre baseado nas configurações atuais feitas pelo o usuário.

Em contas "Hedge" quando os botões "SELL" ou "BUY" forem pressionados, ocorrerá a abertura de novas posições, sem que afete a posição atual que está sendo gerenciada pelas configurações do usuário. Caso a posição atual na conta do tipo "Hedge" seja fechada e existam uma ou mais posições abertas pelo Painel no mesmo ativo, automaticamente o Painel irá gerenciar a posição mais antiga.

O Painel Netting Panel RSJ possui os seguintes recursos:

  • Variação em % do ativo atual com relação ao seu fechamento do dia anterior.
  • Contador regressivo para fechamento do candle atual (baseado no timeframe do gráfico atual).
  • Valores de "BID" e "ASK" do ativo atual.
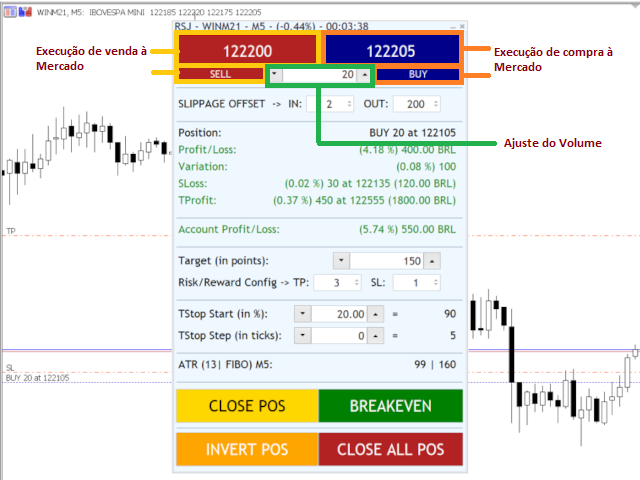
  • Configuração no tamanho do lote aplicado nas operações de compra e venda.
  • Botões de compra e venda à mercado.
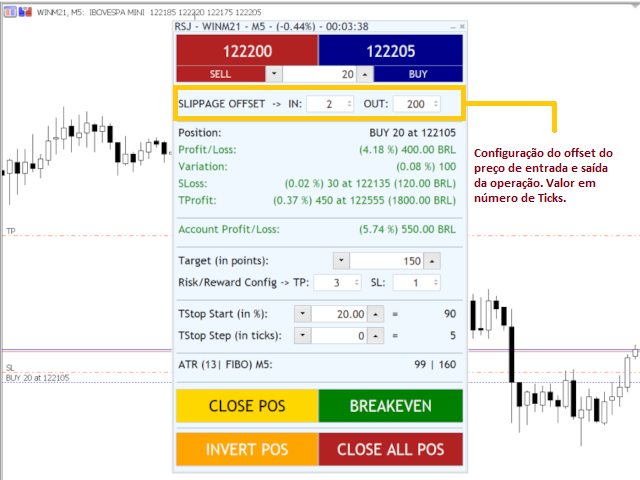
  • Configuração do offset máximo (podendo ser positivo ou negativo) do preço no momento da execução da ordem à mercado.
  • Detalhes da posição atual em gerenciamento (Verde em lucro ou vermelho em prejuízo) :
    • Tipo da posição ("BUY" / "SELL") informando o tamanho em lotes e o preço da mesma.
    • Variação da posição em % com relação ao Saldo da Conta, e valor do lucro ou prejuízo na moeda corrente do ativo.
    • Variação em % e em pontos com relação ao preço de entrada da posição. 
    • Valor do Stop Loss atual com as seguintes informações:
      • Variação em % do preço de entrada.
      • Número de pontos à partir do preço de entrada.
      • Preço de ativação do Stop Loss
      • Valor estimado do lucro ou prejuízo caso seja executado o Stop Loss na moeda corrente do ativo.
    • Valor do Take Profit atual com as seguintes informações :
      • Variação em % do preço de entrada.
      • Número de pontos à partir do preço de entrada.
      • Preço de ativação do Take Profit
      • Valor estimado do lucro caso seja executado o Take Profit na moeda corrente do ativo.
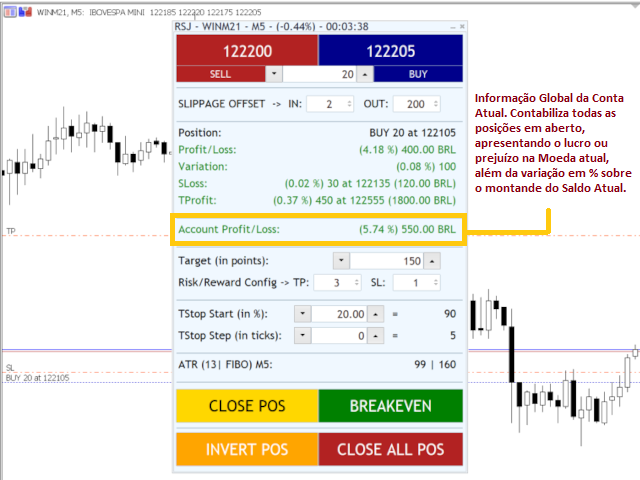
    • Contabilização global do lucro ou prejuízo atual da conta. Soma de todos os resultados das posições em aberto de todos os ativos na conta atual. (Verde em lucro ou vermelho em prejuízo)
    • Configuração do objetivo em pontos do Target da operação à ser aberta.
    • Configuração do Risk & Reward da operação à ser aberta. Esta configuração é um multiplicador a ser aplicado sobre o objetivo configurado no Target. Ela configurará o Take Profit e o Stop Loss.
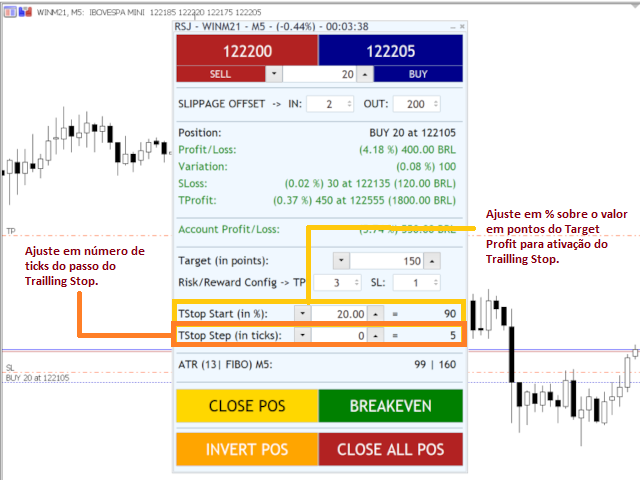
    • Configuração do Trailling Stop em % calculado sobre o Take Profit configurado da operação.
    • Configuração do Step do Trailling Stop caso ele seja ativado.
      • Informação do indicador ATR (Average True Range) automaticamente a cada ciclo de 1 minuto feito sobre o timeframe do gráfico atual e pelo período configurado pelo usuário. Apresenta uma sugestão de ATR FIBO multiplicado pelo fator padrão de Fibonacci.
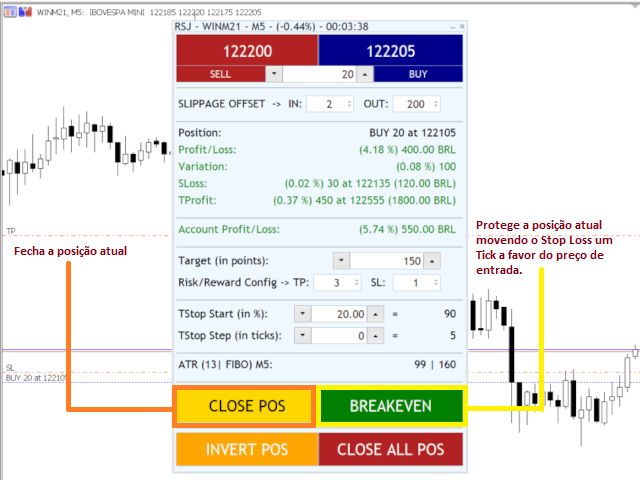
      • Botão de fechamento da posição atual.
      • Botão de proteção da posição atual chamado "Breakeven". Só irá funcionar se o preço estiver pelo menos um TICK distante e positivo na posição atual.
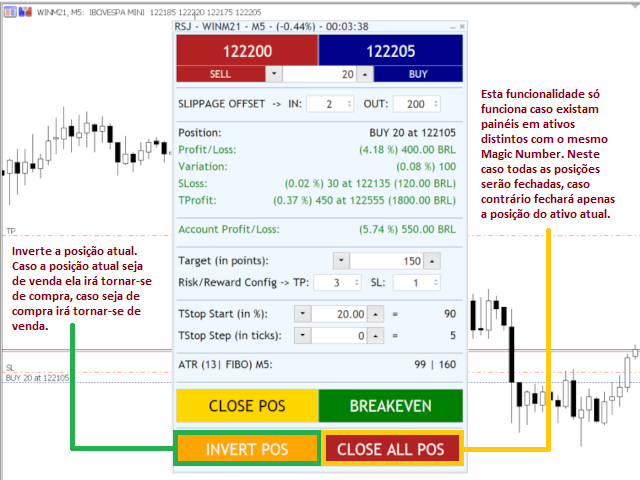
      • Botão de inversão da posição. Transforma um posição vendida em comprada e uma posição comprada em vendida.
      • Botão de fechamento de todas as posições. No caso de contas "Netting" caso o Painel esteja aberto em vários ativos utilizando o mesmo "Magic Number", também chamado de EA ID, fechará todas as posições abertas por este ID. No caso de contas "Hedge" ele fechará todas as posições abertas no ativo atual, mas apenas as que foram abertas pelo Painel.


      评论 6
      Renan Fernandes Souza
      187
      Renan Fernandes Souza 2021.07.15 11:00 
       

      Esta boleta é uma ferramenta essencial para o trader que quer otimizar as suas operações. Parabéns Roberto, ficou muito bom.

      Nitirojn Vichaikasampong
      97
      Nitirojn Vichaikasampong 2021.07.25 07:36 
       

      good

      FLX700
      16
      FLX700 2021.06.05 16:49 
       

      Roberto, em primeiro lugar parabéns pelo excelente trabalho. Sua ferramenta é excelente, na minha opinião ela é indiscutivelmente a melhor entre as gratuitas, eu a avalio com 4.5 de 5. Gostaria de fazer 3 sugestões/críticas para o aprimoramento da mesma. Eu senti falta de um recurso que para mim é o mais importante que é abrir ordens pelo risco e não apenas por lote. Gostaria de ter a opção "RISK %" pois no meu modo trabalhar essa opção é essencial. Outra coisa que sinto muita falta é o stop e gain poderem ser baseados no ATR o que facilita bastante no gerenciamento. E a terceira é apenas um pequeno detalhe. Acho que a boleta poderia ser um pouco mais estreita, pois acho que ela ocupa muito espaço. Espero que esse comentário possa ajudar nos aprimoramentos futuros. No mais, parabéns pelo trabalho. Forte abraço e sucesso!

      推荐产品
      DataFeeder
      Joao Paulo Euko
      Hi you, I need your help! Be my Patron, let's make it possible! https://www.patreon.com/joaopeuko https://github.com/Joaopeuko/Mql5-Python-Integration Esse Expert Advisor copia os dados("symbol,last,bid,ask") dos ativos que foram colocados na lista e só funciona enquanto o mercado esta aberto. Esse EA não é um link DDE ou RTD, as informações não são passadas em tempo real ao excel. O EA tem um delay de 30 segundos e o Excel tem um delay de 1 minuto. A vantagem desse EA é que ele dispen
      FREE
      PANEL OF TOPOS AND HISTORICAL BACKGROUNDS   This is a panel that does not open orders only manages all Symbols and calculates the tops and bottoms and presents the calculation in relation to the top and bottom in 5 Years, 2 Months and 1 Week. It is ideal for filtering the pairs that are in the good regions to operate. You can filter the range and choose whether to consider the body or shadow of the candle in the monthly. Good luck...
      FREE
      General Clock
      Fernando Lahude Ritter
      A Simple clock that on the left side "Time" shows r espectively the TimeCurrent, followed beneath by the TimeLocal. On the right hand side we have the remaining minutes and seconds of the current candle. TimeLocal is synced every 500 miliseconds however, the TimeCurrent and the time left on the candle are synced every tick, so this can lead to inconsistencies on the readings so keep that in mind. This indicator have no plots or buffers so it cannot be used in any time based EA.
      FREE
      Steady Bands3
      Roberto Tavares
      Equidistant bands indicator with calculated moving average, allows you to configure the band size and can be used freely as an entry / exit indicator. Buffer 0 = price, buffer 1 = upper band, buffer 2 = lower band. you can also configure the periods of moving averages used in the calculations and also the shift to previous bars in addition to the price that can CLOSE (default) or OPEN. Excellent for fast daily moving pairs and frequent returns.
      FREE
      Graphic Alignment Context
      Ricardo Alexandre Laurentino
      The Graphic Alignment Context (GAC) Technical Indicator measures the vertical difference of the simple average price of a financial instrument in the context of three different timeframes determined by a defined number of bars or candles (periods) to determine the strength of the buy or sell trend. sale. Ascending average prices indicate Buying strength (1), Descending average prices indicate Selling strength (-1) and any scenario different from the previous two conditions indicates Neutrality
      FREE
      Donchian Pro
      Paulo Henrique Faquineli Garcia
      5 (2)
      The Donchian Channel Channels are among the most popular tools of technical analysis, as they visually convey to the analyst the limits within which most price movement tends to occur. Channel users know that valuable information can be obtained at any time, whether prices are in the central region of a band or close to one of the border lines. One of the best known techniques to explore these concepts is Bollinger Bands. However, John Bollinger was not the only one to research the applicatio
      FREE
      Simple and easy-to-use trading panel. Replaces the standard Meta Trader 5 panel. This new panel allows you to add stop loss and take profit (in points). It also allows you to click and drag it to any place on the screen, making it easier to view and operate. Choose the color of the panel, its initial position, and whether you want to disable the standard MT5 panel. When you close Trade Panel R3, the standard MT5 panel will be restored.
      FREE
      FT ADX Color Candles
      FELIPE MISAEL MORAES KRUGER
      5 (4)
      Trading can be quite tiring when you need to look at several things at the same time. Format of candles, supports, resistances, schedules, news and indicators. This tool aims to facilitate the analysis of the ADX indicator. It colors the candles based on the levels of the indicator and the DI lines. The period, the limit of the indicator and the colors of the candles are customizable. You can also place a visual aid on the lower right side of the graph to view the values of ADX, DI + and
      FREE
      Market tops are characterized by Volume Climax Up bars, High Volume Churn and Low Volume Up bars (also called Testing). Market bottoms are characterized by Volume Climax Down bars, High Volume Churn and Low Volume Down bars (Testing). Pullbacks, in either up or down trends, are similar to market topping or bottoming patterns, but shorter in duration and with simpler volume patterns.
      FREE
      Strong movement levels
      Nikolay Mitrofanov
      5 (2)
      Looks for strong price movements and draws levels upon their completion. You determine the strength of the movement yourself by specifying in the settings the number of points and the number of candles of the same color in a row in one direction. There are 2 types of building in the settings: extrenum - high / low close - close price You can also adjust the number of displayed levels and the number of candles for calculations. By default, the settings indicate 5 levels for 360 candles.
      FREE
      LT Price Change
      Thiago Duarte
      4.88 (17)
      This is an informant indicator, very simple. It shows how much the price has chanded in percentage in certain period (month, week, day and actual period). It is discreet and small, does not visually posslute the chart. If your MT is not on portuguese idiom the indicator will automatically change to english. Check out our most complete tool for the market, the Trade Panel:  https://www.mql5.com/en/market/product/42658 If you have any suggestion or find any bug, please, contact us. Enjoy! This i
      FREE
      Market Momentum
      Flavio Javier Jarabeck
      4.2 (5)
      The Market Momentum indicator is based on the Volume Zone Oscillator (VZO), presented by Waleed Aly Khalil in the 2009 edition of the International Federation of Technical Analysts journal, and presents a fresh view of this market valuable data that is oftenly misunderstood and neglected: VOLUME. With this new approach of "seeing" Volume data, traders can infer more properly market behavior and increase their odds in a winning trade. "The VZO is a leading volume oscillator; its basic usefulnes
      FREE
      Nexus Breakout line
      Mohammed Kaddour
      INTRODUCTION : The breakout strength meter is a trading tool that is used to identify which currencies are the strongest to breakout, and which currencies are the weakest to breakout. The settings for the indicator are easy, and if you cannot find the settings, please leave a comment The tools are completely free to use Please, if you like the indicator, please leave a comment and rate the indicator in order to develop it
      FREE
      Didi Index TSB
      Sonia Tait
      4 (2)
      O indicador criado por Didi Aguiar, o mestre das Agulhadas! O padrão do indicador é o cruzamento de três médias móveis simples. Média rápida, período 3. Média normalizada, período 8. Média lenta, período 20. Quando as três médias se cruzam próximas o suficiente, acontece a agulhada! Pela posição das médias é possível identificar: Agulhada de compra, agulhada de venda, ponto falso e beijo da mulher aranha. Quer saber mais? Procure pelo site dos robôs oficiais da Dojistar: tradesystembots.co
      FREE
      Colored Adaptive Moving Average AMA
      Flavio Javier Jarabeck
      4.86 (7)
      If you like to use traditional Moving Averages (like SMAs and EMAs) to provide your trades for dynamic levels of Support and Resistance, you will love the Adaptive Moving Average (AMA). Created in 1995 by Perry Kaufman and presented to the world in his book " Smarter   Trading :  Improving   Performance   in   Changing   Markets ", the Adaptive Moving Average (also known as KAMA - Kaufman Adaptive Moving Average) has the goal to be the perfect companion for following a trend without noise, but s
      FREE
      Activity Power
      Zoltan Nemet
      5 (4)
      Multi time frame, multy currency special swing volume indicator with engulfing waves too. Simpler to use compare to Weis Wave. User don't need to adjust wave size. Just use of the basic or the upper time frames. As a multi time frame indikator user can do  very complex time frame analysyses. As well as a multy currency indicator one can make market sector-segment analysyses. Use with Wckoff principles.
      FREE
      Cybertrade Keltner Channels
      Emanuel Andriato
      4.75 (4)
      Cybertrade Keltner Channels - MT5 Created by Chester Keltner, this is a volatility indicator used by technical analysis. It is possible to follow the trend of financial asset prices and generate support and resistance patterns. In addition, envelopes are a way of tracking volatility in order to identify opportunities to buy and sell these assets. It works on periods longer than the period visible on the chart. All values ​​are available in the form of buffers to simplify possible automations.
      FREE
      Stop Loss with Profit Free Version*. Complete Version here. This utility / expert for MetaTrader 5 modifies the stop loss of all your operations dynamically and automatically to ensure the minimum benefits you want, and be able to operate with or without Take Profit. Maximize your benefits, by being able to trade with Unlimited Take Profit. You will ensure the number of minimum points you want to earn in each operation and the stop loss will be adjusted as long as the benefit of the oper
      FREE
      QuantumAlert Stoch Navigator is a free indicator available for MT4/MT5 platforms, its work is to provide "alerts" when the market is inside "overbought and oversold" regions in the form of "buy or sell" signals. This indicator comes with many customization options mentioned in the parameter section below, user can customise these parameters as needful. Join our   MQL5 group , where we share important news and updates. You are also welcome to join our private channel as well, contact me for the p
      FREE
      Expected Range is a great tool for understanding the possible price deviation from daily open price.  This Indicator can be interpreted as follows --> I want to identify a price level with an "x%" probability of the price revisiting it.  Then you choose these "x%" price levels and the indicator is gonna find them for you.  So for example, if you select value of 15, it means that the indicator is gonna find you a price level which has a 15% chance of price revisiting it.  You can choose up
      FREE
      DMC Average Volume
      Deibson Carvalho
      516/5000 Average volume indicator to calculate the average volume for a given period. Useful as a filter to measure the strength of a trend, or false breaks in support or resistance. It does not give a signal to buy or sell, it only acts as a filter to avoid entering into transactions with a drop in volume, or below-average volume, which may indicate disinterest in trading at the price level. It has only the parameters of period, method of calculating the average and type of volume.
      FREE
      Demo Version of Strategy Manager Plus ! This Demo is a simply view of the Dashboard with the followings strategy :    - if SMA 6 is upper than SMA 18 --> Blue color    - if SMA 6 is lower than SMA 18 --> Red Color No need of the external GUI, Load configuration is not available, no manual trading is available. Visit  https://www.mql5.com/en/market/product/46420  for full version !
      FREE
      Free automatic Fibonacci is an indicator that automatically plots a Fibonacci retracement based on the number of bars you select on the BarsToScan setting in the indicator. The Fibonacci is automatically updated in real time as new highest and lowest values appears amongst the selected bars. You can select which level values to be displayed in the indicator settings. You can also select the color of the levels thus enabling the trader to be able to attach the indicator several times with differe
      FREE
      MT4 版本: https://www.mql5.com/en/market/product/121289 MT5 版本: https://www.mql5.com/en/market/product/121290 “Logo”脚本旨在在 MetaTrader 5 (MT5) 中的交易图表上显示自定义徽标或图像作为背景。此脚本允许交易者使用徽标或任何其他所需图像个性化他们的图表。 工作原理: 图像准备: 首先选择您想要在图表上显示为徽标的图像。 使用任何图像编辑软件将图像转换为位图文件格式 (.bmp)。 保存图像: 转换后,将 .bmp 图像文件保存到 MT5 安装中的以下目录: \MQL5\Images\ (这通常位于程序文件中的 MetaTrader 5 文件夹中。) 脚本配置: 在 MetaEditor 中打开“Logo”脚本。 找到定义 mylogo 的行。 将 mylogo 的值替换为您的图像文件的名称,包括 .bmp 扩展名(例如,“mylogo.bmp”)。 应用脚本: 在 MetaEditor 中保存并
      FREE
      VWAP Simple
      Deibson Carvalho
      4.22 (27)
      The Volume Weighted Average Price is similar to a moving average, except volume is included to weight the average price over a period.    Volume-Weighted Average Price [VWAP] is a dynamic, weighted average designed to more accurately reflect  a security’s true average price over a given period . Mathematically, VWAP is the summation of money (i.e., Volume x Price) transacted divided by the total volume over any time horizon, typically from market open to market close. VWAP reflects the capital
      FREE
      Color Trend
      Bruno Goncalves Mascarenhas
      Combining the best of Price Action , Directional Movement , and Divergence / Convergence analysis, the Candle Color Trend is the easy and reliable way to identify the direction of the trend. The indicator automatically paints the candles according to the premise that the upward trend is defined by prices that form a series of ascending tops and bottoms. On the other hand, the downward trend is defined by prices that form a series of descending tops and bottoms. Color Trend is certainly one
      FREE
      This indicator measures the largest distance between a price (high or low) and a moving average. It also shows the average distance above and below the moving average. It may come in handy for strategies that open reverse positions as price moves away from a moving average within a certain range, awaiting it to return so the position can be closed. It just works on any symbol and timeframe. Parameters: Moving average period : Period for moving average calculation. Moving average method : You can
      Coral Indi
      Dinh Duong Luong
      Coral trend is   a trend-following indicator that is widely popular among FOREX traders . It is usually used as a confluence with other indicators. It uses combinations of moving averages with complex smoothing formulas! It has two configurable parameters: Coefficient   - smoothing ratio (*) Applied price Calculation: Coral = (-0.064) * B6 + 0.672 * B5 - 2.352 * B4 + 2.744 * B3
      FREE
      Supports And Resistances Lines
      Francisco Gomes Da Silva
      4.74 (34)
      支撑和阻力区指标 MT5 此指标知道如何自动识别顶部和底部。 此支撑和阻力指标根据顶部和底部创建支撑线和阻力线。 如何制作支撑线和阻力线。 这是制作自动支撑线和阻力线的指标。 如何使用指标找到支撑位。 此指标自动找到顶部和底部。 每次“之字折线”自动创建底部或使新底部低于前一个底部时,指标都会自动创建支撑线,因此指标会自动在屏幕上绘制自动支撑线。 如何创建阻力线。 指标自动创建阻力线的方式与创建支撑位的方式相同,只要“之字折线”形成新的顶部或高于前一个顶部的顶部,因此指标会自动创建新的阻力,因此您不会必须担心顶部和底部水平在哪里。 此指标是交易者用支撑和阻力标记图表的简便方法。 如何标记顶部。 顶部由“ZigZag”自动设置,然后在该级别绘制一条阻力线以标记该顶部。 如何标记底部 “之字折线”也会自动设置底部,然后创建一条支撑线来标记该底部。 支撑和阻力区 MT5 顶部和底部区域 底部区域 您可以将支撑区域的刻度宽度设置为占据整个支撑区域,而不仅仅是在底部画一条线 热门区域 以与定义阻力区相同的方式,使用刻度来增加顶部区域线的宽度 顶部和底部的范围 该指标的主要功能是轻松识别图表中的空
      FREE
      Trendline mt5 indicator
      David Muriithi
      3 (1)
      Are you tired of drawing trendlines every time you're analyzing charts? Or perhaps you would like more consistency in your technical analysis. Then this is for you. This indicator will draw trend lines automatically when dropped on a chart. How it works Works similar to standard deviation channel found on mt4 and mt5. It has 2 parameters: 1. Starting Bar 2. Number of bars for calculation The   starting bar   is the bar which drawing of the trend lines will begin, while the   number of bars for c
      FREE
      该产品的买家也购买
      Trade Assistant MT5
      Evgeniy Kravchenko
      4.38 (164)
      它有助于计算每笔交易的风险,容易安装新的订单,具有部分关闭功能的订单管理, 7 种类型的追踪止损和其他有用的功能。   注意,该应用程序在策略测试器中不起作用。 您可以在描述页面下载演示版  Manual, Description, Download demo 线条功能  - 在图表上显示开仓线、止损线、止盈线。 有了这个功能,就可以很容易地设置一个新的订单,并在开仓前看到它的附加特性。   风险管理  - 风险计算功能在考虑到设定的风险和止损单的大小的情况下,计算新订单的成交量。它允许你设置任何大小的止损,同时观察设定的风险。 批量计算按钮 - 启用 / 禁用风险计算。 在 " 风险 " 一栏中设置必要的风险值,从 0 到 100 的百分比或存款的货币。 在 " 设置 " 选项卡上选择风险计算的变量: $ 货币, % 余额, % 资产, % 自由保证金, % 自定义, %AB 前一天, %AB 前一周, %AB 前一个月。   R/TP 和 R/SL - 设置止盈和止损的关系。 这允许你设置相对于损失的利润大小。 例如, 1 : 1 - 这决定了 TP = SL 的大小。 2 :
      您认为在价格可以瞬间变化的市场中,下单应该尽可能简单吗? 在 Metatrader 中,每次您要开单时,您都必须打开一个窗口,您可以在其中输入开盘价、止损和止盈以及交易规模。 在金融市场交易中,资本管理对于维持您的初始存款并使其倍增至关重要。 因此,当您想下订单时,您可能想知道应该开多大的交易? 在这单笔交易中,您应该承担多少百分比的存款? 您可以从这笔交易中获利多少,利润风险比是多少? 在您设置交易规模之前,您需要进行必要的计算,以获得交易规模应该是多少的问题的答案。 想象一下,您有一个工具可以自动完成所有这些工作。 您打开图表,进行市场分析并用水平线标记入场点、防御点(止损)和目标(止盈),最后您定义风险水平,例如 作为可用资本的百分比,您可以在此交易中承担,此时程序提供: 定义风险和止损规模的可接受交易规模 以点数、点数和账户货币计的止损和获利值 风险回报率 现在剩下的就是点击面板上的相应按钮来打开交易。 如果您是黄牛,需要在不设置防御或目标的情况下快速打开和关闭交易,那么您可以在交易管理器面板中轻松掌握一切,您可以在其中定义固定订单参数并通过单击“购买”或 “卖出”按钮。 关闭
      TradePanel MT5
      Alfiya Fazylova
      4.85 (114)
      交易面板是一个多功能的交易助手。 该应用程序包含 50 多个手动交易功能,并允许您自动执行大多数交易操作。 购买之前,您可以在模拟帐户上测试演示版本。 演示 此处 。 完整说明 此处 。 贸易。 让您一键执行基本交易操作: 开立挂单和开仓。 打开订单网格。 平仓挂单和持仓。 仓位反转(平仓买入并开仓卖出,或平仓卖出并开仓买入)。 锁定仓位(通过开立相反仓位使卖出和买入仓位的交易量相等)。 对所有仓位进行部分平仓。 将所有头寸的止盈和/或止损设置为同一水平。 将所有仓位的止损设置为盈亏平衡水平。 开仓订单和仓位时,您可以: 根据既定风险自动计算订单量。 一键打开多个订单。 将计算出的交易量分配给多个订单。 使用面板创建的线条和标记在图表上可视化未来订单的交易水平位置。 开仓时,设置最大点差限制。 使用止盈规模与止损规模的自动比率。 使用虚拟止损和止盈。 将当前点差添加到止损和止盈。 使用 ATR 指标计算止盈和止损。 设置待处理订单的到期日期。 使用挂单跟踪(挂单自动移动到价格后面指定的距离)。 平仓订单和平仓时,您可以: 一键按订单或仓位类型关闭。 只需点击一下,即可仅平仓盈利或无利可
      Local Trade Copier EA MT5
      Juvenille Emperor Limited
      4.99 (68)
      通过 Local Trade Copier EA MT5 获得非常快速的交易复制体验。它的简单1分钟设置,使您可以在同一台Windows计算机或Windows VPS上在多个MetaTrader终端之间复制交易,具有闪电般快速的复制速度,低于0.5秒。 无论您是初学者还是专业交易者, Local Trade Copier EA MT5 都提供了广泛的选项,可根据您的特定需求进行自定义。对于任何希望增加利润潜力的人来说,这都是终极解决方案。 今天就尝试一下,看看为什么它是市场上最快、最简单的贸易复印机! 提示: 您可以在您的模拟账户中下载并试用 Local Trade Copier EA MT5 模拟版: 这里 将下载的免费演示文件粘贴到您的 MT5 >> 文件 >> 打开数据文件夹 >> MQL5 >> 专家文件夹并重新启动您的终端。  免费演示版本每次可在 4 小时内发挥全部功能,仅限演示帐户。 要重置试用期,请转至 MT5 >> 工具 >> 全局变量 >> Control + A >> 删除。 请仅在非关键模拟账户上执行此操作,不要在挑战道具公司账户中执行此操作。 Loc
      将信号从您所属的任何渠道(包括私人和受限渠道)直接复制到您的 MT5。 该工具在设计时充分考虑了用户的需求,同时提供了管理和监控交易所需的许多功能。 该产品采用易于使用且具有视觉吸引力的图形界面。 自定义您的设置并在几分钟内开始使用该产品! 用户指南 + 演示  |   MT4版本  |   不和谐版本 如果您想尝试演示,请参阅用户指南。 Telegram To MT5 接收器在策略测试器中不起作用! Telegram 至 MT5 功能 一次复制多个通道的信号 从私人和受限频道复制信号 不需要机器人令牌或聊天 ID(如果出于某种原因需要,您仍然可以使用这些) 使用风险百分比或固定手数进行交易 排除特定符号 选择复制所有信号或自定义要复制的信号 配置单词和短语以识别所有信号(默认值应适用于 99% 的信号提供商) 配置时间和日期设置以仅在需要时复制信号 设置一次打开的最大交易量 交易和头寸管理 使用信号或自动设置的管理 通过设置每月、每周、每天、每小时或每分钟的最大交易次数,停止过度交易和报复性交易。 支持市价订单和挂单 每日最大利润目标(以美元为单位)以确保头寸并停止过度交易
      The product will copy all telegram signal to MT5 ( which you are member) , also it can work as remote copier.  Easy to set up, copy order instant, can work with almost signal formats, image signal,  s upport to translate other language to English Work with all type of channel or group, even channel have "Restrict Saving Content", work with  multi channel, multi MT5 Work as remote copier: with signal have ticket number, it will copy exactly via ticket number. Support to backtest signal. How to s
      Trade Dashboard MT5
      Fatemeh Ameri
      4.96 (48)
      疲于复杂的订单下达和手动计算?Trade Dashboard 是您的解决方案。凭借其用户友好的界面,订单下达变得轻而易举,只需点击一下,您就可以开设交易、设置止损和止盈水平、管理交易手数,并计算风险回报比,让您只需专注于您的策略。告别手动计算,使用 Trade Dashboard 简化您的交易体验。 立即下载演示版本 。 您可以在这里找到仪表盘功能和特性的详细信息 。 加入 Telegram 频道 。 购买后请给我发消息以获取支持。如果您需要添加更多功能,可以在产品的评论区留下您的想法,我愿意听取任何建议,希望您能在使用我的产品时获得最佳体验 。 这是 MT4 版本。 风险管理:使用 Trade Dashboard,可以将您的风险设置为账户余额或权益的百分比,或将风险设置为总金额。在图表上直观地定义您的止损,让工具准确计算每个货币对的适当手数。该工具还可以根据您期望的风险回报比自动设置止盈水平。它甚至可以在手数计算中涵盖佣金和点差费用。此外,您的止损和止盈可以转变为虚拟水平,隐藏于经纪商。通过 Trade Dashboard 的高级风险管理功能,掌控风险,保护您的资本。
      Exp COPYLOT CLIENT for MT5
      Vladislav Andruschenko
      4 (22)
      MT5 交易复印机是 МetaТrader 5 平台的交易复印机 。 它复制外汇交易 之间   任何账户 MT5   -   MT5, MT4   -   MT5 对于 COPYLOT MT5 版本(或 MT4   - MT4 MT5   -   MT4 对于 COPYLOT MT4 版本) 值得信赖的复印机! MT4版本 详细描述   +DEMO +PDF 如何购买 如何安装     如何获取日志文件     如何测试和优化     Expforex 的所有产品 您还可以在 МТ4 终端 (   МТ4   -   МТ4, МТ5   -   МТ4   ) 中 复制交易: COPYLOT CLIENT for MT4 此版本包括在终端 МТ5   -   МТ5, МТ4   -   МТ5 之间 。 交易复制器用于在 2/3/10 终端之间复制交易/头寸。 支持从模拟账户和投资账户复制。 该程序可以在多个终端绑定上运行。 使用它作为您在一个账户上交易的各种投资者账户的交易的同步器, - COPYLOT 会将您的交易复制到其他终端。 从 多个 终端复制到一个; 从一
      YuClusters
      Yury Kulikov
      4.93 (41)
      Attention: You can view the program operation in the free version  YuClusters DEMO .  YuClusters is a professional market analysis system. The trader has unique opportunities to analyze the flow of orders, trade volumes, price movements using various charts, profiles, indicators, and graphical objects. YuClusters operates on data based on Time&Sales or ticks information, depending on what is available in the quotes of a financial instrument. YuClusters allows you to build graphs by combining da
      -25% discount ($199 -> $149) Advanced trading tool: One click smart orders that execute under your conditions Developed by trader for trading community:  position size calculator (lot size), open position after price action, strategy builder, set and forget trading, mobile notifications... Risk Management -  Risk percentage position size calculator, gain percentage, target risk reward ratio, spread and commissions are included in calculations 7 Advanced order types  - Set and forget trading w
      Attention: this is a multicurrency EA, which trades by several pairs from one chart!  Therefore, in order to avoid duplicate trades, it is necessary to attach EA only to one chart, ---> all trading in all pairs is conducted only from one chart! we can trade simultaneously in three different pairs, as by default (EURUSD + GBPUSD + AUDUSD), which take into account the correlation when entering the market for all three; we can trade only EURUSD (or any currency pair) and at the same time take into
      MT5 to Telegram Signal Provider 是一个易于使用且完全可自定义的工具,它允许向 Telegram 的聊天室、频道或群组发送 指定 的信号,将您的账户变为一个 信号提供商 。 与大多数竞争产品不同,它不使用 DLL 导入。 [ 演示 ] [ 手册 ] [ MT4 版本 ] [ Discord 版本 ] [ Telegram 频道 ] 设置 提供了逐步的 用户指南 。 不需要了解 Telegram API;开发者提供了您所需的一切。 关键特性 能够自定义发送给订阅者的订单详情 您可以创建分层的订阅模型,例如铜、银、金。其中金订阅获得所有信号等。 通过 id、符号或评论过滤订单 包括执行订单的图表截图 在发送的截图上绘制已关闭的订单,以便额外核实 延迟发送新订单消息的可能性,以便在发送前对位置进行调整 订单详情完全透明: 新的市场订单*带截图 订单修改(止损、获利) 已关闭的订单*带截图 部分关闭的订单** 新的挂单 修改的挂单(进场价格) 挂单激活(作为新的市场订单附加) 已删除的挂单 历史订单报告*** 可自定义的评论 注意: *
      Set price targets, and leave everything else to HINN Lazy Trader! This tool is designed for automatic position sizing from specified levels to designated targets. Using a VPS is recommended (*). The demo version   limited in functionality, be sure to watch this video before using -->  https://youtu.be/geLQ6dUzAr8 A community for users, product discussion, update news, and first line of support are organized in a free Discord: https://discord.gg/zFhEZc7QDQ Use Webmoney For payments in cryptocu
      交易管理器可帮助您快速进入和退出交易,同时自动计算风险。 包括帮助您防止过度交易、报复性交易和情绪化交易的功能。 交易可以自动管理,账户绩效指标可以在图表中可视化。 这些功能使该面板成为所有手动交易者的理想选择,并有助于增强 MetaTrader 5 平台。多语言支持。 MT4版本  |  用户指南+演示 交易经理在策略测试器中不起作用。 如需演示,请参阅用户指南 风险管理 根据%或$自动调整风险 可选择使用固定手数或根据交易量和点自动计算手数 使用 RR、点数或价格设置盈亏平衡止损 追踪止损设置 最大每日损失百分比,在达到目标时自动平仓所有交易。 保护账户免遭过多提款并阻止您过度交易 最大每日损失(以美元为单位)在达到目标时自动关闭所有交易。 保护账户免遭过多提款并阻止您过度交易 一键实现所有交易的盈亏平衡 自动计算从手机/电话发送的交易的风险 OCO 在设置中可用 交易和头寸管理 通过设置每月、每周、每天、每小时或每分钟的最大交易次数,停止过度交易和报复性交易。 高级挂单管理。 调整何时关闭挂单的规则 追踪挂单 支持市价订单和挂单 每日最大利润目标(以美元为单位)以确保头寸并停
      Trade Assistant 38 in 1
      Makarii Gubaydullin
      4.89 (18)
      多功能工具:超过65个功能,其中包括:手数计算,价格行为,盈亏比,交易管理,供需区域。 演示版   |   用户手册   |  MT5版 任何问题 / 改进意见 / 如果发生了故障或错误    都可以联系我 该实用程序在策略测试器中不起作用:您可以在此处下载 演示版来测 试产品。 Trading functions require permitted auto trading (including on the broker's side) 简化,加快并且自动化你的交易过程。利用这款工具的控制功能就能增强普通交易端的执行力。 建立一笔新的交易:手数 / 风险 / 盈亏计算 1. 手数计算工具 (基于风险规模的交易量计算) 2. 风险计算工具 (基于手数大小的风险额计算) 3. 盈亏比 4. 订单的激活和触发,买入或卖出限价/买入或卖出止损 5. 虚拟的止损/止盈 (隐藏的止损,止盈:交易商不可见) 6.  智能的止损/入场点:当价格柱在收盘时已超越了才入场 (避免无效触发) 7. 隐藏掉挂单 (虚拟的订单) 8. 预订挂单:在市场关闭的时候你也可以下挂单 (适合周末
      Cerberus Equity Watcher
      Samuel Bandi Roccatello
      5 (2)
      Cerberus the Equity Watcher 是一种风险管理工具,可以持续监控您的账户资产并避免因错误的 EA 或您的情绪行为(如果您是全权交易者)导致的重大亏损。对于依赖 EA 的系统交易者来说,它非常有用,EA 可能包含错误,或者在意外的市场条件下可能表现不佳。 Cerberus 允许您设置最小净值和(可选)最大值,如果达到其中任何一个,则所有头寸都被平仓,所有挂单被关闭,所有 EA 被“杀死”。在展平所有位置后,将向用户手机发送通知,并在屏幕上显示一条清晰的消息。在“扁平化”之后, Cerberus 继续关注股权价值,并继续扼杀任何进一步的交易尝试,直到它被重新初始化。 Cerberus 执行的任何操作都清楚地显示在屏幕上,报告在“专家顾问”选项卡上,并向用户发送通知。为了避免用户错误,对用户输入的输入值和自动交易的当前状态进行了多次检查。 ****** 特征 最小和最大权益值可以以账户货币或初始权益的百分比设置 最大净值是可选的 如果达到最小/最大净值,则所有 EA 将独立于它们交易的符号被终止 第一次压扁后几秒钟进行双重检查 Cerberus 在拉平后也继续监控股权
      Trade copier MT5
      Alfiya Fazylova
      4.44 (25)
      Trade Copier 是一种专业实用程序,旨在复制和同步交易账户之间的交易。 复制发生从供应商的帐户/终端到收件人的帐户/终端,安装在同一台计算机或 vps 上。 在购买之前,您可以在演示帐户上测试演示版本。 演示 这里 。 完整说明 这里 。 主要功能和优点: 支持复制MT5>MT5、MT4>MT5、MT5>MT4,包括МТ5 netting账户。 供应商和收件人模式在同一产品中实现。 简单直观的界面,允许您直接从图表中实时控制复制。 连接中断或终端重新启动时不会丢失设置和位置。 允许您选择要复制的符号,也可以替换接收者的符号,例如 EURUSD> USDJPY。 支持回拷贝。 能够仅复制某些订单。 允许您设置开仓交易价格的最大差异和最大时间延迟。 正确复制部分订单关闭的执行。 计算复制手数的几种方法。 同步止盈和止损。有几种方法可以计算它们的位置。 支持通过执行在“Market account”上工作,其中 SL / TP 仅在开仓后设置。 如何使用简单的设置复制交易 将供应商终端和接收终端安装在同一台计算机或 VPS 上。 在供应商终端上以“Master”模式安装复印机,然后
      News Filter Tool
      Apex Software Ltd
      5 (1)
      提升您的交易表现,通过新闻事件洞察 在快節奏的交易世界中,新聞事件可能會對市場價格產生重大影響。了解這些事件如何影響價格變動對於在波動時期管理交易至關重要。新聞工具 EA 旨在提供對歷史和即將發生的新聞事件的見解,幫助您做出明智的交易決策。 此EA无法在策略测试器中运行。 用户指南 主要功能: 历史影响分析 了解价格如何响应特定过去新闻事件的波动。分析事件是否通常伴随着看涨或看跌趋势,并查看平均价格影响,以点数或百分比形式,随时间框架的调整而变化。可视化图表帮助您观察新闻事件与价格反应的关系,从而获得更深入的市场见解。 实时新闻集成 在MT5中直接接收即将发生的新闻事件的实时更新。为特定事件或重要性级别设置提醒,并按货币和相关性筛选事件,以关注对您的交易策略至关重要的内容。 自动化EA管理 此工具帮助您在新闻事件期间管理专家顾问(EA),允许您在重大新闻事件之前暂停EA,并在事件后无缝重新应用。您可以自定义时间设置,确保EA恢复时保持相同的参数,避免中断。 用户友好界面 使用符号选择器轻松切换分析不同的市场工具。新闻事件以颜色编码的重要性级别和国家旗帜标记在图表上,便于快速识别
      The News Filter MT5
      Leolouiski Gan
      4.6 (10)
      这个产品在新闻时间过滤所有的专家顾问和手动图表,因此您不必担心突然的价格波动会破坏您的手动交易设置或其他专家顾问输入的交易。此产品还带有完整的订单管理系统,可在任何新闻发布前处理您的持仓和挂单。一旦您购买了   The News Filter ,您将不再需要依赖以后的专家顾问内置的新闻过滤器,因为这个产品可以从此过滤它们所有。 新闻选择 新闻来源于Forex Factory的经济日历。 选择可以基于任何一种货币,如USD,EUR,GBP,JPY,AUD,CAD,CHF,NZD和CNY等。 选择也可以基于关键识别,例如Non-Farm (NFP),FOMC,CPI等。 能够选择新闻影响级别的筛选,从低、中、到高影响。 自动模式只选择与图表相关的新闻。 新闻来源每小时自动刷新,以确保最新的新闻数据。 为每个新闻影响级别提供单独的输入,以确定您要过滤掉的新闻发布前后的分钟数。 订单管理选项 在新闻发布前关闭未平仓头寸的选项,并在新闻发布后恢复它们。 在新闻发布前删除挂单的选项,并在新闻发布后恢复它们。 在新闻发布前移除止损和止盈水平的选项,并在新闻发布后恢复它们。 在新闻发布前移动
      -25% discount ($149 -> $111) Everything for chart Technical Analysis indicator mt5 in one tool Draw your supply demand zone with rectangle and support resistance with trendline and get alerts to mobile phone or email alert -  Risk reward indicator mt5 Video tutorials, manuals, DEMO download   here .   Find contacts on my   profile . 1.   Extended rectangles and trendlines Object will be extended to the right edge of the chart when price will draw new candles on chart. This is rectangle extend
      Grid Manual MT5
      Alfiya Fazylova
      4.87 (15)
      Grid Manual是一个交易面板,用于处理订单网格。 该实用程序是通用的,具有灵活的设置和直观的界面。 它不仅可以在亏损方向上设置订单网格,还可以在盈利方向上设置订单网格。 交易者不需要创建和维护订单网格,实用程序会这样做。 打开一个订单就足够了,Grid manual会自动为它创建一个订单网格,并伴随它直到非常关闭。 完整说明和演示版 此處 。 该实用程序的主要特性和功能: 伴隨以任何方式打開的訂單,包括從移動終端打開的訂單。 適用於兩種類型的網格:“限制”和“停止”。 使用兩種方法計算網格間距:固定和動態(基於 ATR 指標)。 允許您更改未結訂單網格的設置。 顯示圖表上每個網格的盈虧平衡水平。 顯示每個網格的利潤率。 允許您一鍵關閉網格中的盈利訂單。 讓您一鍵關閉每個訂單網格。 允許您對訂單網格應用追踪止損功能。 允許您在訂單網格上應用將訂單網格的止損轉移到盈虧平衡水平的功能。 相對於訂單網格的盈虧平衡水平自動重新排列止盈(僅在限價網格模式下,距離取決於所選的計算類型:“保守”或“激進”)。 最多可管理 20 個訂單網格,每個網格最多可包含 100 個訂單。 計算初始手數時,
      将完全可定制的信号从 MT5 发送到 Telegram,并成为信号提供商! 该产品采用易于使用且具有视觉吸引力的图形界面。 自定义您的设置并在几分钟内开始使用该产品! 用户指南 + 演示  | MT4版本 | 不和谐版本 如果您想尝试演示,请参阅用户指南。 MT5 电报发送器在策略测试器中不起作用。 MT5 转 Telegram 功能 通过大量选项根据您的喜好完全定制信号 在信号之前或之后添加您自己的自定义消息。 这可以是标签、链接、频道或其他任何内容 在信号中添加、删除、自定义表情符号。 或者您可以将它们全部删除。 按交易品种或幻数过滤要发送的交易 排除发送特定符号 排除发送特定幻数 自定义与信号一起发送的交易详细信息 发送带有信号的屏幕截图 自定义要发送的信号类型 发送信号性能的每日、每周、每月和自定义时间报告 我总是愿意改进产品,所以如果您有想要看到的功能,请发表评论或给我留言。
      Risk Manager for MT5
      Sergey Batudayev
      4.42 (12)
      MT5 的 Expert Advisor 风险管理器是一个非常重要的程序,我认为对每个交易者来说都是必要的程序。 使用此 EA 交易,您将能够控制您交易账户中的风险。风险和利润控制可以以货币形式和百分比形式进行。 要让智能交易系统工作,只需将其附加到货币对图表并以存款货币或当前余额的百分比设置可接受的风险值。 PROMO BUY 1 GET 2 FREE -   https://www.mql5.com/en/blogs/post/754725 顾问功能 该风险经理将帮助您控制风险: - 交易 - 每天 - 一个星期 - 一个月 你也可以控制 1) 交易时允许的最大手数 2) 每天最大订单数 3) 每天最大利润 4) 设置 Equity 的获利了结 不仅如此,如果您在设置中指定自动设置,顾问还可以为您设置默认的止损和止盈。 顾问会在每个事件中附上警报,并向您解释删除订单的原因。比如你开了,你开了第6个订单,按照你的规则你每天只允许开5个订单,顾问会立即删除6个并说明原因。 例如,您开仓的手数比您最初向自己指示的手数大,顾问将删除订单并解释原因。
      UTM Manager 是一款直观且易于使用的工具,可提供快速高效的交易执行。其中一项突出的功能是“忽略价差”模式,该模式使您能够以蜡烛的价格进行交易,完全忽略价差(例如,允许在 LTF 上交易更高价差的货币对,避免因价差而退出交易)。 UTM Manager 的另一个关键方面是其独特的本地交易复印机,允许在每个经纪商中灵活地运行不同的交易策略和设置,例如不同的 TP、BE 和风险规则。 交易执行: 快速高效的交易执行:通过点击图表上的入场价格和止损价格或使用一键固定止损尺寸功能轻松进入交易。 自动手数计算:根据预定义的风险设置计算手数,当通过拖动修改仓位时会重新计算手数。 能够同时处理一个或多个职位。 止盈和盈亏平衡: 灵活的止盈设置:通过特定的风险回报 (RR) 比率设置灵活的部分止盈水平。 可配置的自动盈亏平衡功能:当达到一定的利润水平时,将止损移至盈亏平衡点。 用户友好的界面: 用户友好的图形界面 (GUI),可轻松保存和加载设置。 内置帮助工具提示来解释其他功能。 职位定制: 仓位定制和调整:经理将所有仓位绘制在图表上,通过拖动线条即可轻松定制和调整。 图表上的按钮: 图
      Unlimited Trade Copier Pro MT5 is a tool to copy trade remotely to multiple MT4, MT5 and cTrader accounts at different computers/locations over internet. This is an ideal solution for you if you are a signal provider and want to copy your trades to other receivers globally on your own rules. One provider can copy trades to multiple receivers and one receiver can get trade from multiple providers as well. The provider can even set the subscription expiry for each receiver, so that receiver will n
      Stats Dashboard
      Apex Software Ltd
      5 (2)
      概述 使用统计仪表板来跟踪、分析和提升您的交易表现。查看关键统计数据的多种周期,包括每日、每周、每月和自定义周期。通过交互式折线图轻松识别表现最佳和最差的交易工具。 EA 不在策略测试器中运行。联系我们以获取免费试用。 显示的统计数据: 利润 - 利润百分比 & 总净利润($) 交易 - 总交易数 & 胜率 统计数据 - 利润因子 & 恢复因子 胜率 % 回撤 - 资金回撤 % & 余额回撤 % 经纪人费用 - 总佣金 & 总隔夜利息 总交易手数 & 平均交易时长 初始余额 & 当前余额 主要功能 详细的利润和性能指标 实时数据分析 每日摘要报告 月度日历视图 按特定算法(魔法编号)过滤 实时数据分析 访问实时交易数据 :随时掌握最新的市场动态和您的交易表现。 基于实时市场分析做出明智决策 :利用最新数据进行快速准确的交易决策。 每日摘要报告 保持每日绩效摘要更新 :通过详细的日终报告,确保您的活动与目标一致。 全面的指标 :跟踪关键绩效指标,例如总交易数、胜率、利润因子等,以更好地了解您的交易行为和结果。 按特定算法过滤 通过魔法编号过滤交易 :分离并评估不同交易算法或策略的表现。
      Mentfx Mmanage mt5
      Anton Jere Calmes
      4.25 (8)
      The added video will showcase all functionality, effectiveness, and uses of the trade manager. Drag and Drop Trade Manager. Draw your entry and have the tool calculate the rest. Advanced targeting and close portions of a trade directly available in tool (manage trades while you sleep). Market order or limit order on either side with factored spread. Just draw the entry, the tool does the rest. Hotkey setup to make it simple. Draw where you want to enter, and the stop loss, the tool calculates al
      这是一个可视化的交易面板,可帮助您轻松进行交易管理,避免人为错误并增强交易活动。它结合了易于使用的视觉界面以及完善的风险和位置管理方法。 [ 安装指南 | 更新指南 | 故障排除 | 常见问题 | 所有产品 ] 易于使用 从图表轻松交易 精确的风险管理交易,无忧 保本是重中之重 让利润不受您的关注 尽快享受无风险交易 所有已开通交易的自动追踪止损 交易开始后立即设置初始止损 进行交易后,EA将执行以下任务: 初始止损/获利被自动放置 它会尽快锁定自由行(可选) 它将止损首次移动到盈亏平衡点(可选) 它使用您所需的方法跟踪止损,直到止损为止 其他很酷的功能是: 出色的终端活动报告 单一但功能强大的尾随止损方法 干净的图表界面 没有输入参数 我进行交易后会怎样? 这是您进行交易后EA的操作: 它放置初始止损并获利订单。 尽快搭便车并确保保本。默认情况下,这是通过在达到盈亏平衡点时关闭50%的交易来完成的,默认情况下为5点。这意味着,如果您日后被淘汰,您将一无所获(可选)。 盈亏平衡后,跟踪止损开始运行。 它跟踪止损,直到止损为止,让利润运行。 尾随止损如何运作? 追踪止损表示
      交易面板一键交易。 处理仓位和订单! 通过 图表 或 键盘 进行交易 。 使用我们的交易面板,您只需单击一下即可直接从图表中执行交易,执行交易操作的速度比使用标准 MetaTrader 控件快 30 倍。 参数和函数的自动计算使交易者的交易更加快捷、方便。 图形提示、信息标签和有关贸易交易的完整信息均位于图表 MetaTrader 上。 MT4版本 详细描述   +DEMO +PDF 如何购买 如何安装     如何获取日志文件     如何测试和优化     Expforex 的所有产品 打开和关闭、反转和锁定、部分关闭/Autolot。虚拟/真实止损/止盈/追踪止损/盈亏平衡,订单网格... МetaТrader 5 中主要订单的交易控制面板 :买入、卖出、buystop、buylimit、sellstop、selllimit、平仓、删除、修改、追踪止损、止损、获利。 有 5 个选项卡 可用:头寸、挂单、账户信息、信号和总利润。 Description on English VirtualTradePad在“  MQL5语言最佳图形面板  ”竞赛中 获得二等奖 。 注意
      KT Equity Protector MT5
      KEENBASE SOFTWARE SOLUTIONS
      5 (1)
      KT Equity Protector EA consistently monitors the account equity and closes all the market and pending orders once the account equity reached a fixed equity stop loss or profit target.  After closing all trading positions, the EA can close all open charts to stop other expert advisors from opening more trading positions. Equity Stop-Loss If your current account balance is $5000 and you set an equity stop loss at $500. In this case, the KT Equity Protector will close all the active and pending
      作者的更多信息
      Candle Timer Countdown
      JETINVEST
      4.78 (67)
      Candle Timer Countdown 显示当前柱线关闭并形成新柱线之前的剩余时间。 它可以用于时间管理。 MT4版本在这里! 功能亮点 跟踪服务器时间而不是本地时间 可配置的文本颜色和字体大小 符号每日变化的可选可视化 优化以减少 CPU 使用率 输入参数 显示每日变化:真/假 文本字体大小 文字颜色 如果您仍有疑问,请通过直接消息与我联系: https://www.mql5.com/zh/users/robsjunqueira/ 如果可能,请留下您的评论和评论,以帮助向社区传播信息。 还可以了解我们的其他指标和专家顾问。 我有几种有用的指标和专家顾问。 如果您有任何建议,请随时提出建议,这样我才能改进产品,使持续改进永无止境。
      FREE
      MACD Intraday Trend
      JETINVEST
      4.76 (45)
      MACD 日内趋势是通过改编自 Gerald Appel 在 1960 年代创建的原始 MACD 而开发的指标。 通过多年的交易,观察到通过使用斐波那契比例更改 MACD 的参数,我们可以更好地呈现趋势运动的连续性,从而可以更有效地检测价格趋势的开始和结束。 由于其检测价格趋势的效率,还可以非常清楚地识别顶部和底部的背离,从而更好地利用交易机会。 请务必尝试我们具有可配置功能和警报的专业版本: MACD Intraday Trend PRO 特征 适用于任何货币对 在任何时间范围内工作 适用于 Renko 图表 如果您仍有疑问,请通过直接消息与我联系: https://www.mql5.com/zh/users/robsjunqueira/ ----------------------------------------- 如果可能,请留下您的评论和评论,以帮助向社区传播信息。 还可以了解我们的其他指标和专家顾问。 我有几种有用的指标和专家顾问。 如果您有任何建议,请随时提出建议,这样我才能改进产品,使持续改进永无止境。
      FREE
      Candle Timer Countdown 显示当前柱线关闭并形成新柱线之前的剩余时间。 它可以用于时间管理。 MT5版本在这里 ! 功能亮点 跟踪服务器时间而不是本地时间 可配置的文本颜色和字体大小 符号每日变化的可选可视化 优化以减少 CPU 使用率 输入参数 显示每日变化:真/假 文本字体大小 文字颜色 如果您仍有疑问,请通过直接消息与我联系: https://www.mql5.com/zh/users/robsjunqueira/ 如果可能,请留下您的评论和评论,以帮助向社区传播信息。 还可以了解我们的其他指标和专家顾问。 我有几种有用的指标和专家顾问。 如果您有任何建议,请随时提出建议,这样我才能改进产品,使持续改进永无止境。
      FREE
      Tabajara VWAP Ogro RSJ
      JETINVEST
      4.81 (32)
      Setup Tabajara 是由一位被称为“华尔街的 OGRO”的巴西交易员创建的。 这种设置的想法是向交易者表明当前的价格趋势和应该在图表中寻找的操作类型。 手术 它通过将蜡烛的收盘价和 VWAP 定位到上午 10:40 和之后的 20 个周期的算术平均值来实现这一点,以 4 种可能的颜色绘制蜡烛: 绿色 -> 价格呈上升趋势(搜索购买入口点) 黑色 -> 看涨趋势中的价格修正(搜索购买切入点) 红色 -> 价格在下降趋势中下降(搜索销售切入点) 白色 -> 在下降趋势中修正价格(搜索销售切入点) 另外,我还在脚本中放入了以下指标: 8 个时期的指数平均值:识别短期价格变动 50 个周期的算术平均值:确定中期价格变动 80 个时期的指数平均值:确定中期价格变动 200 个周期的算术平均值:确定长期价格变动 如果您仍有疑问,请通过直接消息与我联系: https://www.mql5.com/zh/users/robsjunqueira/
      FREE
      Pivot Point Fibo RSJ
      JETINVEST
      4.29 (17)
      枢轴点斐波那契 RSJ 是一个指标,它使用斐波那契汇率追踪当天的支撑线和阻力线。 这个壮观的指标使用斐波那契汇率通过枢轴点创建多达 7 个支撑位和阻力位。 价格如何尊重该支撑和阻力的每个水平真是太棒了,在那里可以感知操作的可能进入/退出点。 特征 多达 7 个支撑位和 7 个阻力位 单独设置级别的颜色 输入 枢轴类型 Pivot Fibo RSJ1 = Fibo ratio 1 计算 Pivot Fibo RSJ2 = Fibo ratio 2 计算 Pivot Fibo RSJ3 = Fibo ratio 3 计算 Pivot Fibo Classic = 经典枢轴计算 最低枢轴级别 旋转 3 个级别 旋转 4 个级别 旋转 5 个级别 枢轴 6 个级别 旋转 7 个级别 如果您仍有疑问,请通过直接消息与我联系: https://www.mql5.com/zh/users/robsjunqueira/
      FREE
      蜡烛计数器是一个指标,用于打印当天第一根蜡烛的蜡烛数量。 当天的第一根蜡烛将是数字 1,在此计数中,每根新蜡烛都会增加 1。 输入参数 从偶数、奇数或全部中选择 从蜡烛到打印数字的距离 文本字体大小 文字字体颜色 如果您仍有疑问,请通过直接消息与我联系: https://www.mql5.com/zh/users/robsjunqueira/ ----------------------------------------- 如果可能,请留下您的评论和评论,以帮助向社区传播信息。 还可以了解我们的其他指标和专家顾问。 我有几种有用的指标和专家顾问。 如果您有任何建议,请随时提出建议,这样我才能改进产品,使持续改进永无止境。
      FREE
      MACD 日内趋势是通过改编自 Gerald Appel 在 1960 年代创建的原始 MACD 而开发的指标。 通过多年的交易,观察到通过使用斐波那契比例更改 MACD 的参数,我们可以更好地呈现趋势运动的连续性,从而可以更有效地检测价格趋势的开始和结束。 由于其检测价格趋势的效率,还可以非常清楚地识别顶部和底部的背离,从而更好地利用交易机会。 请务必尝试我们具有可配置功能和警报的专业版本: MACD Intraday Trend PRO 特征 适用于任何货币对 在任何时间范围内工作 适用于 Renko 图表 如果您仍有疑问,请通过直接消息与我联系: https://www.mql5.com/zh/users/robsjunqueira/ ----------------------------------------- 如果可能,请留下您的评论和评论,以帮助向社区传播信息。 还可以了解我们的其他指标和专家顾问。 我有几种有用的指标和专家顾问。 如果您有任何建议,请随时提出建议,这样我才能改进产品,使持续改进永无止境。
      FREE
      枢轴点斐波那契 RSJ 是一个指标,它使用斐波那契汇率追踪当天的支撑线和阻力线。 这个壮观的指标使用斐波那契汇率通过枢轴点创建多达 7 个支撑位和阻力位。 价格如何尊重该支撑和阻力的每个水平真是太棒了,在那里可以感知操作的可能进入/退出点。 特征 多达 7 个支撑位和 7 个阻力位 单独设置级别的颜色 输入 枢轴类型 Pivot Fibo RSJ1 = Fibo ratio 1 计算 Pivot Fibo RSJ2 = Fibo ratio 2 计算 Pivot Fibo RSJ3 = Fibo ratio 3 计算 Pivot Fibo Classic = 经典枢轴计算 最低枢轴级别 旋转 3 个级别 旋转 4 个级别 旋转 5 个级别 枢轴 6 个级别 旋转 7 个级别 如果您仍有疑问,请通过直接消息与我联系: https://www.mql5.com/zh/users/robsjunqueira/
      FREE
      Tabajara Ogro
      JETINVEST
      4.7 (10)
      Setup Tabajara was created by a Brazilian trader known as  "The OGRO of Wall Street" . The idea of this setup is to indicate to the trader the current trend of prices and  the type of operation should be looked for in the graph. Operation It does this through the relation of the closing price position and the     of 20 periods, by painting the candles in 4 possible colors : Green -> Price rising in upward trend (Search entry points for PURCHASE) Black -> Price correcting in Bullish Trend
      FREE
      Weis Waves RSJ
      JETINVEST
      4.57 (7)
      The Weis Waves RSJ Indicator sums up volumes in each wave. This is how we receive a bar chart of cumulative volumes of alternating waves. Namely the cumulative volume makes the Weis wave charts unique. It allows comparing the relation of the wave sequence characteristics, such as correspondence of the applied force (expressed in the volume) and received result (the price progress). If you still have questions, please contact me by direct message:  https://www.mql5.com/en/users/robsjunqueira/
      FREE
      VWAP Fibo Bands RSJ
      JETINVEST
      4.89 (9)
      VWAP Fibo Bands RSJ is an indicator that traces the lines of the daily VWAP and from it creates bands using Fibonacci proportions. This spectacular indicator creates 10 band levels through the selected VWAP period using Fibonacci ratios. It is fantastic how the prices respect each level of the bands, where it is possible to realize that almost every time the price closes above / below a level of the bands he will seek the next one. If close above will seek to reach the level above and if close
      FREE
      Vwap RSJ
      JETINVEST
      4.88 (8)
      VWAP RSJ is an indicator that plots the Hourly, Daily, Weekly and Monthly  VWAP Lines. Large institutional buyers and   mutual funds   use the VWAP ratio to help move into or out of stocks with as small of a market impact as possible. Therefore, when possible, institutions will try to buy below the VWAP, or sell above it. This way their actions push the price back toward the average, instead of away from it. Based on this information I developed this indicator that combines 4 types of VWAP T
      FREE
      MACD 日內趨勢 PRO 是通過改編自 Gerald Appel 在 1960 年代創建的原始 MACD 而開發的指標。 通過多年的交易,觀察到通過使用斐波那契比例更改 MACD 的參數,我們可以更好地呈現趨勢運動的連續性,從而可以更有效地檢測價格趨勢的開始和結束。 由於其檢測價格趨勢的效率,還可以非常清楚地識別頂部和底部的背離,從而更好地利用交易機會。 特徵 MACD 日內趨勢 PRO 指標適用於任何貨幣對、任何時間範圍以及 Renko 圖表。 可以通過選擇 6 種模式來設置趨勢檢測速度: 最快的 快速地 普通的 減緩 最慢 資源 它有 6 個可配置的警報: MACD回調信號線 MACD穿越信號線 MACD穿過零水平 信號線過零電平 MACD 變化趨勢顏色 信號線變化趨勢顏色 對於每個警報,可以配置: 彈出 聲音(有 13 種聲音可用。) 智能手機通知 彈出窗口和聲音 彈出窗口和智能手機通知 聲音和智能手機通知 彈出窗口、聲音和智能手機通知 與智能交易系統或其他指標集成 有 8 個緩衝區可用於訪問和與專家顧問或其他指標集成,即使關閉警報,它們也會被填滿,它
      This simple indicator paints with a darker color on the volume bar when the quantity traded is above the average of select number of periods of the volume itself, highlighting the moments when there was a large volume of deals above the average. It is also possible to use a configuration of four colors where the color tone shows a candle volume strength. The indicator defaults to the simple average of 20 periods, but it is possible to change to other types of averages and periods. If you like
      FREE
      Aggression Wave RSJ
      JETINVEST
      4.83 (6)
      This indicator sums up the difference between the sells aggression and the buys aggression that occurred in each Candle, graphically plotting the waves of accumulation of the aggression volumes.   Through these waves an exponential average is calculated that indicates the direction of the business flow. Note: This indicator DOES NOT WORK for Brokers and/or Markets WITHOUT the type of aggression (BUY or SELL).   Be sure to try our Professional version with configurable features and alerts:  Agr
      FREE
      This simple indicator paints with a darker color on the volume bar when the quantity traded is above the average of select number of periods of the volume itself, highlighting the moments when there was a large volume of deals above the average. It is also possible to use a configuration of four colors where the color tone shows a candle volume strength. The indicator defaults to the simple average of 20 periods, but it is possible to change to other types of averages and periods. If you like
      FREE
      This indicator calculates the difference between the SELL aggression and the BUY aggression that occurred in each Candle, plotting the balance of each one graphically. Note: This indicator DOES NOT WORK for Brokers and/or Markets WITHOUT the type of aggression (BUY or SELL). Be sure to try our   Professional   version with configurable features and alerts:   Delta Agression Volume PRO Settings Aggression by volume (Real Volume) or by number of trades (Tick Volume) Start of the Aggression De
      FREE
      RENKO PRICE ACTION ATR 是通过构建 Renko 图表开发的“智能交易系统”,其中每个 BRICK 的大小都通过用户选择的时间段的 ATR 计算得出。 Renko 图表旨在滤除微小的价格变动,从而使交易者更容易关注重要趋势。 由于其检测价格趋势的效率,还可以清楚地识别支撑和阻力以及顶部和底部背离,从而更好地利用交易机会。 手术 RENKO PRICE ACTION ATR 适用于任何货币对。 RENKO PRICE ACTION ATR 具有出色的实时更新性能。 设置 ATR Calculation Timeframe:用户选择的 RENKO PRICE ACTION ATR 周期,以应用 ATR 的平均值并计算/重新计算每个 BRICK 的大小。 ATR 计算平均周期:用户选择的 ATR 平均周期为 RENKO PRICE ACTION ATR 执行每个 BRICK 的大小计算。 ATR 大小的百分比:用于形成每个 BRICK 的计算大小的百分比。 如果您还有问题,请通过直接消息与我联系:  https://www.mql5.com/zh/users
      指标供需 RSJ PRO 计算并在图表上绘制“供应”和“需求”区域,识别区域类型(弱、强、已验证、已证明),并在区域重新测试的情况下显示它的次数被重新测试。 “供应”区是出现供大于求的价格区域,导致价格下跌。 “需求”区域是需求大于供应的价格区域,从而推高价格。 请务必尝试我们具有可配置功能和警报的专业版本: Suppy Demand RSJ PRO 区域分类 弱:价格区域,如果重新测试,可能会被违反。 强:价格区域已经改变了趋势方向,不太可能很快被重新测试。 已验证:强价区,最多有1-3次复测,但价格未能突破该区。 证明:强势价格区域,有3次或以上复测,但价格未能突破该区域。 Broken/Turncoat:被打破的价格区域,在支撑的情况下成为阻力,在阻力成为支撑的情况下。 设置 显示区域标签和信息:真实案例在区域的右侧写下区域类型和重新测试的次数(如果适用)。 注意:仅当图表偏移选项处于活动状态时才有效。 字体颜色:设置文本的颜色 字体大小:设置字体大小 如果您仍有疑问,请通过直接消息与我联系: https://www.mql5.com/zh/users/
      MACD 日內趨勢 PRO 是通過改編自 Gerald Appel 在 1960 年代創建的原始 MACD 而開發的指標。 通過多年的交易,觀察到通過使用斐波那契比例更改 MACD 的參數,我們可以更好地呈現趨勢運動的連續性,從而可以更有效地檢測價格趨勢的開始和結束。 由於其檢測價格趨勢的效率,還可以非常清楚地識別頂部和底部的背離,從而更好地利用交易機會。 特徵 MACD 日內趨勢 PRO 指標適用於任何貨幣對、任何時間範圍以及 Renko 圖表。 可以通過選擇 6 種模式來設置趨勢檢測速度: 最快的 快速地 普通的 減緩 最慢 資源 它有 6 個可配置的警報: MACD回調信號線 MACD穿越信號線 MACD穿過零水平 信號線過零電平 MACD 變化趨勢顏色 信號線變化趨勢顏色 對於每個警報,可以配置: 彈出 聲音(有 13 種聲音可用。) 智能手機通知 彈出窗口和聲音 彈出窗口和智能手機通知 聲音和智能手機通知 彈出窗口、聲音和智能手機通知 與智能交易系統或其他指標集成 有 8 個緩衝區可用於訪問和與專家顧問或其他指標集成,即使關閉警報,它們也會被填滿,它
      Aggression Wave PRO 是一个指标,用于监测买卖谈判的侵略量的分歧、强度和连续性。 Agrression Wave PRO 具有允许您查看超过当天累积增量的功能。 注意:该指标不适用于没有攻击类型(买入或卖出)的经纪商和/或市场。加密货币和外汇不提供此类信息,也就是说,它不能与它一起使用。 手术     可以设置音量类型:         真实交易量(在此模式下,每笔资产交易的交易量都会被计算在内)         Ticks Volume(在此模式下,将统计资产的交易数量。)     可以定义计算的开始时间:         当前日期         最后一天         LAST_TWODAYS         LAST_FOURDAYS         上个星期         上个月         LAST_6MONTHS         去年         LAST_2YEARS         ALL_AVAILABLE_DAYS     可以配置信号线:         方法:SMA / EMA / SMMA / LWMA  
      Delta Aggression Volume PRO is an indicator developed to monitor the strength and continuity of the aggression volume of sell and buy negotiations. Note: This indicator DOES NOT WORK for Brokers and/or Markets WITHOUT the type of aggression (BUY or SELL). Cryptocurrencies and Forex do not provide this type of data, that is, it does not work with them. O Delta Agrression Volume PRO has features that allow you to view beyond the delta volume of the day. Operation Multi symbols  (those who pro
      指标供需 RSJ PRO 计算并在图表上绘制“供应”和“需求”区域,识别区域类型(弱、强、已验证、已证明),并在区域重新测试的情况下显示它的次数 被重新测试。 “供应”区是出现供大于求的价格区域,导致价格下跌。 “需求”区域是需求大于供应的价格区域,从而推高价格。 区域分类 弱:价格区域,如果重新测试,可能会被违反。 强:价格区域已经改变了趋势方向,不太可能很快被重新测试。 已验证:强价区,最多有1-3次复测,但价格未能突破该区。 证明:强势价格区域,有3次或以上复测,但价格未能突破该区域。 Broken/Turncoat:被打破的价格区域,在支撑的情况下成为阻力,在阻力的情况下成为支撑。 设置 视觉设置: 显示弱区:将显示分类为弱的区域。 显示未测试区域:将显示未测试区域。 Show Broken Zones:显示被破坏的区域 合并区域:指标将非常接近的区域转换为更宽的区域 扩展区域:指标将检查是否有与绘制区域对应的先前限制,并将扩展相同 计算设置: 用于分析的蜡烛数量:指标将用于对区域进行分类的蜡烛数量。 它可以在 500 到 5000 根蜡烛之间。 ATR 周期:用于计算 A
      Trend WDO B3
      JETINVEST
      5 (1)
      Trend WDO B3 是为 MT5 平台创建的专业交易系统,并优化与巴西 B3 上的 MINI DOLAR INDEX (WDO) 配合使用. 系统在多个时间段(1M、5M、15M、30M、H1、H4、D1)中使用模糊逻辑来识别价格趋势,根据计算结果在每个时间段应用权重。 识别趋势后,系统根据平均波动率设置止损单(买入或卖出),开仓时,EA通过追踪止损进行交易,始终追求利润最大化. 主要特点 不使用鞅 不使用网格 在图表上显示通过模糊算法计算出的趋势 适用于任何时间范围 可配置的工作时间 可配置的开口间隙控制 可配置的批量增加动态模式 4 个可配置的追踪止损水平 通过访问包含产品手册和视频的博客了解更多详细信息和信息:  https://www.mql5.com/pt/blogs/post/745864 如果您还有问题,请通过直接消息与我联系:  https://www.mql5.com/zh/users/robsjunqueira/
      Trend WIN B3
      JETINVEST
      5 (4)
      Trend WIN B3 是为 MT5 平台创建的专业交易系统,并优化与巴西 B3 上的 MINI FUTURE INDEX (WIN) 配合使用. 系统在多个时间段(1M、5M、15M、30M、H1、H4、D1)中使用模糊逻辑来识别价格趋势,根据计算结果在每个时间段应用权重。 识别趋势后,系统根据平均波动率设置止损单(买入或卖出),开仓时,EA通过追踪止损进行交易,始终追求利润最大化. 主要特点 不使用鞅 不使用网格 在图表上显示通过模糊算法计算出的趋势 适用于任何时间范围 可配置的工作时间 可配置的开口间隙控制 可配置的批量增加动态模式 4 个可配置的追踪止损水平 通过访问包含产品手册和视频的博客了解更多详细信息和信息:  https://www.mql5.com/pt/blogs/post/745842 如果您还有问题,请通过直接消息与我联系:  https://www.mql5.com/zh/users/robsjunqueira/
      SniperBot EURUSD
      JETINVEST
      5 (1)
      EA 使用波动率、点差、频率和时机来决定何时交易。 EA 使用限价单方法开仓。 在这种情况下,滑点至多在执行条目时为正。 EA 使用追踪止盈逻辑,因为系统的重点是在保护您的资本的同时赚钱。 大多数交易都很快关闭,就像狙击手爆头一样。 主要特点 不使用鞅 不使用网格 优化货币对:EURUSD 时间范围:M5 请注意这一点:该 EA 每天只在一段时间内进行交易,从展期前几分钟到展期后几分钟。 您不需要 .set 文件,所有设置都存储在 EA 中 如果您的经纪商使用后缀(例如 XXXXXX.a),您不必担心,因为 EA 会自动识别。 如何安装 该系统是独立的,应该在 VPS 上持续运行。 建议在低点差 ECN 经纪商上运行 EA。 该帐户可以是 Netting 或 Hedging。建议杠杆为 1:500。 在 M5 时间范围内运行 EURUSD 对 选择固定手数或启用自动手数 如果您选择了自动手数,您应该为每 0.01 手选择货币关系 低风险:200,正常风险:100,高风险:50 推荐账户余额:100$ 如果您仍有疑问,请通过直接消息与我联系: https://www.mql
      Sniper Major
      JETINVEST
      5 (1)
      EA 使用波动率、点差、频率和时机来决定何时交易。 EA 使用限价单方法开仓。 在这种情况下,滑点至多在执行条目时为正。 EA 使用追踪止盈逻辑,因为系统的重点是在保护您的资本的同时赚钱。 大多数交易都很快关闭,就像狙击手爆头一样。 主要特点 不使用鞅 不使用网格 优化的货币对:EURUSD |英镑兑美元 |美元兑日元 |美元兑瑞郎 时间范围:M5 请注意这一点:该 EA 每天只在一段时间内进行交易,从展期前几分钟到展期后几分钟。 一张图表设置:您只需要一张图表即可交易所有优化的交易品种 多种货币对支持 您不需要 .set 文件,所有设置都存储在 EA 中 如果您的经纪商使用后缀(例如 XXXXXX.a),您不必担心,因为 EA 会自动识别。 如何安装 该系统是独立的,应该在 VPS 上持续运行。 建议在低点差 ECN 经纪商上运行 EA。 该帐户可以是 Netting 或 Hedging。建议杠杆为 1:500。 在 M5 时间范围内运行 EURUSD 对 启用多对 = 设置为 TRUE 选择固定手数或启用自动手数 如果您选择了自动手数,您应该为每 0.01 手选择货币
      JetBot
      JETINVEST
      This is an EXPERT with a FOCUS on LEARNING and PROFESSIONAL DEVELOPMENT!!! The idea of this product is to commercialize the source code, allowing those who want to develop their own robots, or start a professional activity developing customized experts, to have a reference source code that helps them in the learning and development process. This source code will be increased, that is, new functionalities will be created, thus allowing the project to continue evolving. For every 10 sales a new v
      This is an EXPERT with a FOCUS on LEARNING and PROFESSIONAL DEVELOPMENT!!! The idea of this product is to commercialize the source code, allowing those who want to develop their own robots, or start a professional activity developing customized experts, to have a reference source code that helps them in the learning and development process. This source code will be increased, that is, new functionalities will be created, thus allowing the project to continue evolving. For every 10 sales a new v
      This is an EXPERT with a FOCUS on LEARNING and PROFESSIONAL DEVELOPMENT!!! The idea of this product is to commercialize the source code, allowing those who want to develop their own robots, or start a professional activity developing customized experts, to have a reference source code that helps them in the learning and development process. This source code will be increased, that is, new functionalities will be created, thus allowing the project to continue evolving. For every 10 sales a new v
      筛选:
      xingche
      24
      xingche 2023.10.07 09:51 
       

      用户没有留下任何评级信息

      JETINVEST
      272879
      来自开发人员的回复 Roberto Sant Ana Junqueira 2023.10.08 17:39
      tks
      Nitirojn Vichaikasampong
      97
      Nitirojn Vichaikasampong 2021.07.25 07:36 
       

      good

      JETINVEST
      272879
      来自开发人员的回复 Roberto Sant Ana Junqueira 2021.07.25 13:36
      tks
      Renan Fernandes Souza
      187
      Renan Fernandes Souza 2021.07.15 11:00 
       

      Esta boleta é uma ferramenta essencial para o trader que quer otimizar as suas operações. Parabéns Roberto, ficou muito bom.

      JETINVEST
      272879
      来自开发人员的回复 Roberto Sant Ana Junqueira 2021.07.25 13:36
      Muito obrigado.
      Fabio_Novaes
      175
      Fabio_Novaes 2021.06.30 21:40 
       

      用户没有留下任何评级信息

      JETINVEST
      272879
      来自开发人员的回复 Roberto Sant Ana Junqueira 2021.06.30 23:09
      tks
      Marilise Ravaglio Da Cunha Junqueira
      386
       

      用户没有留下任何评级信息

      JETINVEST
      272879
      来自开发人员的回复 Roberto Sant Ana Junqueira 2021.06.30 15:59
      Tks for your review.
      FLX700
      16
      FLX700 2021.06.05 16:49 
       

      Roberto, em primeiro lugar parabéns pelo excelente trabalho. Sua ferramenta é excelente, na minha opinião ela é indiscutivelmente a melhor entre as gratuitas, eu a avalio com 4.5 de 5. Gostaria de fazer 3 sugestões/críticas para o aprimoramento da mesma. Eu senti falta de um recurso que para mim é o mais importante que é abrir ordens pelo risco e não apenas por lote. Gostaria de ter a opção "RISK %" pois no meu modo trabalhar essa opção é essencial. Outra coisa que sinto muita falta é o stop e gain poderem ser baseados no ATR o que facilita bastante no gerenciamento. E a terceira é apenas um pequeno detalhe. Acho que a boleta poderia ser um pouco mais estreita, pois acho que ela ocupa muito espaço. Espero que esse comentário possa ajudar nos aprimoramentos futuros. No mais, parabéns pelo trabalho. Forte abraço e sucesso!

      JETINVEST
      272879
      来自开发人员的回复 Roberto Sant Ana Junqueira 2021.06.05 16:56
      Bom dia. Muito obrigado pelos comentários. Vou rever sobre ser mais estreita, pois na verdade testei com vários ativos de forex, crypto e os daqui do Brasil, e dependendo (principalmente no Dólar e Índice) do tamanho de lote o espaço mínimo era este para que todas as informações ficassem bem visíveis sem ter que reduzir a fonte. Sobre as outras opções elas vão existir na versão PRO que lançarei nos próximos dias.
      回复评论