Easy Channel
- 指标
- Denis Glaz
- 版本: 1.1
- 更新: 28 十一月 2021
- 激活: 5
Channel indicator based on the principles of mathematical statistics. It uses neural networks to simplify a lot of complex calculations, which makes the indicator fast, even for weak computers.
How it works
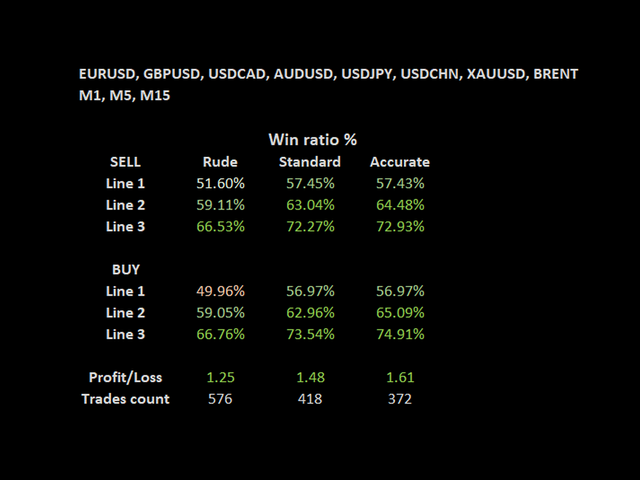
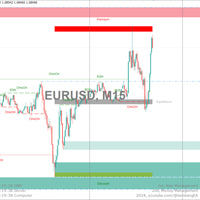
The indicator is based on the moving average, the period of which you can set. The indicator analyzes price deviations from the moving average line for the last 1440 or 2880 bars, and each line indicates a certain probability of a price reverse depending on the selected settings: Standard, Accurate, Rude. At the higher accuracy, you will get more quality signals, but they become less frequent. Each set has 3 dotted lines on each side and the numbers in brackets indicate the probability of a price reverse, and the number of analyzed bars.
Input parameters
Main parameters:
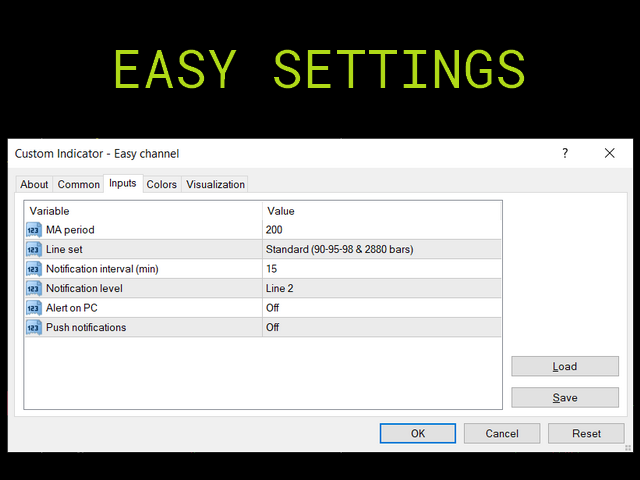
- MA period - middle line period.
- Line set - a set of settings. Rude, Standard, Accurate - the higher the accuracy, the better the quality of the signals, but they become less frequent. Each set has 3 dotted lines on each side and the numbers in parentheses indicate the probability of a price reversal. Red solid line is equivalent to 100% probability
- Notification interval - minimum interval in minutes between notifications.
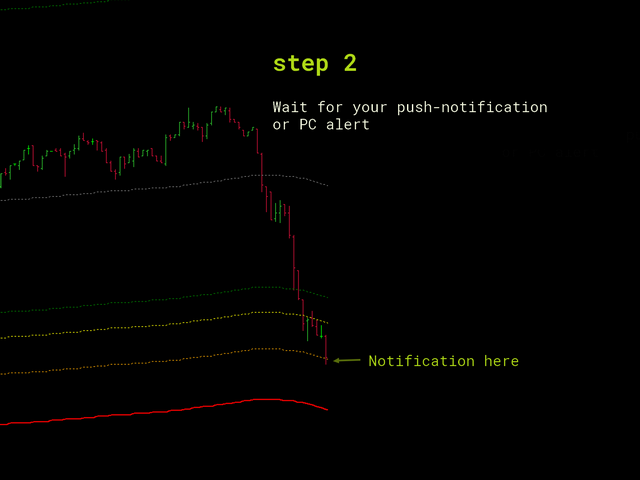
- Notification level - the level above / below which notifications will be triggered. Green is the first level, yellow is the second level, and orange is the third.
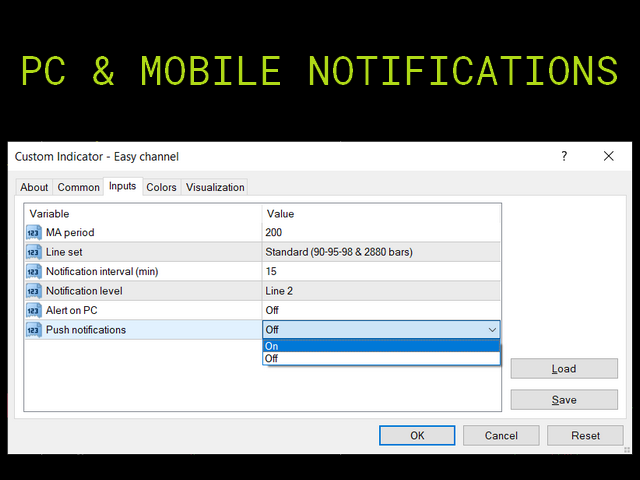
- Alert on PC - notifications in the terminal on the computer.
- Push notifications - notifications to the phone.
How to trade
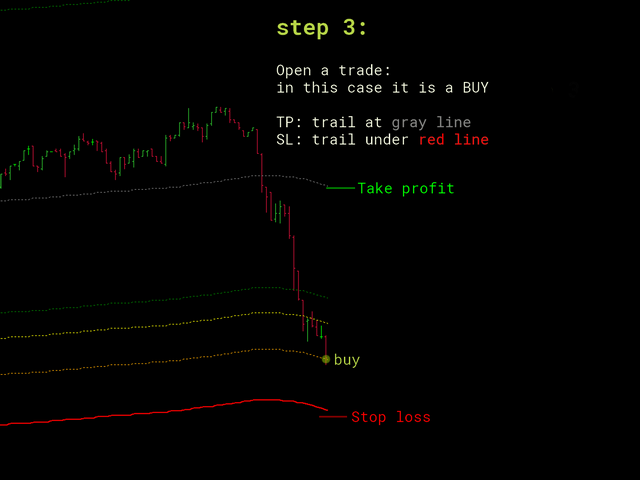
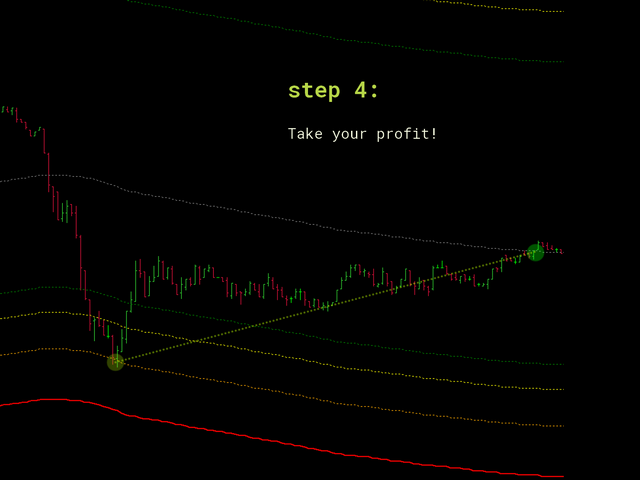
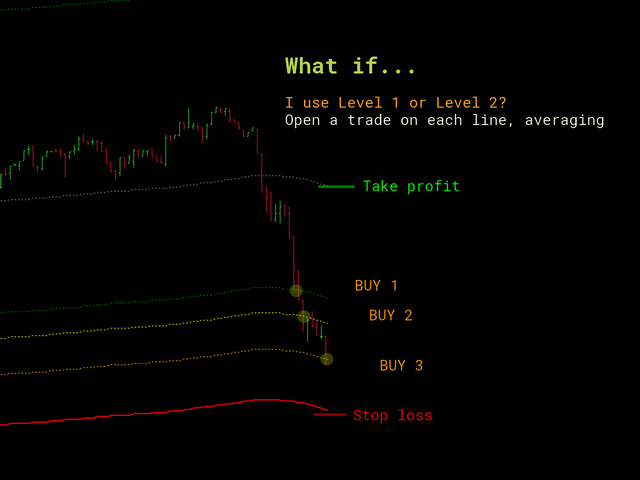
- М15 (short-term strategy) - quite simple here. I am waiting for a signal at level 2 or 3, when the price moves back to the center. I confirm the trend on the daily timeframe and open a trade. I set Stop Loss behind the high/low of the price, and set Take profit on the gray line and move it.
- D1 (medium-term strategy) - sell when my manual horizontal level is broken from top to bottom, if the price is above the green line, and backwards when buying. This is a more professional approach, but works great.
The red solid line is equivalent to a 100% probability of a reversal, but this is conditional. If the price has broken through it, it means that such a situation has not been encountered in the analyzed bars.






















用户没有留下任何评级信息