Volume Bands Chart
- 指标
- Rafael Caetano Pinto
- 版本: 1.0
- 激活: 5
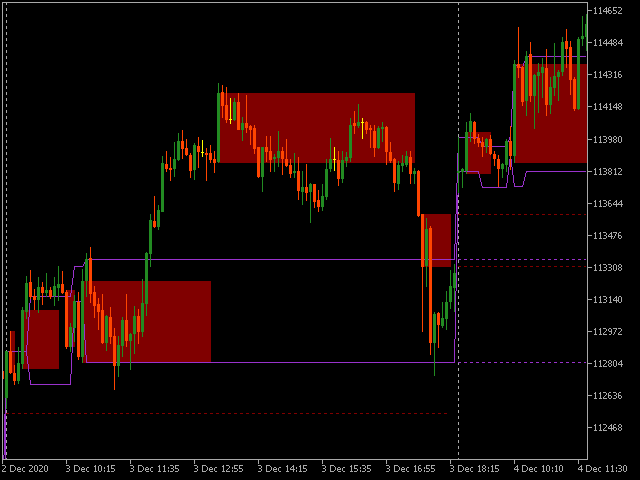
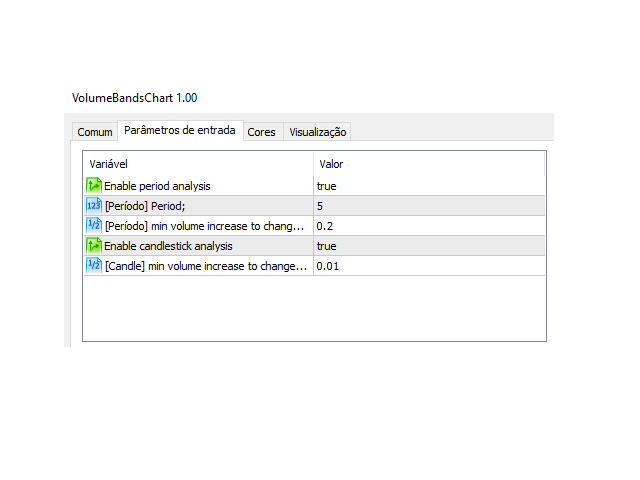
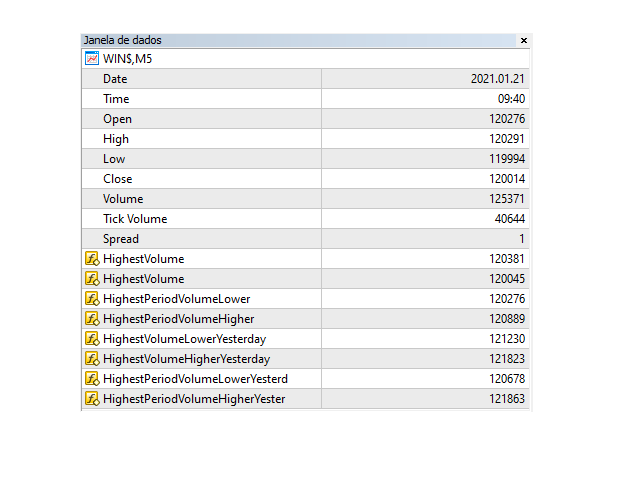
This indicator marks the relevant volume levels among the day. The two relevant levels are the candle with more volume and the period with more volume of lots transacted.
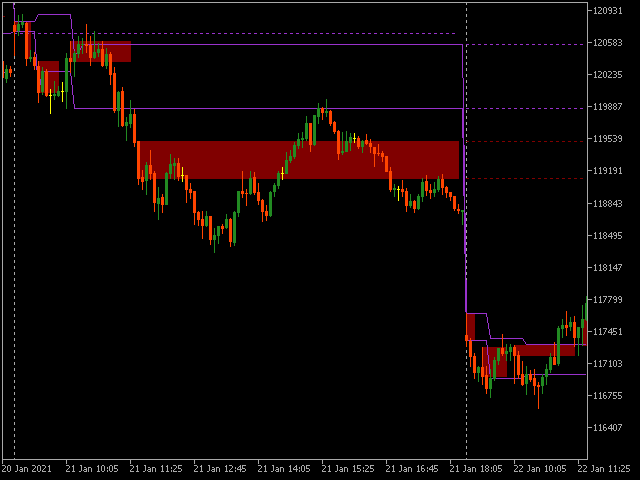
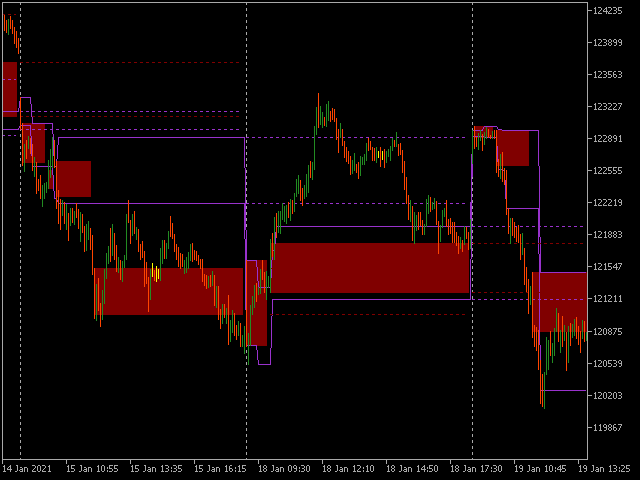
The filled red background is the range of price with the most relevant volume of the day (probably the big player that is command the game). The purple lines shows the range of price with most volume (probably a area where some big player is accumulating before force a market direction). There is also the dot lines that marks the volume ranges of the day before.
You can notice that the volume levels marked by indicator become support/resistence areas even without peaks/valleys that graphical analysis usually uses.
To EA programmers: This indicator does not redraw. It's safe to use with EAs.

